Orlovista, FL (Florida) Houses and Residents
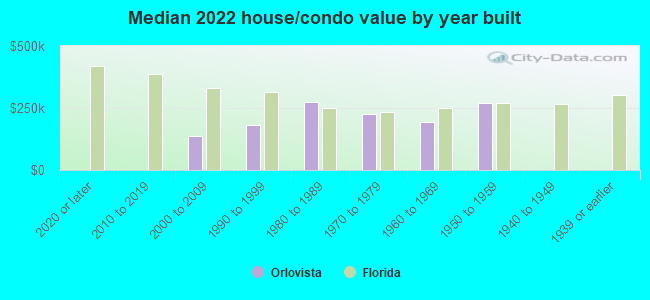
| Orlovista: | $209,217 |
| Florida: | $354,100 |
Mean price in 2022:
Detached houses: $161,779
Here: $161,779 State: $500,941 Mobile homes: $44,160
Here: $44,160 State: $113,202
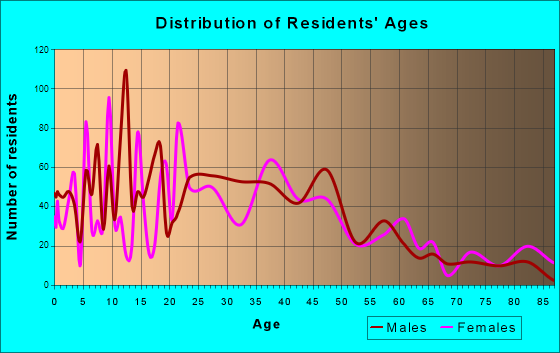
Total population: 6,123 (Urban population: 6,080, Rural population: 0)
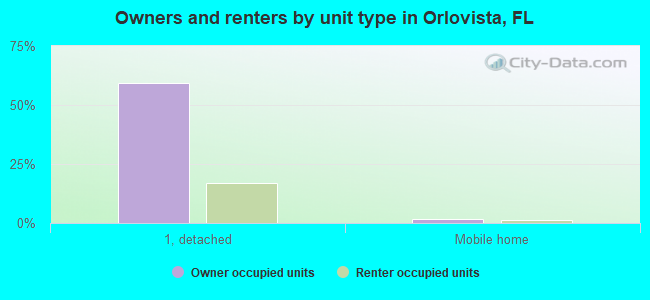
Houses: 2,549 (2,324 occupied: 1,491 owner occupied, 989 renter occupied)
| % of renters here: | 40% |
| State: | 33% |
Housing density: 1,321 houses/condos per square mile
Median price asked for vacant for-sale houses and condos in 2022: $203,511.
Median contract rent in 2022: $1,027 (lower quartile is $762, upper quartile is $1,433)
Median rent asked for vacant for-rent units in 2022: $2,343
Median gross rent in Orlovista, FL in 2022: $1,209
Housing units in Orlovista with a mortgage: 906 (171 second mortgage, 0 home equity loan, 75 both second mortgage and home equity loan)
Houses without a mortgage: 0
Median household income for houses/condos with a mortgage: $58,099
Median household income for apartments without a mortgage: $45,700
Median monthly housing costs: $1,083
Compare current foreclosures near Orlovista, FL:
| Photo | Address | Area | Beds / Baths | Price | Details |
|---|---|---|---|---|---|

|
#1
Anzle Ave
Winter Park, FL 32789
|
1,808 sq. feet
|
2 baths 3 beds |
$549,900
|
show details |

|
#2
Idaho Ave
Orlando, FL 32809
|
1,326 sq. feet
|
2 baths 3 beds |
$279,000
|
show details |

|
#3
Cannon Way
Casselberry, FL 32707
|
1,428 sq. feet
|
1 baths 3 beds |
$340,000
|
show details |

|
#4
Ford St
Orlando, FL 32811
|
726 sq. feet
|
1 baths 2 beds |
$245,000
|
show details |

|
#5
Anna Dr
Apopka, FL 32703
|
864 sq. feet
|
1 baths 3 beds |
$146,500
|
show details |

|
#6
Bahia Ave
Orlando, FL 32807
|
1,877 sq. feet
|
1 baths 3 beds |
show details | |

|
#7
Forest St
Orlando, FL 32806
|
1,971 sq. feet
|
2 baths 3 beds |
show details | |

|
#8
Autumn Chase Cir
Sanford, FL 32773
|
2,465 sq. feet
|
3 baths 4 beds |
show details | |

|
#9
Palio Ct
Ocoee, FL 34761
|
3,227 sq. feet
|
3 baths 4 beds |
show details | |

|
#10
Cardiff Dr
Orlando, FL 32837
|
1,490 sq. feet
|
2 baths 4 beds |
show details |
| Photo | Address | Area | Beds / Baths | Price | Details |
|---|---|---|---|---|---|

|
#11
Kantor Blvd
Casselberry, FL 32707
|
1,511 sq. feet
|
2 baths 3 beds |
show details | |

|
#12
N Hastings St
Orlando, FL 32808
|
1,220 sq. feet
|
2 baths 3 beds |
show details | |

|
#13
Carriage Hill Dr
Casselberry, FL 32707
|
2,200 sq. feet
|
2 baths 4 beds |
show details | |

|
#14
Majestic Oak Dr
Apopka, FL 32712
|
3,066 sq. feet
|
4 baths 4 beds |
show details | |

|
#15
Empire Ave
Orlando, FL 32810
|
1,612 sq. feet
|
1 baths 2 beds |
show details | |

|
#16
Joyce St
Orlando, FL 32839
|
1,176 sq. feet
|
2 baths 3 beds |
show details | |

|
#17
Jayhil Dr
Clermont, FL 34715
|
2,008 sq. feet
|
2 baths 3 beds |
show details | |

|
#18
Roger Babson Rd
Orlando, FL 32808
|
1,501 sq. feet
|
1 baths 3 beds |
show details | |

|
#19
Brisbane Ct
Orlando, FL 32835
|
1,473 sq. feet
|
2 baths 3 beds |
show details | |

|
#20
Foxforrest Cir
Apopka, FL 32712
|
2,648 sq. feet
|
2 baths 3 beds |
show details |
| Photo | Address | Area | Beds / Baths | Price | Details |
|---|---|---|---|---|---|

|
#21
Crayford Ave
Orlando, FL 32837
|
1,964 sq. feet
|
2 baths 3 beds |
show details | |

|
#22
Langstaff Dr
Windermere, FL 34786
|
1,181 sq. feet
|
2 baths 2 beds |
show details | |

|
#23
Kendra Ct
Orlando, FL 32824
|
1,952 sq. feet
|
2 baths 4 beds |
show details | |

|
#24
Alfred Dr
Orlando, FL 32810
|
1,752 sq. feet
|
2 baths 3 beds |
show details | |

|
#25
Blanton Ct
Orlando, FL 32809
|
1,425 sq. feet
|
2 baths 3 beds |
show details | |

|
#26
Lost Grove Cir
Winter Garden, FL 34787
|
2,880 sq. feet
|
2 baths 4 beds |
show details | |

|
#27
Shady Willow Dr
Orlando, FL 32808
|
1,460 sq. feet
|
2 baths 3 beds |
show details | |

|
#28
Lyman St
Ocoee, FL 34761
|
1,197 sq. feet
|
1 baths 3 beds |
show details | |

|
#29
Cherry Grove Cir
Orlando, FL 32809
|
1,895 sq. feet
|
2 baths 3 beds |
show details | |

|
#30
Hunley Ave
Apopka, FL 32703
|
2,477 sq. feet
|
2 baths 4 beds |
show details |
| Photo | Address | Area | Beds / Baths | Price | Details |
|---|---|---|---|---|---|

|
#31
W Cottesmore Cir
Longwood, FL 32779
|
1,861 sq. feet
|
2 baths 4 beds |
show details | |

|
#32
Biscayne Dr
Orlando, FL 32804
|
2,758 sq. feet
|
3 baths 4 beds |
show details | |

|
#33
Simmons Rd
Orlando, FL 32812
|
3,936 sq. feet
|
3 baths 4 beds |
show details | |

|
#34
Nan Dr
Ocoee, FL 34761
|
1,753 sq. feet
|
2 baths 3 beds |
show details | |

|
#35
Oyster Bay Cir Apt 100
Altamonte Springs, FL 32701
|
992 sq. feet
|
2 baths 2 beds |
show details | |

|
#36
Kintla Rd
Apopka, FL 32712
|
2,599 sq. feet
|
2 baths 3 beds |
show details | |

|
#37
Blue Jacket Ln
Orlando, FL 32825
|
1,714 sq. feet
|
2 baths 3 beds |
show details | |

|
#38
Delcrest Dr
Orlando, FL 32817
|
2,053 sq. feet
|
2 baths 3 beds |
show details | |

|
#39
Dianjo Dr
Orlando, FL 32810
|
1,539 sq. feet
|
2 baths 4 beds |
show details | |

|
#40
N Hart Blvd
Orlando, FL 32835
|
1,296 sq. feet
|
2 baths 3 beds |
show details |
| Photo | Address | Area | Beds / Baths | Price | Details |
|---|---|---|---|---|---|

|
#41
Still Meadow Dr
Clermont, FL 34711
|
2,398 sq. feet
|
3 baths 4 beds |
show details | |

|
#42
Casper Ln
Clermont, FL 34711
|
2,742 sq. feet
|
4 baths 4 beds |
show details | |

|
#43
Pineview Way
Apopka, FL 32703
|
1,299 sq. feet
|
2 baths 3 beds |
show details | |

|
#44
Atlin Dr
Orlando, FL 32837
|
1,018 sq. feet
|
2 baths 2 beds |
show details | |

|
#45
Moonbeam Rd
Apopka, FL 32712
|
1,024 sq. feet
|
2 baths 3 beds |
show details | |

|
#46
Ayden Oak Ln
Ocoee, FL 34761
|
2,706 sq. feet
|
4 baths 4 beds |
show details | |

|
#47
Buttercup Ln
Orlando, FL 32825
|
1,220 sq. feet
|
1 baths 3 beds |
show details | |

|
#48
Oak Dr
Longwood, FL 32779
|
1,922 sq. feet
|
2 baths 3 beds |
show details | |

|
#49
Luzon Dr
Orlando, FL 32809
|
1,225 sq. feet
|
2 baths 3 beds |
show details | |

|
Check over 1 million property listings on Foreclosure.com!
|
browse all offers | |||

Latest news about housing in Orlovista, FL collected exclusively by city-data.com from local newspapers, TV, and radio stations

 | Safest place to move for single parent in Orlando 2012 (13 replies) |
| Second guessing our move-is FL family friendly? (74 replies) |
| Why aren't there any Asians in Florida?? (122 replies) |
| Question regarding areas.... (13 replies) |
| Compare living on the south side of Orlando vs the north side of Orlando (40 replies) |
| What about College Park? (8 replies) |
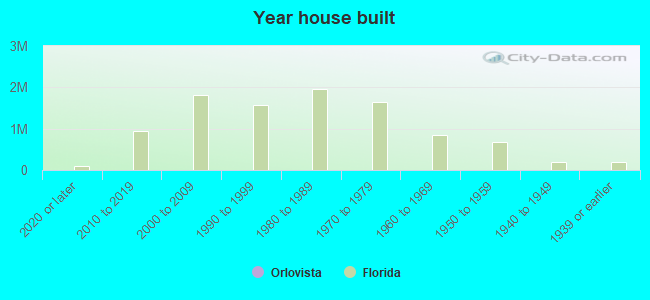
Median year apartment built: 1980
Household type by relationship:
Households: 6,779- Male householders: 916 (316 living alone), Female householders: 1,356 (374 living alone)
893 spouses (893 opposite-sex spouses), 117 unmarried partners, (97 opposite-sex unmarried partners), 2,079 children (2,079 natural, 0 adopted, 0 stepchildren), 537 grandchildren, 196 brothers or sisters, 153 parents, 0 foster children, 264 other relatives, 225 non-relatives
- In group quarters: 37
Size of family households: 368 2-persons, 515 3-persons, 384 4-persons, 290 5-persons, 25 7-or-more-persons.
Size of nonfamily households: 763 1-person, 120 2-persons, 15 4-persons.
536 married couples with children.
334 single-parent households (43 men, 291 women).
52.9% of residents of Orlovista speak English at home.
17.7% of residents speak Spanish at home (51% speak English very well, 35% speak English well, 11% speak English not well, 2% don't speak English at all).
20.4% of residents speak other Indo-European language at home (65% speak English very well, 14% speak English well, 19% speak English not well, 2% don't speak English at all).
6.8% of residents speak Asian or Pacific Island language at home (50% speak English very well, 26% speak English well, 24% speak English not well).
4.0% of residents speak other language at home (28% speak English very well, 41% speak English well, 32% speak English not well).
Foreign born population: 2,211 (32.6%)
(56.3% of them are naturalized citizens)
| Here: | 6.0 |
| State: | 5.9 |
| Here: | 4.5 |
| State: | 4.2 |
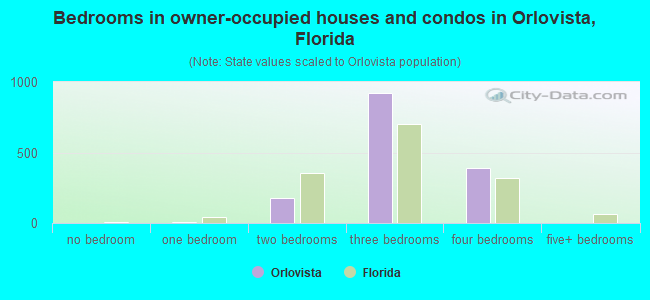
- Bedrooms in owner-occupied houses and condos in Orlovista, Florida
- 0no bedroom
- 91 bedroom
- 1742 bedrooms
- 9223 bedrooms
- 3874 bedrooms
- 05+ bedrooms
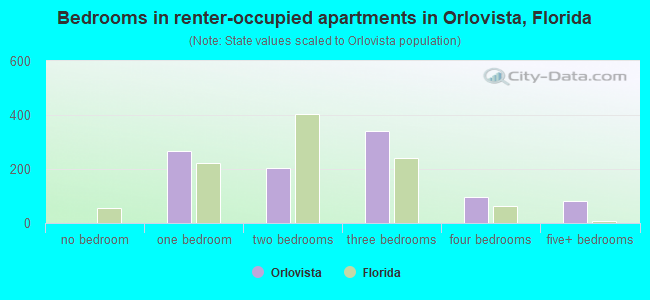
- Bedrooms in renter-occupied apartments in Orlovista, Florida
- 0no bedroom
- 2651 bedroom
- 2042 bedrooms
- 3413 bedrooms
- 984 bedrooms
- 815+ bedrooms
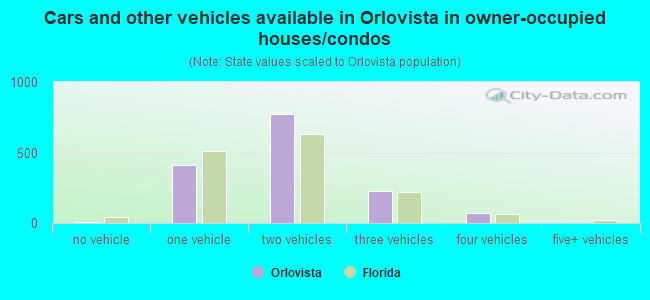
- Cars and other vehicles available in Orlovista in owner-occupied houses/condos
- 10no vehicle
- 4141 vehicle
- 7712 vehicles
- 2253 vehicles
- 714 vehicles
- 05+ vehicles
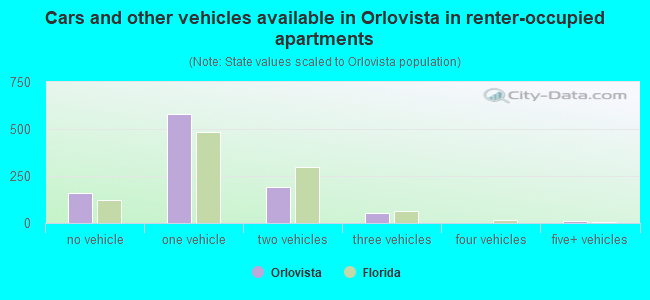
- Cars and other vehicles available in Orlovista in renter-occupied apartments
- 157no vehicle
- 5821 vehicle
- 1892 vehicles
- 513 vehicles
- 04 vehicles
- 115+ vehicles
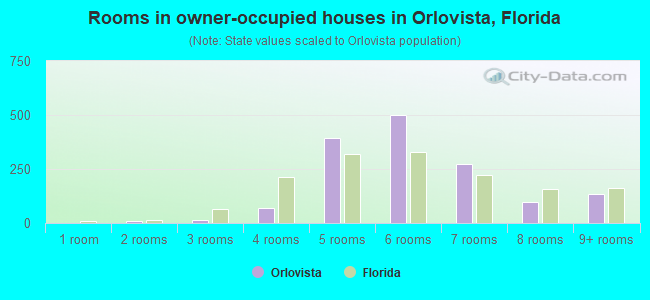
- Rooms in owner-occupied houses in Orlovista, Florida
- 01 room
- 92 rooms
- 163 rooms
- 694 rooms
- 3935 rooms
- 5016 rooms
- 2737 rooms
- 988 rooms
- 1339+ rooms
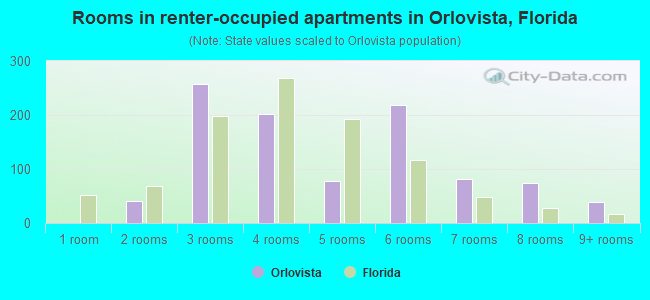
- Rooms in renter-occupied apartments in Orlovista, Florida
- 01 room
- 412 rooms
- 2573 rooms
- 2024 rooms
- 785 rooms
- 2186 rooms
- 817 rooms
- 748 rooms
- 399+ rooms
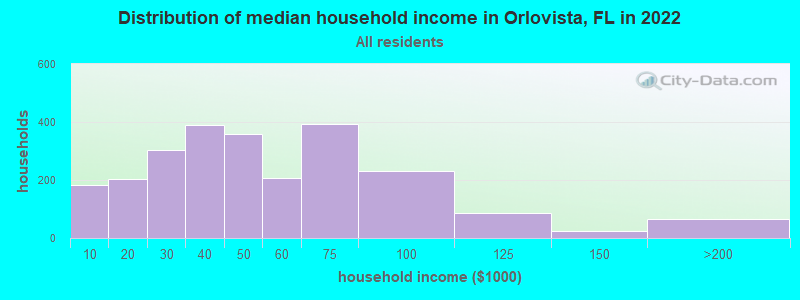
Orlovista, FL household income distribution

- 183Less than $10,000
- 203$10,000 to $19,999
- 302$20,000 to $29,999
- 388$30,000 to $39,999
- 360$40,000 to $49,999
- 208$50,000 to $59,999
- 393$60,000 to $74,999
- 230$75,000 to $99,999
- 87$100,000 to $124,999
- 24$125,000 to $149,999
- 67$150,000 to $199,999
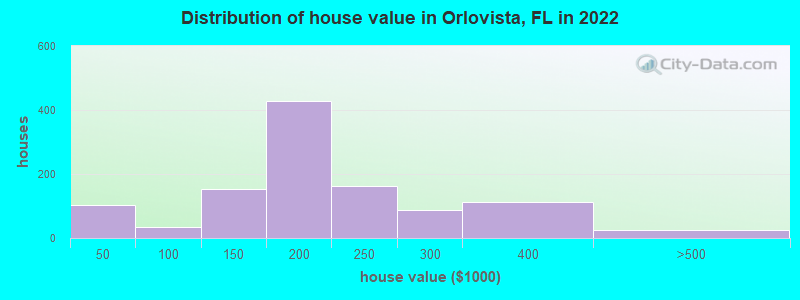
Home value of owner - occupied houses in 2022 in Orlovista, FL
-
- 51Less than $10,000
- 11$10,000 to $14,999
- 27$25,000 to $29,999
- 10$30,000 to $34,999
- 5$50,000 to $59,999
- 18$60,000 to $69,999
- 9$80,000 to $89,999
- 103$100,000 to $124,999
- 49$125,000 to $149,999
- 180$150,000 to $174,999
- 245$175,000 to $199,999
- 163$200,000 to $249,999
- 85$250,000 to $299,999
- 113$300,000 to $399,999
- 18$400,000 to $499,999
- 4$1,000,000 to $1,499,999
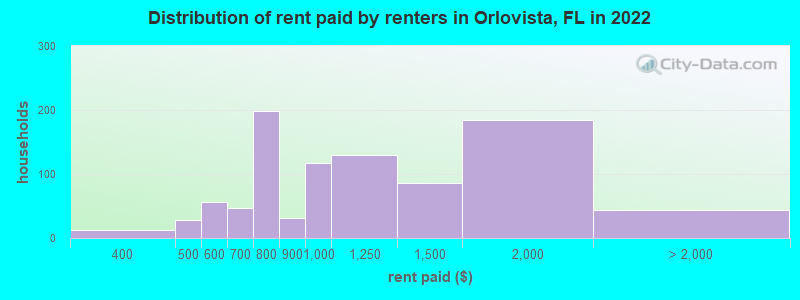
Rent paid by renters in 2022 in Orlovista, FL
-
- 13$350 to $399
- 28$450 to $499
- 57$500 to $549
- 46$650 to $699
- 169$700 to $749
- 29$750 to $799
- 30$800 to $899
- 116$900 to $999
- 130$1,000 to $1,249
- 86$1,250 to $1,499
- 184$1,500 to $1,999
- 21$2,000 to $2,499
- 21No cash rent
Percentage of workers working in this county: 87.2%
Number of people working at home: 74 (2.8% of all workers)
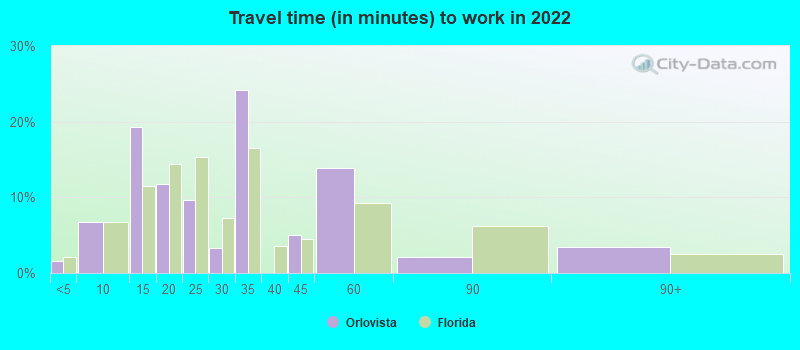
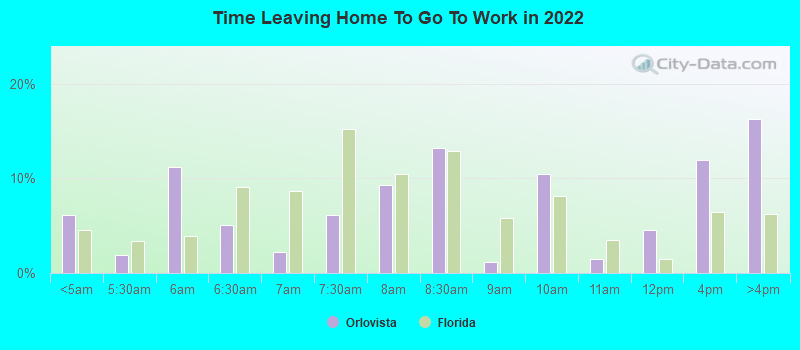
Travel time to work (commute)
- Less than 5 minutes: 0
- 5 to 9 minutes: 189
- 10 to 14 minutes: 161
- 15 to 19 minutes: 584
- 20 to 24 minutes: 324
- 25 to 29 minutes: 316
- 30 to 34 minutes: 370
- 35 to 39 minutes: 22
- 40 to 44 minutes: 82
- 45 to 59 minutes: 59
- 60 to 89 minutes: 203
- 90 or more minutes: 81
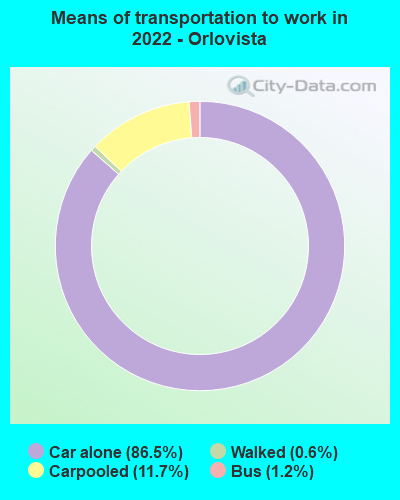
Means of transportation to work:
- Drove a car alone: 1,626 (78.8%)
- Carpooled: 232 (11.2%)
- Bus: 24 (1.2%)
- Walked: 14 (0.7%)
- Worked at home: 74 (3.6%)
- Unemployment by race in 2022
- Unemployment rate for White non-Hispanic residents
- 30.4%Males
- 4.3%Females
- Unemployment rate for Black residents
- 5.2%Males
- 4.0%Females
- Unemployment rate for two or more race residents
- 34.0%Females
- Unemployment rate for Hispanic or Latino residents
- 2.7%Males
- 18.3%Females
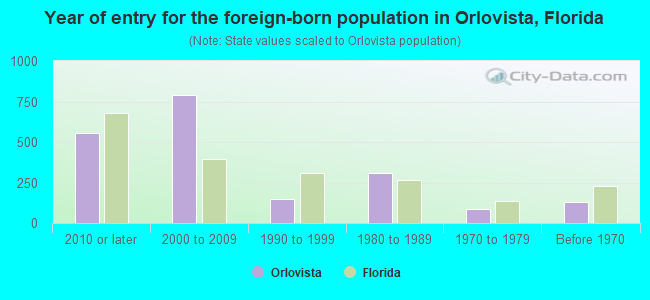
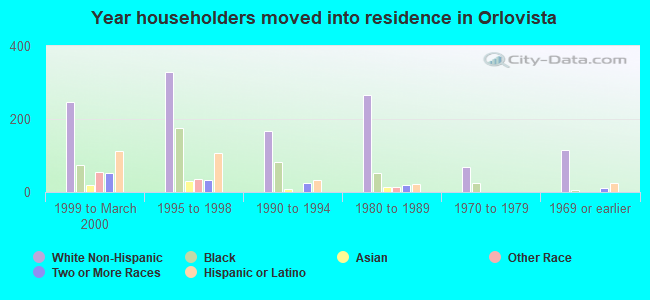
- Year of entry for the foreign-born population in Orlovista, Florida
- 5582010 or later
- 7892000 to 2009
- 1501990 to 1999
- 3081980 to 1989
- 841970 to 1979
- 127Before 1970
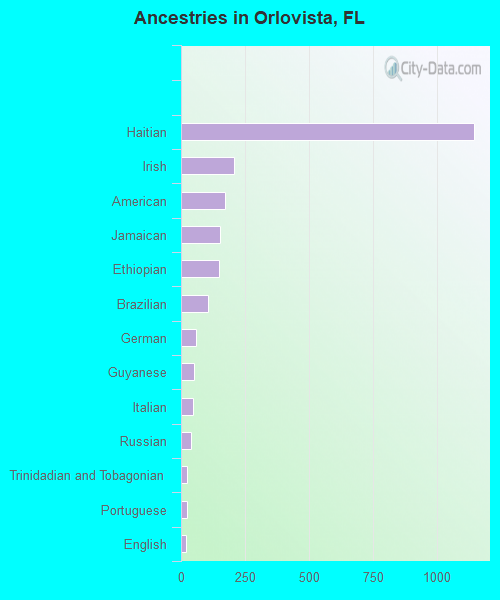
First ancestries reported:
- Haitian: 1,147 (24.2%)
- Irish: 207 (4.4%)
- American: 172 (3.6%)
- Jamaican: 152 (3.2%)
- Ethiopian: 149 (3.1%)
- Brazilian: 107 (2.3%)
- German: 60 (1.3%)
- Guyanese: 50 (1.1%)
- Italian: 47 (1.0%)
- Russian: 38 (0.8%)
- Trinidadian and Tobagonian: 25 (0.5%)
- Portuguese: 22 (0.5%)
- English: 18 (0.4%)
- Danish: 8 (0.2%)
- Scotch-Irish: 8 (0.2%)
- European: 5 (0.1%)
Most common places of birth for foreign-born residents (%):
| Orlovista: | 32.5% (708) |
| Florida: | 7.5% (342,375) |
| Orlovista: | 12.5% (273) |
| Florida: | 2.7% (122,906) |
| Orlovista: | 12.2% (266) |
| Florida: | 0.7% (33,556) |
| Orlovista: | 8.8% (192) |
| Florida: | 1.2% (56,071) |
| Orlovista: | 7.7% (168) |
| Florida: | 5.0% (227,319) |
| Orlovista: | 6.3% (138) |
| Florida: | 5.7% (262,042) |
| Orlovista: | 2.8% (62) |
| Florida: | 0.0% (1,317) |
| Orlovista: | 2.7% (59) |
| Florida: | 1.3% (60,604) |
| Orlovista: | 2.7% (59) |
| Florida: | 0.1% (4,197) |
| Orlovista: | 2.5% (55) |
| Florida: | 1.2% (54,272) |
| Orlovista: | 2.2% (47) |
| Florida: | 0.1% (3,268) |
| Orlovista: | 2.0% (43) |
| Florida: | 0.2% (9,164) |
| Orlovista: | 1.6% (35) |
| Florida: | 0.0% (735) |
| Orlovista: | 1.6% (34) |
| Florida: | 0.7% (31,076) |
Place of birth for U.S.-born residents:
- This state: 2,171
- Other state: 1,357
- Northeast: 773
- Midwest: 180
- South: 318
- West: 95
89.7% of Orlovista residents lived in the same house 1 years ago.
Out of people who lived in different houses, 37.7% lived in this county.
Out of people who lived in different counties, 13.7% lived in Florida.
| Orlovista: | 89.7% |
| State average: | 86.3% |
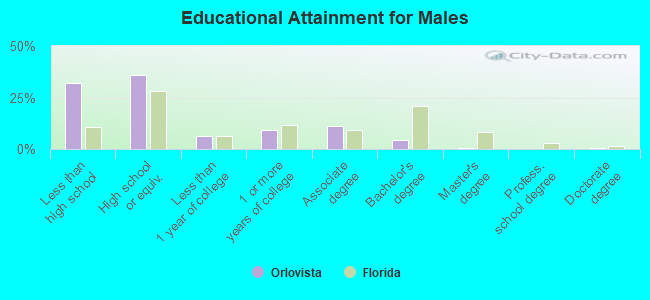
Education attainment for males 25 years and older:
- No schooling: 65
- Nursery to 4th grade: 32
- 5th and 6th grade: 16
- 7th and 8th grade: 142
- 9th grade: 6
- 10th grade: 0
- 11th grade: 0
- 12th grade, no diploma: 328
- High school graduate (or equivalency): 658
- Less than 1 year of college: 115
- Some college more than 1 year, no degree: 172
- Associate degree: 210
- Bachelor's degree: 79
- Master's degree: 10
- Professional school degree: 0
- Doctorate degree: 9
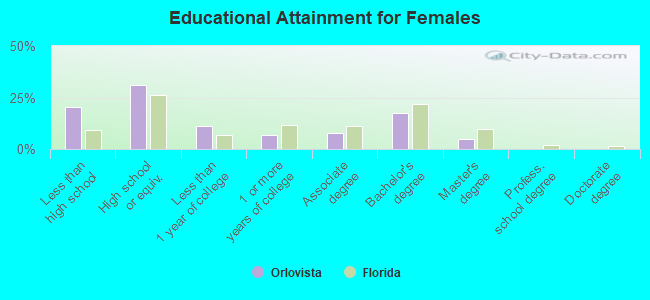
Education attainment for females 25 years and older:
- No schooling: 38
- Nursery to 4th grade: 71
- 5th and 6th grade: 0
- 7th and 8th grade: 96
- 9th grade: 5
- 10th grade: 63
- 11th grade: 165
- 12th grade, no diploma: 31
- High school graduate (or equivalency): 715
- Less than 1 year of college: 256
- Some college more than 1 year, no degree: 153
- Associate degree: 181
- Bachelor's degree: 405
- Master's degree: 115
- Professional school degree: 0
- Doctorate degree: 0
Housing units in structures:
- One, detached: 2,163
- One, attached: 11
- Two: 35
- 3 or 4: 37
- 5 to 9: 69
- 10 to 19: 105
- 20 to 49: 8
- 50 or more: 13
- Mobile homes: 105
Housing units lacking complete kitchen facilities in 2022: 1.3%
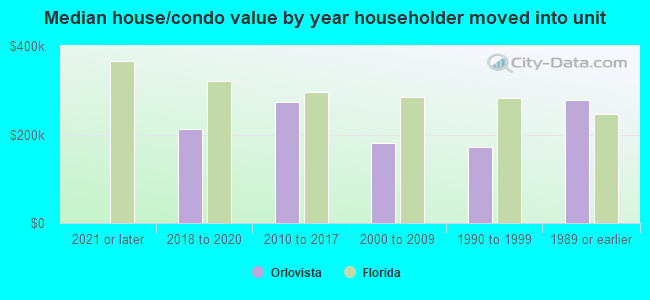
House/condo owner moved in on average 12 years ago
Renter moved in on average 5 years ago
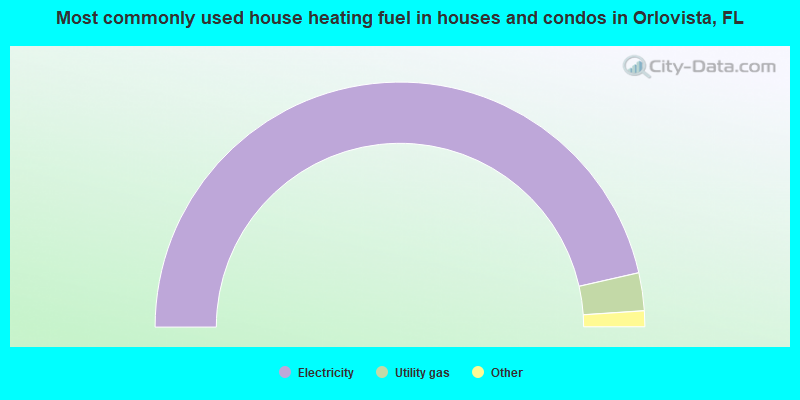
- 93.0%Electricity
- 5.0%Utility gas
- 1.5%No fuel used
- 0.5%Solar energy
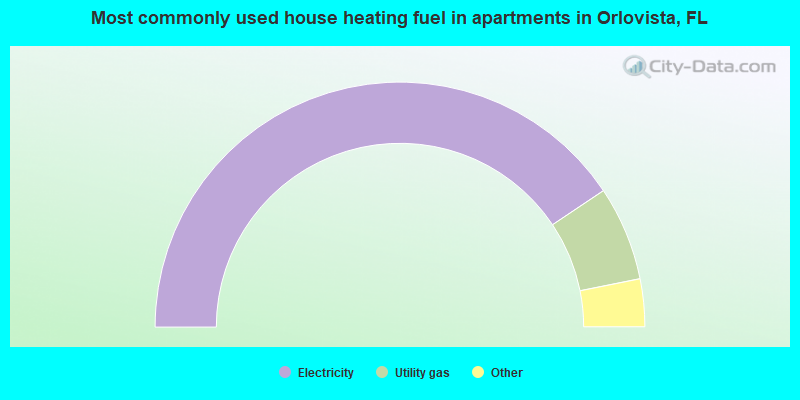
- 81.3%Electricity
- 12.5%Utility gas
- 3.9%Other fuel
- 2.4%No fuel used
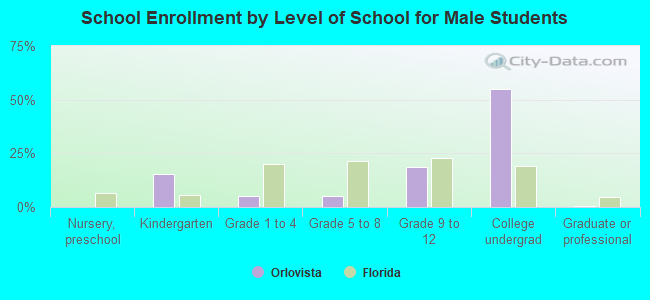
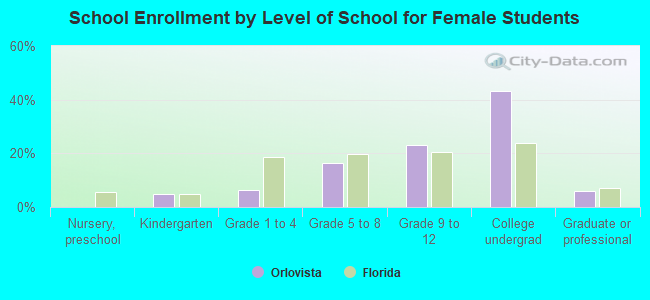
Private vs. public school enrollment:
| Here: | 3.3% |
| Florida: | 15.8% |
| Here: | 4.9% |
| Florida: | 12.9% |
| Here: | 3.7% |
| Florida: | 23.6% |