Oswego, SC (South Carolina) Houses and Residents
| Oswego: | |
| South Carolina: |
Mean price in 2022:
Detached houses: $292,977
Here: $292,977 State: $368,255
Total population: 84 (Urban population: 0, Rural population: 85 (all nonfarm))
Houses: 91 (91 occupied: 88 owner occupied, 0 renter occupied)
| % of renters here: | 0% |
| State: | 28% |
Housing density: 55 houses/condos per square mile
Median price asked for vacant for-sale houses and condos in 2022 in this county: $138,322.
Median gross rent in Oswego, SC in 2022: $-755,108,876
Housing units in Oswego with a mortgage: 49 (6 second mortgage, 0 home equity loan, 10 both second mortgage and home equity loan)
Houses without a mortgage: 0
Median monthly housing costs: $761
Compare current foreclosures near Oswego, SC:
| Photo | Address | Area | Beds / Baths | Price | Details |
|---|---|---|---|---|---|

|
#1
Artesian Dr
Sumter, SC 29150
|
1,441 sq. feet
|
2 baths 3 beds |
$225,000
|
show details |

|
#2
Copley Dr
Sumter, SC 29154
|
1,755 sq. feet
|
2 baths 3 beds |
$170,000
|
show details |

|
#3
Mooneyhan Rd
Sumter, SC 29150
|
2,126 sq. feet
|
2 baths 5 beds |
$187,500
|
show details |

|
#4
Mclaurin Rd
Wedgefield, SC 29168
|
- sq. feet
|
1 baths 3 beds |
$27,500
|
show details |

|
#5
Equinox Ave
Dalzell, SC 29040
|
1,400 sq. feet
|
2 baths 3 beds |
show details | |

|
#6
Vernon Dr
Sumter, SC 29150
|
1,515 sq. feet
|
3 baths 3 beds |
show details | |

|
#7
Shuler Dr
Sumter, SC 29150
|
- sq. feet
|
1 baths 2 beds |
show details | |

|
#8
Calvary Church Rd
Bishopville, SC 29010
|
- sq. feet
|
1 baths 3 beds |
show details | |

|
#9
Genoa Dr
Sumter, SC 29153
|
- sq. feet
|
2 baths 3 beds |
show details | |

|
#10
Kenilworth Ave
Sumter, SC 29150
|
1,444 sq. feet
|
- baths 2 beds |
show details |
| Photo | Address | Area | Beds / Baths | Price | Details |
|---|---|---|---|---|---|

|
#11
Lamar Hwy
Timmonsville, SC 29161
|
1,025 sq. feet
|
1 baths 3 beds |
show details | |

|
#12
Dinkins Mill Rd
Rembert, SC 29128
|
- sq. feet
|
2 baths 5 beds |
show details | |

|
#13
Watermark Dr
Dalzell, SC 29040
|
- sq. feet
|
2 baths 3 beds |
show details | |

|
#14
Cane Savannah Rd
Wedgefield, SC 29168
|
- sq. feet
|
2 baths 4 beds |
show details | |

|
#15
Habitat Dr
Sumter, SC 29153
|
- sq. feet
|
2 baths 3 beds |
show details | |

|
#16
Ridge St
Dalzell, SC 29040
|
- sq. feet
|
2 baths 3 beds |
show details | |

|
#17
S Magnolia St
Sumter, SC 29150
|
- sq. feet
|
2 baths 3 beds |
show details | |

|
#18
Cutleaf Dr
Sumter, SC 29150
|
- sq. feet
|
2 baths 3 beds |
show details | |

|
#19
Edmunds Dr
Sumter, SC 29154
|
- sq. feet
|
2 baths 3 beds |
show details | |

|
#20
Old Spring Ct
Sumter, SC 29154
|
- sq. feet
|
2 baths 3 beds |
show details |
| Photo | Address | Area | Beds / Baths | Price | Details |
|---|---|---|---|---|---|

|
#21
Habitat Dr
Sumter, SC 29153
|
- sq. feet
|
2 baths 3 beds |
show details | |

|
#22
Annie Ct
Dalzell, SC 29040
|
- sq. feet
|
2 baths 3 beds |
show details | |

|
#23
Mossberg Dr
Sumter, SC 29150
|
- sq. feet
|
2 baths 4 beds |
show details | |

|
#24
Tamarah Way
Sumter, SC 29154
|
- sq. feet
|
2 baths 3 beds |
show details | |

|
#25
Monterey Dr
Sumter, SC 29154
|
- sq. feet
|
2 baths 3 beds |
show details | |

|
#26
Morris Way Dr
Sumter, SC 29154
|
- sq. feet
|
2 baths 3 beds |
show details | |

|
#27
Polaris Dr
Sumter, SC 29150
|
- sq. feet
|
2 baths 3 beds |
show details | |

|
#28
Tuckaway Dr
Sumter, SC 29154
|
- sq. feet
|
2 baths 3 beds |
show details | |

|
#29
Oleander Dr
Sumter, SC 29154
|
- sq. feet
|
2 baths 3 beds |
show details | |

|
#30
Crosswell Dr
Sumter, SC 29150
|
- sq. feet
|
2 baths 3 beds |
show details |
| Photo | Address | Area | Beds / Baths | Price | Details |
|---|---|---|---|---|---|

|
#31
Bors St
Sumter, SC 29154
|
- sq. feet
|
2 baths 3 beds |
show details | |

|
#32
Continental Dr
Sumter, SC 29154
|
- sq. feet
|
2 baths 3 beds |
show details | |

|
#33
Senate Ln
Sumter, SC 29154
|
- sq. feet
|
2 baths 3 beds |
show details | |

|
#34
Collingwood Ct
Sumter, SC 29154
|
- sq. feet
|
2 baths 3 beds |
show details | |

|
#35
Trillium Ln
Sumter, SC 29154
|
- sq. feet
|
2 baths 3 beds |
show details | |

|
#36
Browning Ridge Dr
Sumter, SC 29154
|
- sq. feet
|
2 baths 3 beds |
show details | |

|
#37
Bigum St
Dalzell, SC 29040
|
- sq. feet
|
2 baths 3 beds |
show details | |

|
#38
Landmark Dr
Sumter, SC 29154
|
- sq. feet
|
2 baths 2 beds |
show details | |

|
#39
Lewis Rd
Sumter, SC 29154
|
- sq. feet
|
- baths - beds |
show details | |

|
#40
Foxcroft Cir
Sumter, SC 29154
|
- sq. feet
|
- baths - beds |
show details |
| Photo | Address | Area | Beds / Baths | Price | Details |
|---|---|---|---|---|---|

|
#41
Tanglewood Rd
Sumter, SC 29154
|
- sq. feet
|
- baths 4 beds |
show details | |

|
#42
Lowery Ln
Lynchburg, SC 29080
|
- sq. feet
|
- baths - beds |
show details | |

|
#43
N Main St
Sumter, SC 29153
|
- sq. feet
|
- baths 4 beds |
show details | |

|
#44
Ginhouse Dr
Sumter, SC 29154
|
- sq. feet
|
- baths - beds |
show details | |

|
#45
Furman Dr
Sumter, SC 29154
|
- sq. feet
|
- baths 3 beds |
show details | |

|
#46
Foxcroft Cir
Sumter, SC 29154
|
- sq. feet
|
- baths - beds |
show details | |

|
#47
Twin Lakes Dr
Sumter, SC 29154
|
- sq. feet
|
- baths - beds |
show details | |

|
#48
Kolb Rd
Sumter, SC 29154
|
- sq. feet
|
- baths 3 beds |
show details | |

|
#49
Reona Ave
Sumter, SC 29154
|
- sq. feet
|
- baths - beds |
show details | |

|
Check over 1 million property listings on Foreclosure.com!
|
browse all offers | |||

Latest news about housing in Oswego, SC collected exclusively by city-data.com from local newspapers, TV, and radio stations

 | What's New or Coming To Sumter (2720 replies) |
| Question about specific streets downtown - looking to buy home (4 replies) |
| SC native ... will answer questions (254 replies) |
| Crosswell section (21 replies) |
| The Sumter County John & Jane Doe from 1976 (31 replies) |
| Any up-state New Yorkers coming soon? (21 replies) |

Household type by relationship:
Households: 348- Male householders: 11 (0 living alone), Female householders: 77 (0 living alone)
98 spouses (98 opposite-sex spouses), 0 unmarried partners, (0 opposite-sex unmarried partners), 23 children (23 natural, 0 adopted, 0 stepchildren), 0 grandchildren, 0 brothers or sisters, 0 parents, 0 foster children, 136 other relatives, 0 non-relatives
Size of family households: 36 2-persons, 12 4-persons, 31 5-persons.
25 married couples with children.
0 single-parent households (0 men, 0 women).
98.9% of residents of Oswego speak English at home.
| Here: | 6.9 |
| State: | 6.4 |
| Here: | -707482992.5 |
| State: | 4.5 |
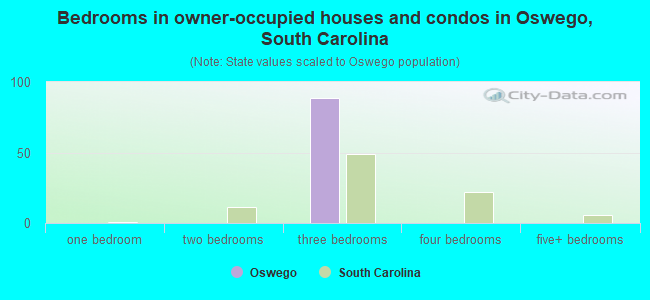
- Bedrooms in owner-occupied houses and condos in Oswego, South Carolina
- 0no bedroom
- 01 bedroom
- 02 bedrooms
- 893 bedrooms
- 04 bedrooms
- 05+ bedrooms
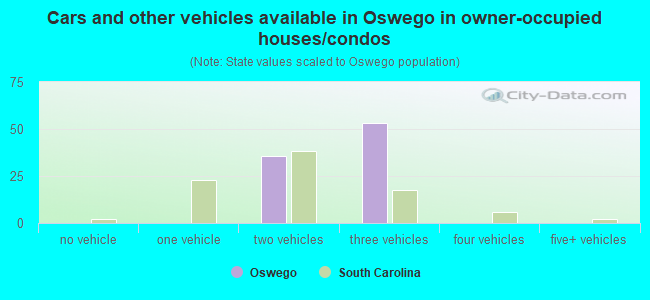
- Cars and other vehicles available in Oswego in owner-occupied houses/condos
- 0no vehicle
- 01 vehicle
- 362 vehicles
- 533 vehicles
- 04 vehicles
- 05+ vehicles
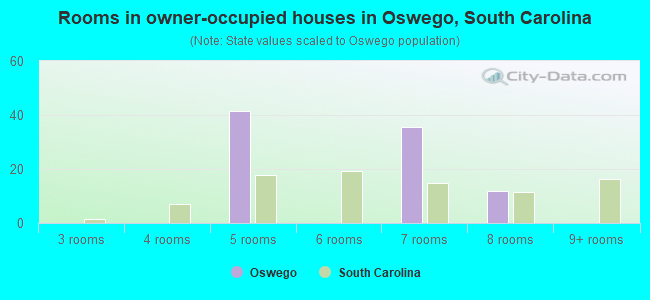
- Rooms in owner-occupied houses in Oswego, South Carolina
- 01 room
- 02 rooms
- 03 rooms
- 04 rooms
- 415 rooms
- 06 rooms
- 367 rooms
- 128 rooms
- 09+ rooms
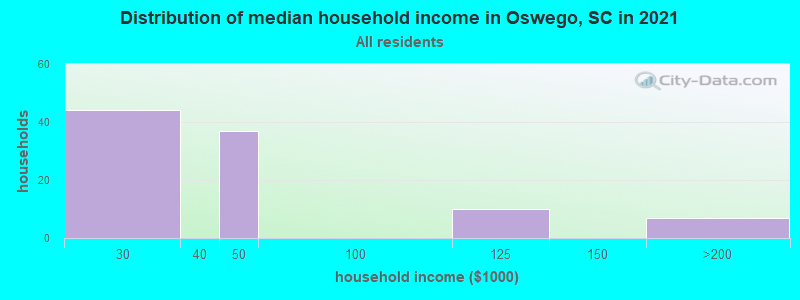
Oswego, SC household income distribution

- 42$20,000 to $29,999
- 46$50,000 to $59,999
- 8$150,000 to $199,999
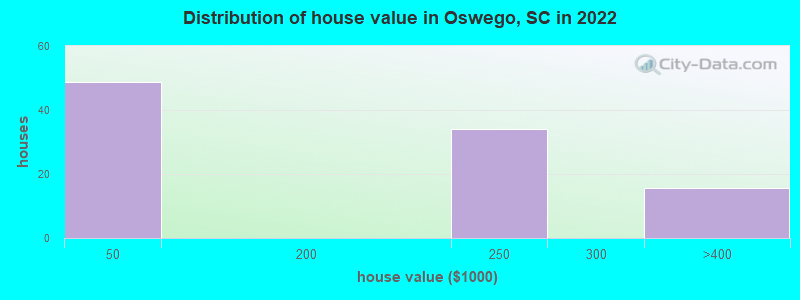
Home value of owner - occupied houses in 2022 in Oswego, SC
-
- 48$10,000 to $14,999
- 33$200,000 to $249,999
- 15$300,000 to $399,999
Percentage of workers working in this county: 103.2%
Number of people working at home: 0 (0.0% of all workers)
Travel time to work (commute)
- Less than 5 minutes: 0
- 5 to 9 minutes: 0
- 10 to 14 minutes: 0
- 15 to 19 minutes: 11
- 20 to 24 minutes: 47
- 25 to 29 minutes: 0
- 30 to 34 minutes: 0
- 35 to 39 minutes: 0
- 40 to 44 minutes: 0
- 45 to 59 minutes: 0
- 60 to 89 minutes: 0
- 90 or more minutes: 0
Means of transportation to work:
- Drove a car alone: 53 (89.8%)
- Carpooled: 6 (10.2%)
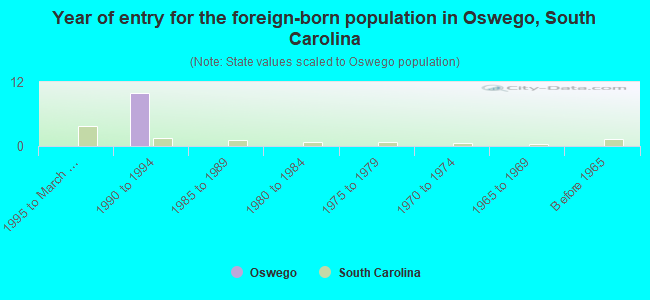
- Year of entry for the foreign-born population in Oswego, South Carolina
- 01995 to March 2000
- 101990 to 1994
- 01985 to 1989
- 01980 to 1984
- 01975 to 1979
- 01970 to 1974
- 01965 to 1969
- 0Before 1965
Most common places of birth for foreign-born residents (%):
| Oswego: | 100.0% (10) |
| South Carolina: | 0.8% (906) |
Place of birth for U.S.-born residents:
- This state: 313
- Other state: 0
- Northeast: 0
- Midwest: 0
- South: 0
- West: 0
96.3% of Oswego residents lived in the same house 1 years ago.
| Oswego: | 96.3% |
| State average: | 86.5% |
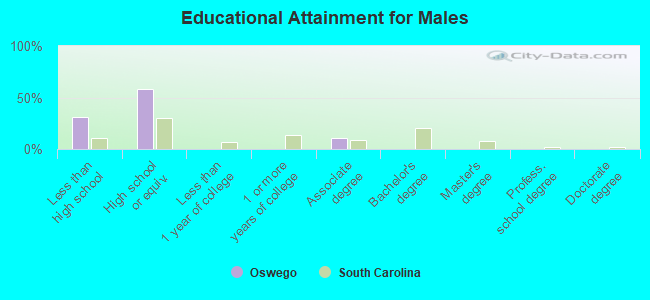
Education attainment for males 25 years and older:
- No schooling: 0
- Nursery to 4th grade: 0
- 5th and 6th grade: 0
- 7th and 8th grade: 0
- 9th grade: 0
- 10th grade: 0
- 11th grade: 26
- 12th grade, no diploma: 0
- High school graduate (or equivalency): 49
- Less than 1 year of college: 0
- Some college more than 1 year, no degree: 0
- Associate degree: 9
- Bachelor's degree: 0
- Master's degree: 0
- Professional school degree: 0
- Doctorate degree: 0
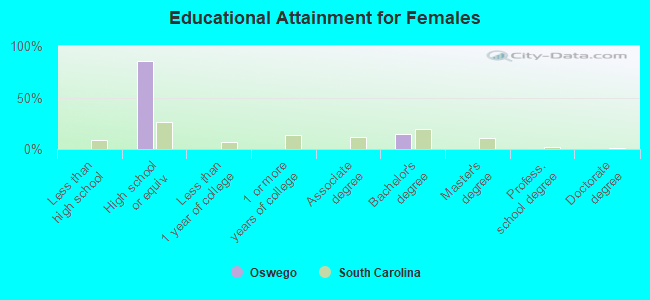
Education attainment for females 25 years and older:
- No schooling: 0
- Nursery to 4th grade: 0
- 5th and 6th grade: 0
- 7th and 8th grade: 0
- 9th grade: 0
- 10th grade: 0
- 11th grade: 0
- 12th grade, no diploma: 0
- High school graduate (or equivalency): 74
- Less than 1 year of college: 0
- Some college more than 1 year, no degree: 0
- Associate degree: 0
- Bachelor's degree: 13
- Master's degree: 0
- Professional school degree: 0
- Doctorate degree: 0


Housing units in structures:
- One, detached: 48
- Mobile homes: 42

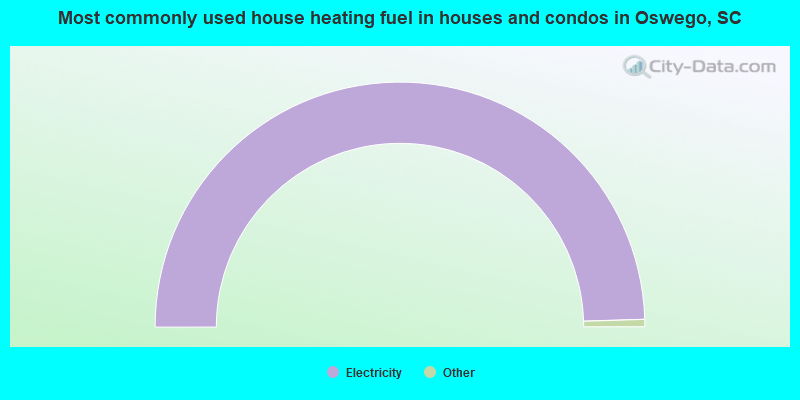
- 100.0%Electricity
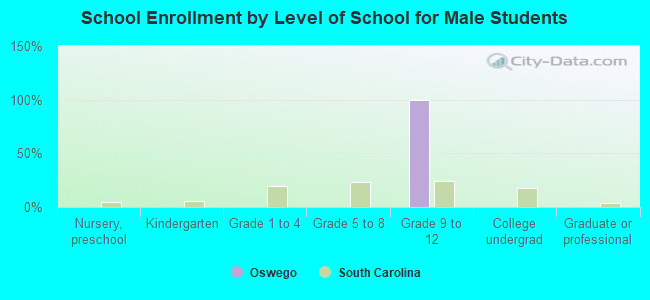
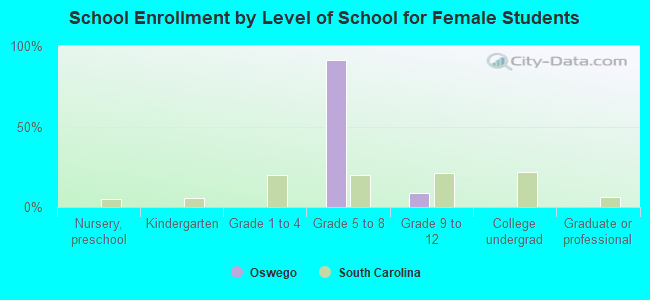
Private vs. public school enrollment:
| Here: | 6.8% |
| South Carolina: | 14.4% |
| Here: | 22.2% |
| South Carolina: | 11.1% |