Housing density: 1,163 houses/condos per square mile
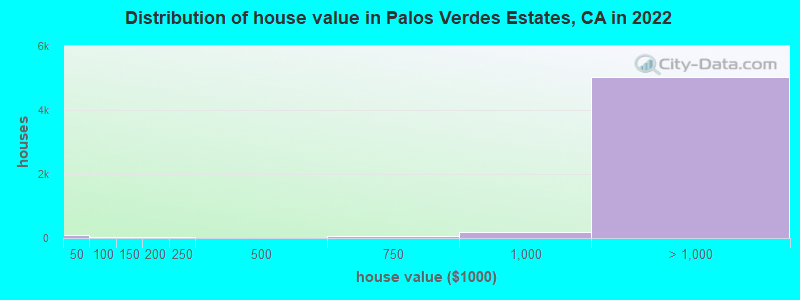
Median price asked for vacant for-sale houses and condos in 2022: $4,875,965.
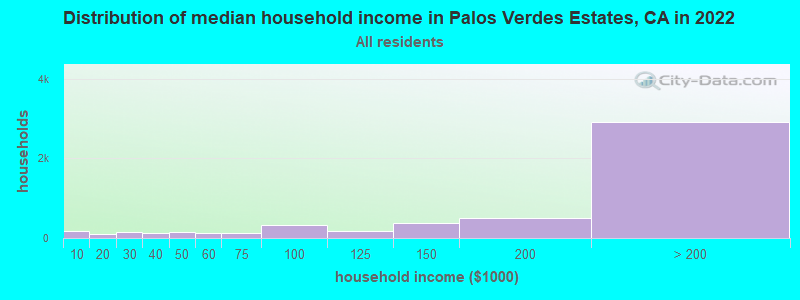
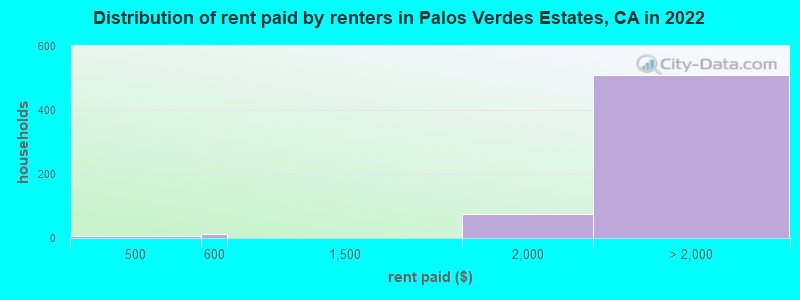
Median contract rent in 2022: over $2,000 (lower quartile is over $2,000, upper quartile is over $2,000)
Median rent asked for vacant for-rent units in 2022: $2,273
Median gross rent in Palos Verdes Estates, CA in 2022: over $2,000
Housing units in Palos Verdes Estates with a mortgage: 2,810 (312 second mortgage, 3 home equity loan, 249 both second mortgage and home equity loan) Houses without a mortgage: 8
Median household income for houses/condos with a mortgage: $248,703
Median household income for apartments without a mortgage: $143,239
Median monthly housing costs: $3,935
Compare current foreclosures near Palos Verdes Estates, CA:
Size of family households: 1,971 2-persons, 911 3-persons, 713 4-persons, 260 5-persons, 36 6-persons, 66 7-or-more-persons.
Size of nonfamily households: 1,117 1-person, 140 2-persons.
2,570 married couples with children.
201 single-parent households (14 men, 187 women).
71.8% of residents of Palos Verdes Estates speak English at home.
2.0% of residents speak Spanish at home (74% speak English very well, 21% speak English well, 4% speak English not well).
5.9% of residents speak other Indo-European language at home (98% speak English very well, 2% speak English not well).
18.4% of residents speak Asian or Pacific Island language at home (54% speak English very well, 37% speak English well, 7% speak English not well, 2% don't speak English at all).
3.4% of residents speak other language at home (86% speak English very well, 14% speak English well).
Foreign born population: 2,837 (21.9%)
(71.0% of them are naturalized citizens)
Percentage of workers working in this county: 95.4% Number of people working at home: 1,419 (27.6% of all workers)
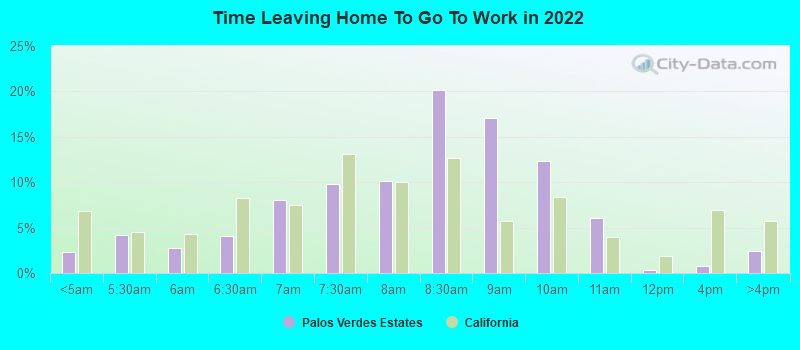
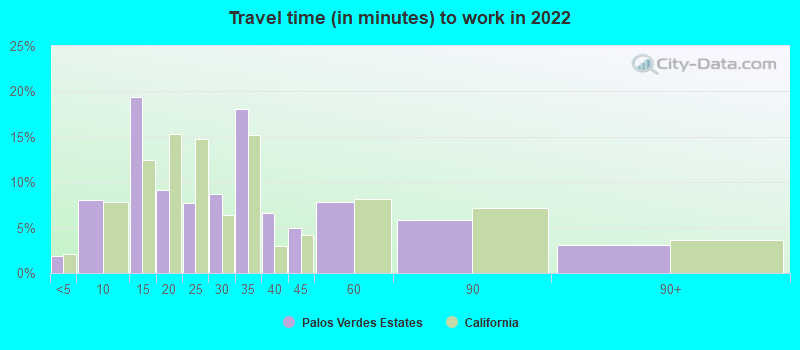
Travel time to work (commute)
Less than 5 minutes: 55
5 to 9 minutes: 216
10 to 14 minutes: 502
15 to 19 minutes: 300
20 to 24 minutes: 280
25 to 29 minutes: 271
30 to 34 minutes: 663
35 to 39 minutes: 248
40 to 44 minutes: 291
45 to 59 minutes: 496
60 to 89 minutes: 462
90 or more minutes: 71
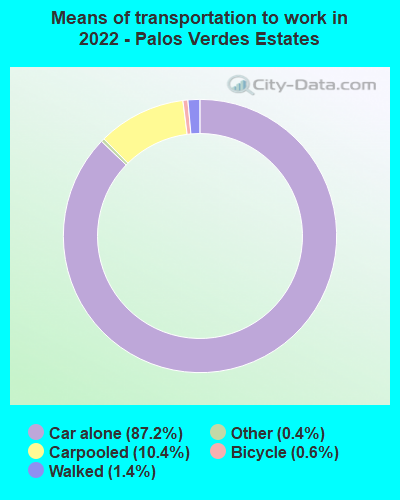
Means of transportation to work:
Drove a car alone: 1,822 (55.2%)
Carpooled: 240 (7.3%)
Taxi: 8 (0.2%)
Bicycle: 13 (0.4%)
Walked: 31 (0.9%)
Worked at home: 1,419 (43.0%)
Unemployment by race in 2022
Unemployment rate for White non-Hispanic residents
0.6%Males
2.5%Females
Unemployment rate for Asian residents
2.6%Males
5.1%Females
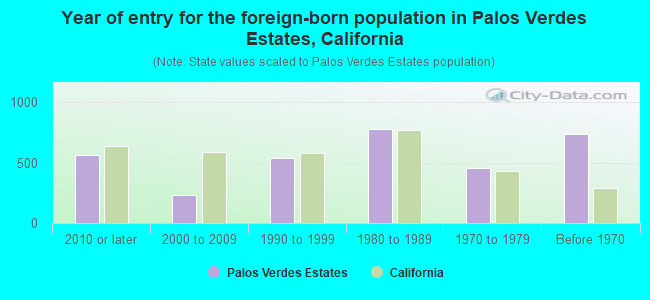
Year of entry for the foreign-born population in Palos Verdes Estates, California
5672010 or later
2322000 to 2009
5361990 to 1999
7801980 to 1989
4531970 to 1979
739Before 1970
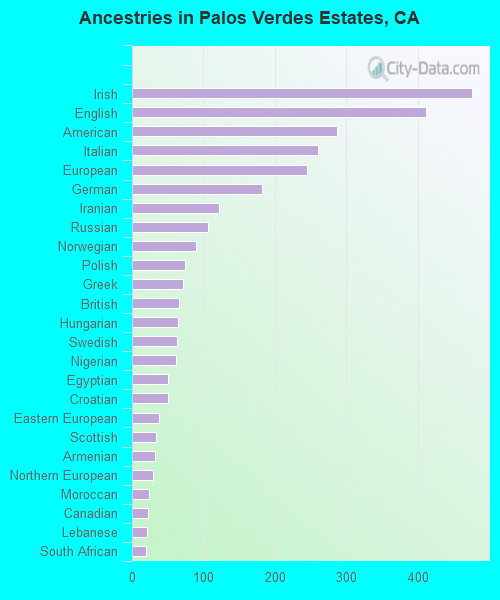
First ancestries reported:
Irish: 476 (7.2%)
English: 412 (6.2%)
American: 287 (4.4%)
Italian: 261 (4.0%)
European: 245 (3.7%)
German: 182 (2.8%)
Iranian: 122 (1.9%)
Russian: 107 (1.6%)
Norwegian: 89 (1.3%)
Polish: 74 (1.1%)
Greek: 71 (1.1%)
British: 66 (1.0%)
Hungarian: 65 (1.0%)
Swedish: 63 (1.0%)
Nigerian: 62 (0.9%)
Egyptian: 50 (0.8%)
Croatian: 50 (0.8%)
Eastern European: 38 (0.6%)
Scottish: 33 (0.5%)
Armenian: 32 (0.5%)
Northern European: 30 (0.5%)
Moroccan: 24 (0.4%)
Canadian: 23 (0.3%)
Lebanese: 21 (0.3%)
South African: 19 (0.3%)
Lithuanian: 18 (0.3%)
Macedonian: 17 (0.3%)
Scandinavian: 17 (0.3%)
French: 14 (0.2%)
Syrian: 14 (0.2%)
Danish: 11 (0.2%)
French Canadian: 10 (0.2%)
Ukrainian: 10 (0.2%)
Welsh: 9 (0.1%)
Finnish: 9 (0.1%)
Dutch: 8 (0.1%)
New Zealander: 8 (0.1%)
Swiss: 7 (0.1%)
Albanian: 7 (0.1%)
Most common places of birth for foreign-born residents (%):
China, excluding Hong Kong and Taiwan
Palos Verdes Estates:
21.5% (609)
California:
6.6% (684,672)
Japan
Palos Verdes Estates:
14.9% (422)
California:
1.0% (103,575)
Taiwan
Palos Verdes Estates:
13.9% (395)
California:
1.7% (176,274)
Korea
Palos Verdes Estates:
7.1% (201)
California:
3.0% (315,248)
India
Palos Verdes Estates:
4.3% (122)
California:
5.2% (539,184)
Iran
Palos Verdes Estates:
3.6% (102)
California:
2.0% (206,004)
Vietnam
Palos Verdes Estates:
2.5% (70)
California:
4.9% (512,335)
Hong Kong
Palos Verdes Estates:
2.2% (61)
California:
1.0% (105,215)
Nigeria
Palos Verdes Estates:
2.0% (58)
California:
0.3% (35,557)
England
Palos Verdes Estates:
1.9% (53)
California:
0.6% (57,953)
Place of birth for U.S.-born residents:
This state: 6,384
Other state: 3,572
Northeast: 989
Midwest: 1,244
South: 727
West: 590
91.7% of Palos Verdes Estates residents lived in the same house 1 years ago. Out of people who lived in different houses, 44.3% lived in this county. Out of people who lived in different counties, 17.1% lived in California.
Palos Verdes Estates:
91.7%
State average:
88.9%
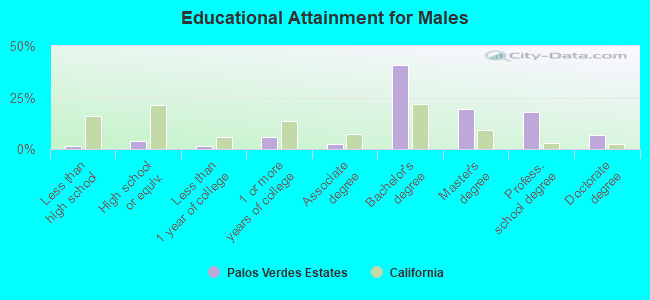
Education attainment for males 25 years and older:
No schooling: 63
Nursery to 4th grade: 0
5th and 6th grade: 0
7th and 8th grade: 0
9th grade: 8
10th grade: 0
11th grade: 0
12th grade, no diploma: 8
High school graduate (or equivalency): 178
Less than 1 year of college: 71
Some college more than 1 year, no degree: 278
Associate degree: 117
Bachelor's degree: 1,950
Master's degree: 937
Professional school degree: 848
Doctorate degree: 316
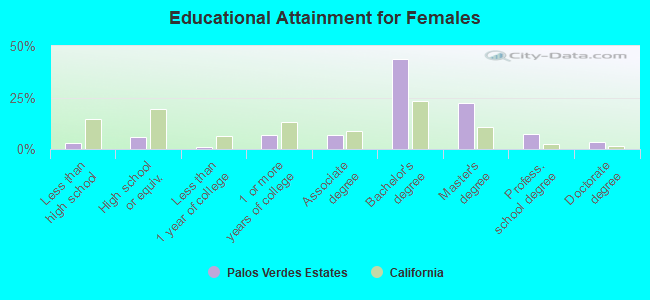
Education attainment for females 25 years and older:
No schooling: 37
Nursery to 4th grade: 0
5th and 6th grade: 0
7th and 8th grade: 0
9th grade: 0
10th grade: 0
11th grade: 2
12th grade, no diploma: 118
High school graduate (or equivalency): 289
Less than 1 year of college: 50
Some college more than 1 year, no degree: 336
Associate degree: 337
Bachelor's degree: 2,185
Master's degree: 1,130
Professional school degree: 362
Doctorate degree: 170
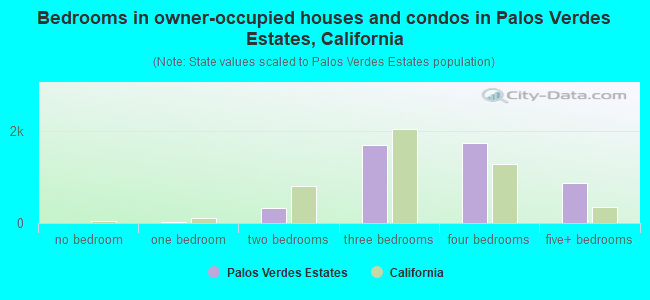
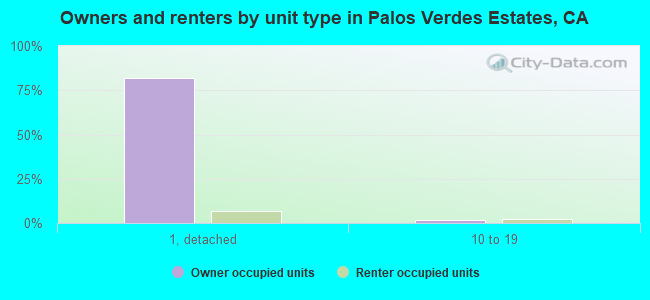
Housing units in structures:
One, detached: 5,218
One, attached: 35
3 or 4: 29
5 to 9: 96
10 to 19: 116
20 to 49: 64
50 or more: 10
Housing units lacking complete plumbing facilities in 2022: 0.3%
Housing units lacking complete kitchen facilities in 2022: 1.1%
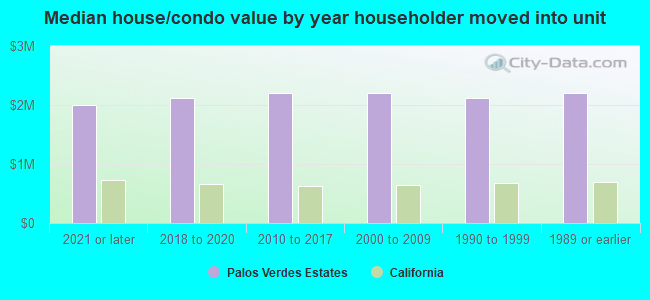
House/condo owner moved in on average 16 years ago