Pensacola, FL (Florida) Houses and Residents
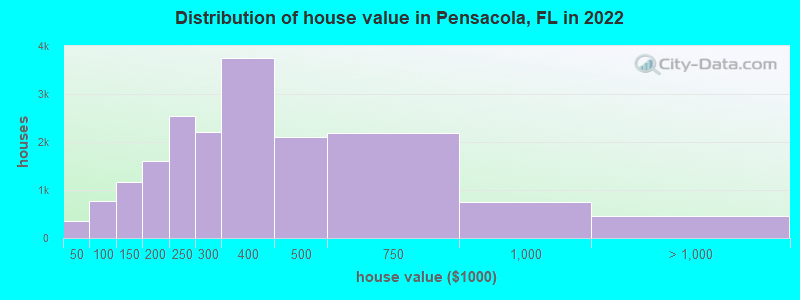
Estimated median house or condo value in 2022: $309,644 (it was $91,300 in 2000 )
Pensacola:
$309,644Florida:
$354,100
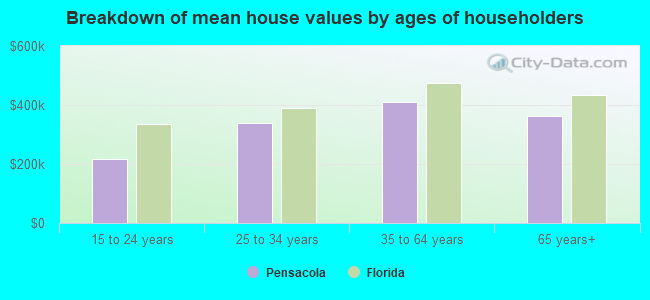
Lower value quartile - upper value quartile: $214,647 - $471,563Mean price in 2022: Detached houses: $344,051 Here:
$344,051State:
$500,941
Townhouses or other attached units: $329,391 Here:
$329,391State:
$370,869
In 2-unit structures: $503,324 Here:
$503,324State:
$423,188
In 3-to-4-unit structures: $468,822 Here:
$468,822State:
$309,944
In 5-or-more-unit structures: $310,122 Here:
$310,122State:
$447,145
Mobile homes: $38,959 Here:
$38,959State:
$113,202
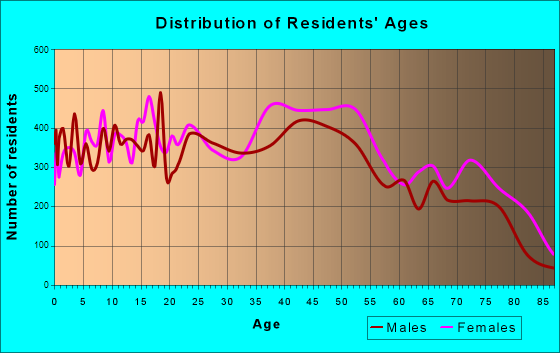
Total population: 53,068 (All urban)
Houses: 28,330 (25,339 occupied: 16,262 owner occupied, 9,926 renter occupied )
% of renters here:
38%State:
33%
Housing density: 1,248 houses/condos per square mile
Median price asked for vacant for-sale houses and condos in 2022: $1,339,034.
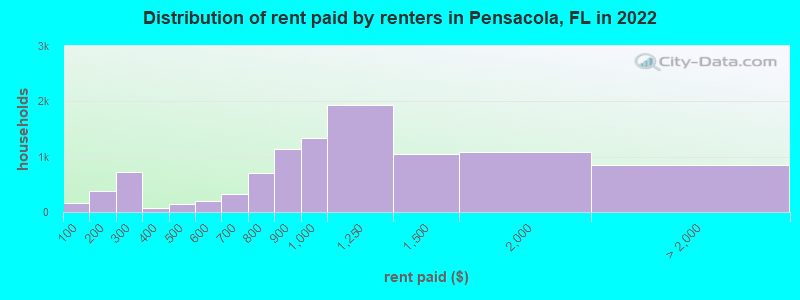
Median contract rent in 2022: $1,015 (lower quartile is $792, upper quartile is $1,374)
Median rent asked for vacant for-rent units in 2022: $1,249
Median gross rent in Pensacola, FL in 2022: $1,208
Housing units in Pensacola with a mortgage: 8,923 (579 second mortgage, 6 home equity loan, 471 both second mortgage and home equity loan )Houses without a mortgage: 328
Median household income for houses/condos with a mortgage: $105,229
Median household income for apartments without a mortgage: $66,507
Median monthly housing costs: $1,176
Data:
Median house or condo value ($)
Median house or condo value ($ change since 2000)
Median house or condo value ($) - White
Median house or condo value ($) - Black or African American
Median house or condo value ($) - Asian
Median house or condo value ($) - Hispanic or Latino
Median house or condo value ($) - American Indian and Alaska Native
Median house or condo value ($) - Multirace
Median house or condo value ($) - Other Race
Median price asked for mobile homes ($)
Household density (households per square mile)
Mean house or condo value by units in structure - 1, detached ($)
Mean house or condo value by units in structure - 1, attached ($)
Mean house or condo value by units in structure - 2 ($)
Mean house or condo value by units in structure by units in structure - 3 or 4 ($)
Mean house or condo value by units in structure - 5 or more ($)
Mean house or condo value by units in structure - Boat, RV, van, etc. ($)
Mean house or condo value by units in structure - Mobile home ($)
Median contract rent ($)
Median contract rent - Lower quartile ($)
Median contract rent - Upper quartile ($)
Median gross rent ($)
Urban houses (%)
Rural houses (%)
Houses occupied (%)
Houses occupied (% change since 2000)
Houses owner occupied (%)
Houses owner occupied (% change since 2000)
Houses renter occupied (%)
Houses renter occupied (% change since 2000)
Vacant housing units - For rent (%)
Vacant housing units - For rent (% change since 2000)
Vacant housing units - For sale only (%)
Vacant housing units - For sale only (% change since 2000)
Vacant housing units - Rented or sold, not occupied (%)
Vacant housing units - Rented or sold, not occupied (% change since 2000)
Vacant housing units - For seasonal, recreational, or occasional use (%)
Vacant housing units - For seasonal, recreational, or occasional use (% change since 2000)
Vacant housing units - For migrant workers (%)
Vacant housing units - For migrant workers (% change since 2000)
Vacant housing units - Other vacant (%)
Vacant housing units - Other vacant (% change since 2000)
Median monthly housing costs ($)
Median household income for houses/condos with a mortgage ($)
Median household income for houses/condos without a mortgage ($)
Median household income ($)
Median household income ($) - White
Median household income ($) - Black or African American
Median household income ($) - Asian
Median household income ($) - Hispanic or Latino
Median household income ($) - American Indian and Alaska Native
Median household income ($) - Multirace
Median household income ($) - Other Race
Mortgage status - with mortgage (%)
Mortgage status - with second mortgage (%)
Mortgage status - with home equity loan (%)
Mortgage status - with both second mortgage and home equity loan (%)
Mortgage status - without a mortgage (%)
Median year house/condo built
Median year apartment built
Household type by relationship - Male householder living alone (%)
Household type by relationship - Male householder not living alone (%)
Household type by relationship - Female householder living alone (%)
Household type by relationship - Female householder not living alone (%)
Household type by relationship - Opposite-Sex spouse (%)
Household type by relationship - Same-Sex spouse (%)
Household type by relationship - Opposite-Sex unmarried partner (%)
Household type by relationship - Same-Sex unmarried partner (%)
Household type by relationship - In group quarters (%)
Size of family households - 2-person household (%)
Size of family households - 3-person household (%)
Size of family households - 4-person household (%)
Size of family households - 5-person household (%)
Size of family households - 6-person household (%)
Size of family households - 7-or-more-person household (%)
Size of nonfamily households - 1-person household (%)
Size of nonfamily households - 2-person household (%)
Size of nonfamily households - 3-person household (%)
Size of nonfamily households - 4-person household (%)
Size of nonfamily households - 5-person household (%)
Size of nonfamily households - 6-person household (%)
Size of nonfamily households - 7-or-moreperson household (%)
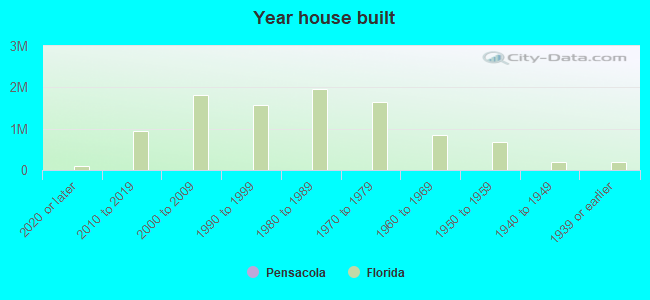
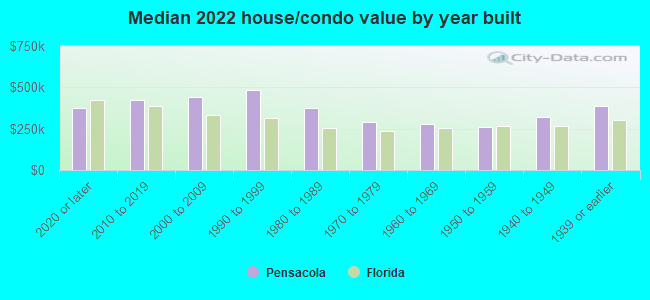
Year house built - Built 2010 or later (%)
Year house built - Built 2000 to 2009 (%)
Year house built - Built 1990 to 1999 (%)
Year house built - Built 1980 to 1989 (%)
Year house built - Built 1970 to 1979 (%)
Year house built - Built 1960 to 1969 (%)
Year house built - Built 1950 to 1959 (%)
Year house built - Built 1940 to 1949 (%)
Year house built - Built 1939 or earlier (%)
Median number of rooms in houses and condos
Median number of rooms in apartments
Median number of bedrooms in owner occupied houses
Mean number of bedrooms in owner occupied houses
Median number of bedrooms in renter occupied houses
Mean number of bedrooms in renter occupied houses
Median number of vehichles in owner occupied houses
Mean number of vehichles in owner occupied houses
Median number of vehichles in renter occupied houses
Mean number of vehichles in renter occupied houses
Rooms in owner-occupied houses - 1 room (%)
Rooms in owner-occupied houses - 2 rooms (%)
Rooms in owner-occupied houses - 3 rooms (%)
Rooms in owner-occupied houses - 4 rooms (%)
Rooms in owner-occupied houses - 5 rooms (%)
Rooms in owner-occupied houses - 6 rooms (%)
Rooms in owner-occupied houses - 7 rooms (%)
Rooms in owner-occupied houses - 8 rooms (%)
Rooms in owner-occupied houses - 9+ rooms (%)
Rooms in renter-occupied houses - 1 room (%)
Rooms in renter-occupied houses - 2 rooms (%)
Rooms in renter-occupied houses - 3 rooms (%)
Rooms in renter-occupied houses - 4 rooms (%)
Rooms in renter-occupied houses - 5 rooms (%)
Rooms in renter-occupied houses - 6 rooms (%)
Rooms in renter-occupied houses - 7 rooms (%)
Rooms in renter-occupied houses - 8 rooms (%)
Rooms in renter-occupied houses - 9+ rooms (%)
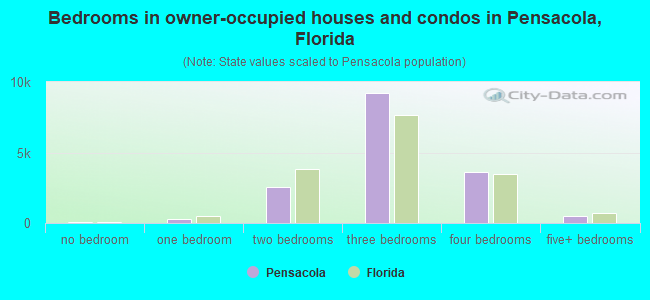
Bedrooms in owner-occupied houses - no bedrooms (%)
Bedrooms in owner-occupied houses - 1 bedroom (%)
Bedrooms in owner-occupied houses - 2 bedrooms (%)
Bedrooms in owner-occupied houses - 3 bedrooms (%)
Bedrooms in owner-occupied houses - 4 bedrooms (%)
Bedrooms in owner-occupied houses - 5+ bedrooms (%)
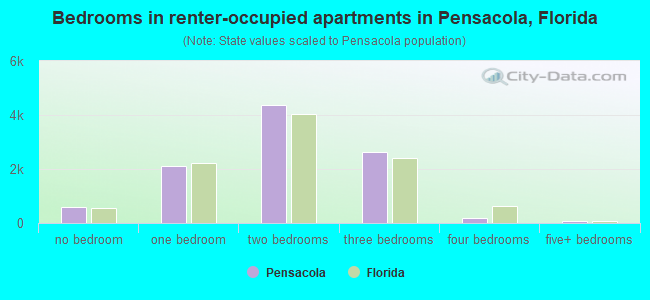
Bedrooms in renter-occupied houses - no bedrooms (%)
Bedrooms in renter-occupied houses - 1 bedroom (%)
Bedrooms in renter-occupied houses - 2 bedrooms (%)
Bedrooms in renter-occupied houses - 3 bedrooms (%)
Bedrooms in renter-occupied houses - 4 bedrooms (%)
Bedrooms in renter-occupied houses - 5+ bedrooms (%)
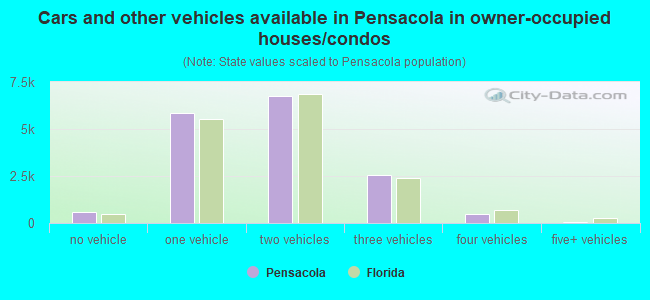
Vehicles available in owner-occupied houses - no vehicle available (%)
Vehicles available in owner-occupied houses - 1 vehicle available(%)
Vehicles available in owner-occupied houses - 2 Vehicles available (%)
Vehicles available in owner-occupied houses - 3 Vehicles available (%)
Vehicles available in owner-occupied houses - 4 Vehicles available (%)
Vehicles available in owner-occupied houses - 5+ Vehicles available (%)
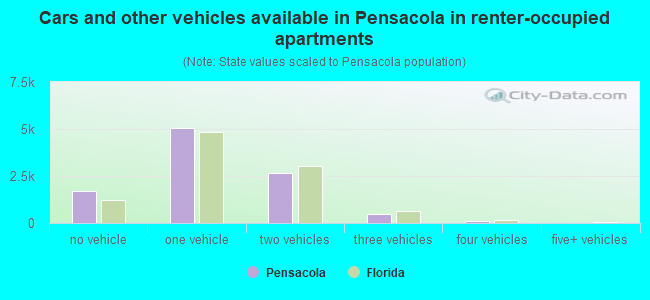
Vehicles available in renter-occupied houses - no vehicle available (%)
Vehicles available in renter-occupied houses - 1 vehicle available (%)
Vehicles available in renter-occupied houses - 2 Vehicles available (%)
Vehicles available in renter-occupied houses - 3 Vehicles available (%)
Vehicles available in renter-occupied houses - 4 Vehicles available (%)
Vehicles available in renter-occupied houses - 5+ Vehicles available (%)
Housing units in structures - 1, detached (%)
Housing units in structures - 1, attached (%)
Housing units in structures - 2 (%)
Housing units in structures - 3 or 4 (%)
Housing units in structures - 5 to 9 (%)
Housing units in structures - 10 to 19 (%)
Housing units in structures - 20 to 49 (%)
Housing units in structures - 50 or more (%)
Housing units in structures - Mobile home (%)
Housing units in structures - Boat, RV, van, etc. (%)
Housing units in structures - Owners - 1, detached (%)
Housing units in structures - Owners - 1, attached (%)
Housing units in structures - Owners - 2 (%)
Housing units in structures - Owners - 3 or 4 (%)
Housing units in structures - Owners - 5 to 9 (%)
Housing units in structures - Owners - 10 to 19 (%)
Housing units in structures - Owners - 20 to 49 (%)
Housing units in structures - Owners - 50 or more (%)
Housing units in structures - Owners - Mobile home (%)
Housing units in structures - Owners - Boat, RV, van, etc. (%)
Housing units in structures - Renters - 1, detached (%)
Housing units in structures - Renters - 1, attached (%)
Housing units in structures - Renters - 2 (%)
Housing units in structures - Renters - 3 or 4 (%)
Housing units in structures - Renters - 5 to 9 (%)
Housing units in structures - Renters - 10 to 19 (%)
Housing units in structures - Renters - 20 to 49 (%)
Housing units in structures - Renters - 50 or more (%)
Housing units in structures - Renters - Mobile home (%)
Housing units in structures - Renters - Boat, RV, van, etc. (%)
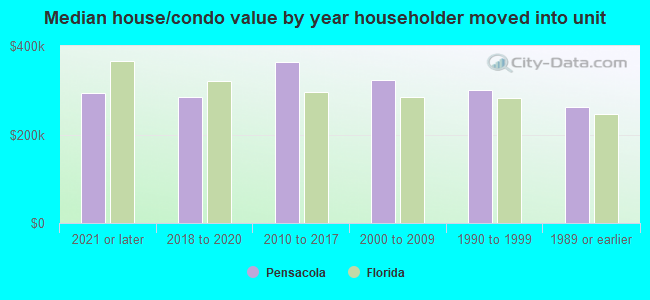
House/condo owner moved in on average (years ago)
Renter moved in on average (years ago)
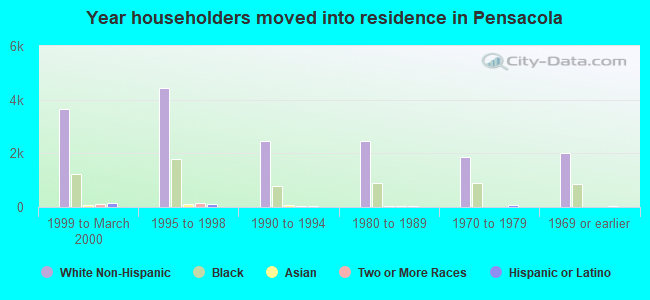
Year householder moved into unit - Moved in 1999 to March 2000 (%)
Year householder moved into unit - Moved in 1999 to March 2000 (%) - White
Year householder moved into unit - Moved in 1999 to March 2000 (%) - Black or African American
Year householder moved into unit - Moved in 1999 to March 2000 (%) - Asian
Year householder moved into unit - Moved in 1999 to March 2000 (%) - Hispanic or Latino
Year householder moved into unit - Moved in 1999 to March 2000 (%) - American Indian and Alaska Native
Year householder moved into unit - Moved in 1999 to March 2000 (%) - Multirace
Year householder moved into unit - Moved in 1999 to March 2000 (%) - Other Race
Year householder moved into unit - Moved in 1995 to 1998 (%)
Year householder moved into unit - Moved in 1995 to 1998 (%) - White
Year householder moved into unit - Moved in 1995 to 1998 (%) - Black or African American
Year householder moved into unit - Moved in 1995 to 1998 (%) - Asian
Year householder moved into unit - Moved in 1995 to 1998 (%) - Hispanic or Latino
Year householder moved into unit - Moved in 1995 to 1998 (%) - American Indian and Alaska Native
Year householder moved into unit - Moved in 1995 to 1998 (%) - Multirace
Year householder moved into unit - Moved in 1995 to 1998 (%) - Other Race
Year householder moved into unit - Moved in 1990 to 1994 (%)
Year householder moved into unit - Moved in 1990 to 1994 (%) - White
Year householder moved into unit - Moved in 1990 to 1994 (%) - Black or African American
Year householder moved into unit - Moved in 1990 to 1994 (%) - Asian
Year householder moved into unit - Moved in 1990 to 1994 (%) - Hispanic or Latino
Year householder moved into unit - Moved in 1990 to 1994 (%) - American Indian and Alaska Native
Year householder moved into unit - Moved in 1990 to 1994 (%) - Multirace
Year householder moved into unit - Moved in 1990 to 1994 (%) - Other Race
Year householder moved into unit - Moved in 1980 to 1989 (%)
Year householder moved into unit - Moved in 1980 to 1989 (%) - White
Year householder moved into unit - Moved in 1980 to 1989 (%) - Black or African American
Year householder moved into unit - Moved in 1980 to 1989 (%) - Asian
Year householder moved into unit - Moved in 1980 to 1989 (%) - Hispanic or Latino
Year householder moved into unit - Moved in 1980 to 1989 (%) - American Indian and Alaska Native
Year householder moved into unit - Moved in 1980 to 1989 (%) - Multirace
Year householder moved into unit - Moved in 1980 to 1989 (%) - Other Race
Year householder moved into unit - Moved in 1970 to 1979 (%)
Year householder moved into unit - Moved in 1970 to 1979 (%) - White
Year householder moved into unit - Moved in 1970 to 1979 (%) - Black or African American
Year householder moved into unit - Moved in 1970 to 1979 (%) - Asian
Year householder moved into unit - Moved in 1970 to 1979 (%) - Hispanic or Latino
Year householder moved into unit - Moved in 1970 to 1979 (%) - American Indian and Alaska Native
Year householder moved into unit - Moved in 1970 to 1979 (%) - Multirace
Year householder moved into unit - Moved in 1970 to 1979 (%) - Other Race
Year householder moved into unit - Moved in 1969 or earlier (%)
Year householder moved into unit - Moved in 1969 or earlier (%) - White
Year householder moved into unit - Moved in 1969 or earlier (%) - Black or African American
Year householder moved into unit - Moved in 1969 or earlier (%) - Asian
Year householder moved into unit - Moved in 1969 or earlier (%) - Hispanic or Latino
Year householder moved into unit - Moved in 1969 or earlier (%) - American Indian and Alaska Native
Year householder moved into unit - Moved in 1969 or earlier (%) - Multirace
Year householder moved into unit - Moved in 1969 or earlier (%) - Other Race
Housing units lacking complete plumbing facilities (%)
Housing units lacking complete kitchen facilities (%)
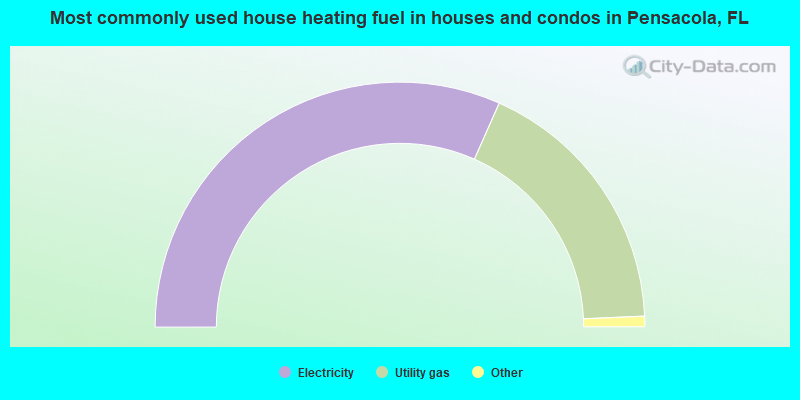
House heating fuel used in houses and condos - Utility gas (%)
House heating fuel used in houses and condos - Bottled, tank, or LP gas (%)
House heating fuel used in houses and condos - Electricity (%)
House heating fuel used in houses and condos - Fuel oil, kerosene, etc. (%)
House heating fuel used in houses and condos - Coal or coke (%)
House heating fuel used in houses and condos - Wood (%)
House heating fuel used in houses and condos - Solar energy (%)
House heating fuel used in houses and condos - Other fuel (%)
House heating fuel used in houses and condos - No fuel used (%)
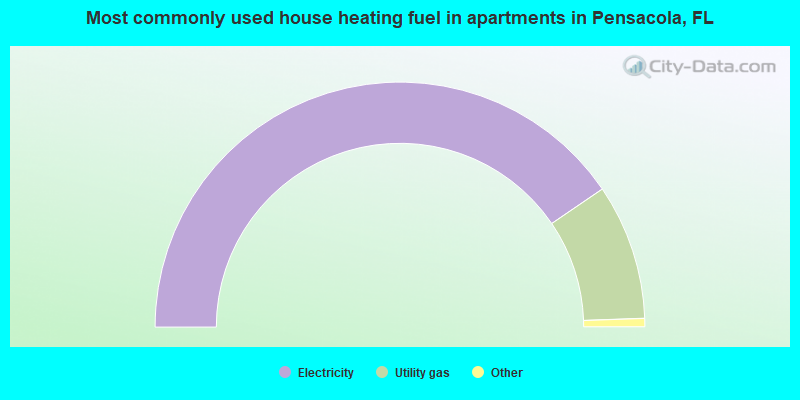
House heating fuel used in apartments - Utility gas (%)
House heating fuel used in apartments - Bottled, tank, or LP gas (%)
House heating fuel used in apartments - Electricity (%)
House heating fuel used in apartments - Fuel oil, kerosene, etc. (%)
House heating fuel used in apartments - Coal or coke (%)
House heating fuel used in apartments - Wood (%)
House heating fuel used in apartments - Solar energy (%)
House heating fuel used in apartments - Other fuel (%)
House heating fuel used in apartments - No fuel used (%)
Latest news about housing in Pensacola, FL collected exclusively by city-data.com from local newspapers, TV, and radio stations
Median year house/condo built: 1968Median year apartment built: 1980Household type by relationship:
Households: 54,661
Male householders: 11,442 (3,840 living alone ), Female householders: 13,605 (5,850 living alone )8,486 spouses (8,327 opposite-sex spouses ), 1,902 unmarried partners , (1,732 opposite-sex unmarried partners ), 13,221 children (12,816 natural , 81 adopted , 323 stepchildren ), 1,962 grandchildren , 560 brothers or sisters , 446 parents , 94 foster children , 598 other relatives , 1,758 non-relatives In group quarters: 582
Size of family households: 7,167 2-persons , 2,737 3-persons , 1,958 4-persons , 750 5-persons , 390 6-persons , 107 7-or-more-persons .
Size of nonfamily households: 10,774 1-person , 2,212 2-persons , 137 3-persons , 44 4-persons , 118 5-persons .
5,112 married couples with children. single-parent households (1,106 men , 2,852 women ).
94.3% of residents of Pensacola speak English at home. of residents speak Spanish at home (65% speak English very well , 23% speak English well , 9% speak English not well , 2% don't speak English at all ).of residents speak other Indo-European language at home (86% speak English very well , 13% speak English well , 2% speak English not well ).of residents speak Asian or Pacific Island language at home (58% speak English very well , 37% speak English well , 5% don't speak English at all ).of residents speak other language at home (91% speak English very well , 4% speak English well , 5% speak English not well ).
Foreign born population: 2,297 (4.2%)of them are naturalized citizens )
Median number of rooms in houses and condos:
Median number of rooms in apartments
Owner-occupied Renter-occupied
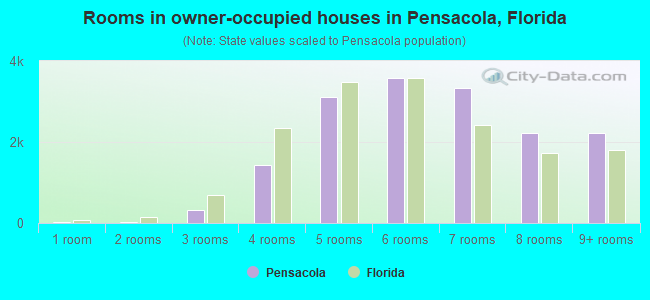
Rooms in owner-occupied houses in Pensacola, Florida
20 1 room 24 2 rooms 332 3 rooms 1,437 4 rooms 3,121 5 rooms 3,576 6 rooms 3,325 7 rooms 2,213 8 rooms 2,215 9+ rooms
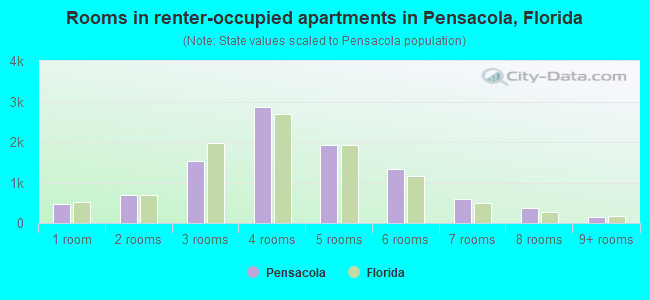
Rooms in renter-occupied apartments in Pensacola, Florida
459 1 room 691 2 rooms 1,531 3 rooms 2,866 4 rooms 1,932 5 rooms 1,329 6 rooms 599 7 rooms 367 8 rooms 152 9+ rooms
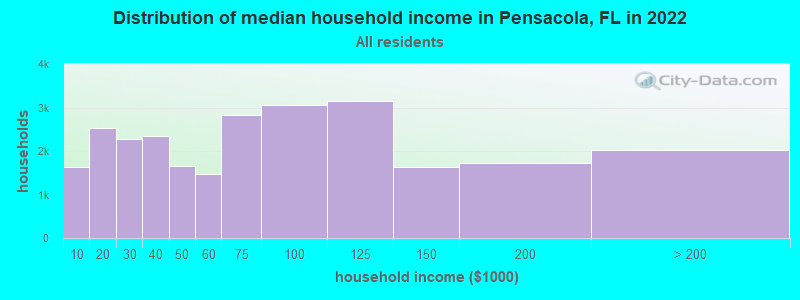
Pensacola, FL household income distribution 1,643 Less than $10,0002,526 $10,000 to $19,9992,273 $20,000 to $29,9992,349 $30,000 to $39,9991,644 $40,000 to $49,9991,469 $50,000 to $59,9992,831 $60,000 to $74,9993,062 $75,000 to $99,9993,152 $100,000 to $124,9991,632 $125,000 to $149,9991,722 $150,000 to $199,9992,025 $200,000 or more
Home value of owner - occupied houses in 2022 in Pensacola, FL 111 Less than $10,00037 $10,000 to $14,99959 $15,000 to $19,99941 $20,000 to $24,99926 $25,000 to $29,99922 $30,000 to $34,99912 $35,000 to $39,99944 $40,000 to $49,999126 $50,000 to $59,99978 $60,000 to $69,999233 $70,000 to $79,999162 $80,000 to $89,999127 $90,000 to $99,999554 $100,000 to $124,999620 $125,000 to $149,999809 $150,000 to $174,999788 $175,000 to $199,9992,543 $200,000 to $249,9992,211 $250,000 to $299,9993,741 $300,000 to $399,9992,100 $400,000 to $499,9992,191 $500,000 to $749,999750 $750,000 to $999,999241 $1,000,000 to $1,499,99991 $1,500,000 to $1,999,999122 $2,000,000 or moreRent paid by renters in 2022 in Pensacola, FL 163 Less than $10065 $100 to $149318 $150 to $199476 $200 to $249238 $250 to $29958 $300 to $34919 $350 to $39970 $400 to $44969 $450 to $49954 $500 to $549140 $550 to $599180 $600 to $649148 $650 to $699324 $700 to $749386 $750 to $7991,134 $800 to $8991,332 $900 to $9991,931 $1,000 to $1,2491,056 $1,250 to $1,4991,085 $1,500 to $1,999441 $2,000 to $2,499148 $2,500 to $2,999102 $3,000 to $3,499158 No cash rent
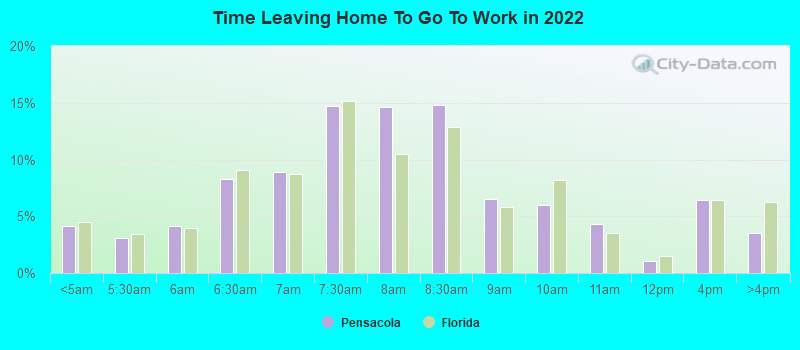
Percentage of workers working in this county: 85.3%Number of people working at home: 4,085 (15.2% of all workers )
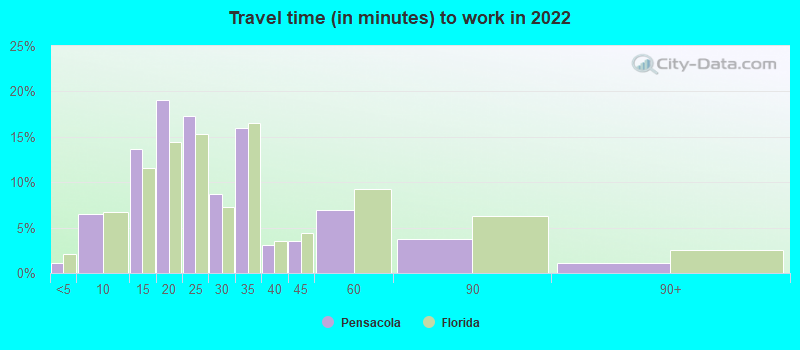
Travel time to work (commute)
Less than 5 minutes: 5665 to 9 minutes: 2,92010 to 14 minutes: 4,13715 to 19 minutes: 4,95520 to 24 minutes: 3,54325 to 29 minutes: 1,33430 to 34 minutes: 2,02735 to 39 minutes: 50940 to 44 minutes: 34245 to 59 minutes: 89560 to 89 minutes: 95190 or more minutes: 312
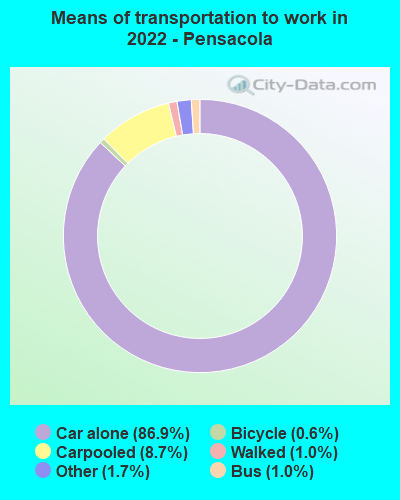
Means of transportation to work:
Drove a car alone: 45,516 (82.2%)Carpooled: 3,807 (6.9%)Bus : 423 (0.8%)Subway or elevated rail : 10 (0.0%)Ferryboat: 9 (0.0%)Taxi: 830 (1.5%)Bicycle: 152 (0.3%)Walked: 310 (0.6%)Worked at home: 4,085 (7.4%)
Unemployment by race in 2022
Unemployment rate for White non-Hispanic residents 3.3% Males1.8% FemalesUnemployment rate for Black residents 14.8% Males5.8% FemalesUnemployment rate for Asian residents 9.5% FemalesUnemployment rate for other race residents 2.3% FemalesUnemployment rate for two or more race residents 7.5% FemalesUnemployment rate for Hispanic or Latino residents 0.8% Males11.6% Females
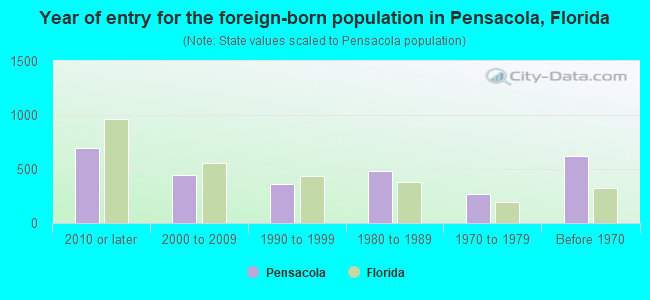
Year of entry for the foreign-born population in Pensacola, Florida
694 2010 or later 440 2000 to 2009 362 1990 to 1999 478 1980 to 1989 265 1970 to 1979 619 Before 1970
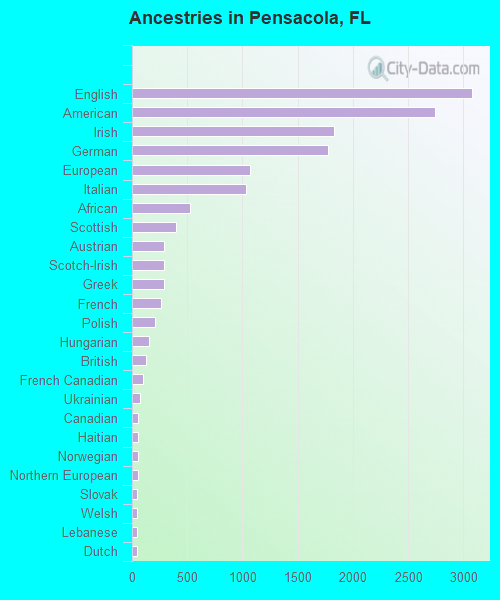
First ancestries reported:
English: 3,079 (10.8%)
American: 2,741 (9.6%)
Irish: 1,827 (6.4%)
German: 1,775 (6.2%)
European: 1,071 (3.8%)
Italian: 1,030 (3.6%)
African: 523 (1.8%)
Scottish: 401 (1.4%)
Austrian: 291 (1.0%)
Scotch-Irish: 290 (1.0%)
Greek: 288 (1.0%)
French: 264 (0.9%)
Polish: 207 (0.7%)
Hungarian: 155 (0.5%)
British: 124 (0.4%)
French Canadian: 97 (0.3%)
Ukrainian: 69 (0.2%)
Canadian: 58 (0.2%)
Haitian: 56 (0.2%)
Norwegian: 55 (0.2%)
Northern European: 54 (0.2%)
Slovak: 48 (0.2%)
Welsh: 48 (0.2%)
Lebanese: 45 (0.2%)
Dutch: 43 (0.2%)
Czech: 43 (0.2%)
Russian: 42 (0.1%)
Scandinavian: 42 (0.1%)
Eastern European: 38 (0.1%)
Cajun: 37 (0.1%)
Icelander: 33 (0.1%)
Romanian: 30 (0.1%)
Swedish: 25 (0.09%)
Jamaican: 24 (0.08%)
Cape Verdean: 22 (0.08%)
Croatian: 21 (0.07%)
Danish: 19 (0.07%)
Portuguese: 19 (0.07%)
Brazilian: 16 (0.06%)
Arab: 15 (0.05%)
Armenian: 12 (0.04%)
Finnish: 9 (0.03%)
Latvian: 8 (0.03%)
Belizean: 8 (0.03%)
Lithuanian: 7 (0.02%)
Czechoslovakian: 6 (0.02%)
Most common places of birth for foreign-born residents (%): Mexico Pensacola:
15.0% (348)Florida:
5.6% (257,152)
China, excluding Hong Kong and Taiwan Pensacola:
7.5% (173)Florida:
1.2% (56,071)
Austria Pensacola:
7.5% (173)Florida:
0.1% (3,914)
Philippines Pensacola:
7.4% (171)Florida:
1.8% (84,403)
Canada Pensacola:
4.5% (105)Florida:
2.4% (109,132)
Brazil Pensacola:
3.7% (86)Florida:
2.7% (122,906)
England Pensacola:
3.5% (82)Florida:
0.8% (37,723)
Vietnam Pensacola:
3.4% (79)Florida:
1.3% (60,604)
United Kingdom, excluding England and Scotland Pensacola:
3.1% (73)Florida:
0.7% (34,227)
France Pensacola:
2.5% (58)Florida:
0.4% (20,008)
Oceania, n.e.c. Pensacola:
2.2% (51)Florida:
0.0% (1,143)
Taiwan Pensacola:
1.9% (45)Florida:
0.2% (8,002)
Panama Pensacola:
1.9% (44)Florida:
0.5% (22,972)
Jamaica Pensacola:
1.8% (42)Florida:
5.0% (227,319)
Haiti Pensacola:
1.8% (42)Florida:
7.5% (342,375)
India Pensacola:
1.7% (40)Florida:
2.1% (94,349)
Other Western Africa Pensacola:
1.6% (37)Florida:
0.0% (1,033)
South Africa Pensacola:
1.6% (36)Florida:
0.2% (11,243)
Sri Lanka Pensacola:
1.5% (35)Florida:
0.1% (2,649)
Chile Pensacola:
1.5% (35)Florida:
0.5% (22,715)
Peru Pensacola:
1.5% (35)Florida:
2.1% (96,693)
Place of birth for U.S.-born residents:
This state: 25,186Other state: 26,048Northeast: 3,755Midwest: 4,968South: 13,974West: 3,355 85.8% of Pensacola residents lived in the same house 1 years ago.
Out of people who lived in different houses, 36.7% lived in this county.
Out of people who lived in different counties, 33.5% lived in Florida.
Pensacola:
85.8%State average:
86.3%
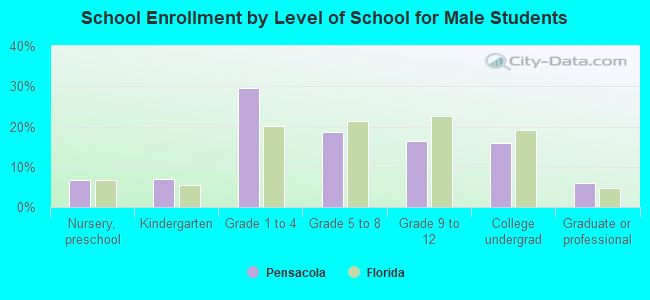
Education attainment for males 25 years and older:
No schooling: 191Nursery to 4th grade: 705th and 6th grade: 297th and 8th grade: 349th grade: 19410th grade: 30711th grade: 26312th grade, no diploma: 355High school graduate (or equivalency): 3,563Less than 1 year of college: 1,071Some college more than 1 year, no degree: 2,050Associate degree: 2,168Bachelor's degree: 4,471Master's degree: 1,919Professional school degree: 705Doctorate degree: 593
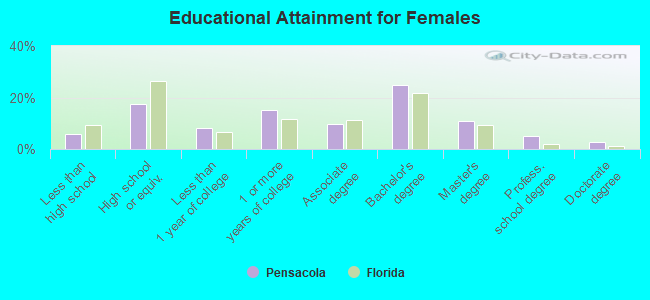
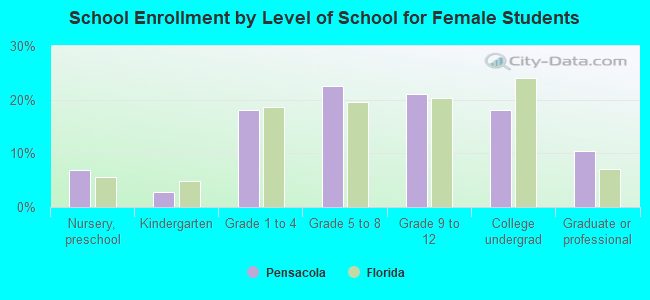
Education attainment for females 25 years and older:
No schooling: 115Nursery to 4th grade: 1055th and 6th grade: 527th and 8th grade: 829th grade: 28310th grade: 10611th grade: 30712th grade, no diploma: 206High school graduate (or equivalency): 3,878Less than 1 year of college: 1,784Some college more than 1 year, no degree: 3,326Associate degree: 2,157Bachelor's degree: 5,466Master's degree: 2,423Professional school degree: 1,098Doctorate degree: 622
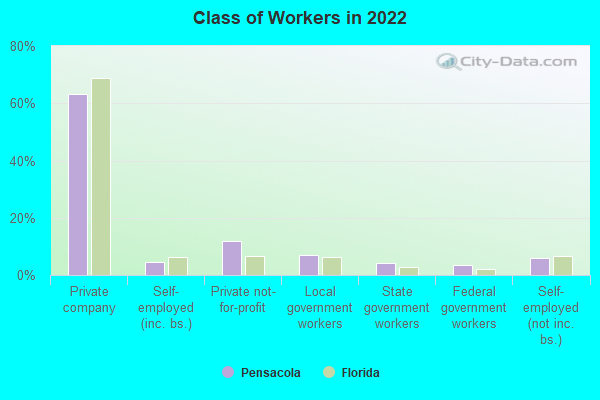
Housing units in structures:
One, detached: 20,058One, attached: 738Two: 1,2593 or 4: 1,4935 to 9: 1,53210 to 19: 72120 to 49: 80850 or more: 1,603Mobile homes: 106Boats, RVs, vans, etc.: 9Housing units lacking complete plumbing facilities in 2022: 1.3%Housing units lacking complete kitchen facilities in 2022: 2.1%House/condo owner moved in on average 12 years ago
Renter moved in on average 4 years ago
Private vs. public school enrollment:
Students in private schools in grades 1 to 8 (elementary and middle school): 1,872 Students in private schools in grades 9 to 12 (high school): 494 Students in private undergraduate colleges: 102