Philipstown, NY (New York) Houses and Residents
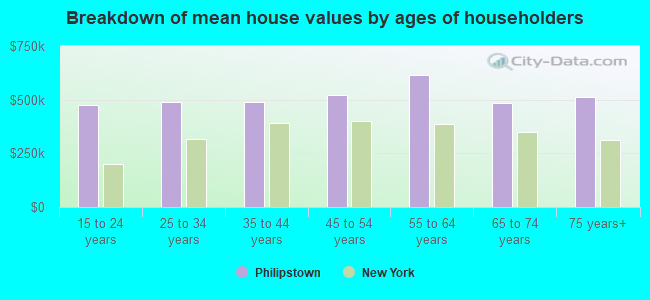
| Philipstown: | $476,645 |
| New York: | $400,400 |
Total population: 9,662 (Urban population: 5,210 (1,828 inside urbanized areas, 3,382 inside urban clusters), Rural population: 4,212 (all nonfarm))
Houses: 3,983 (3,599 occupied: 2,804 owner occupied, 795 renter occupied)
| % of renters here: | 22% |
| State: | 46% |
Housing density: 82 houses/condos per square mile
Median price asked for vacant for-sale houses and condos in 2022 in this county: $538,616.
Median contract rent in 2022: $1,573 (lower quartile is $1,016, upper quartile is $1,931)
Median rent asked for vacant for-rent units in 2022: $2,032
Median gross rent in Philipstown, NY in 2022: $1,500
Housing units in Philipstown with a mortgage: 1,645 (134 second mortgage, 240 home equity loan, 10 both second mortgage and home equity loan)
Houses without a mortgage: 727
Compare current foreclosures near Philipstown, NY:
| Photo | Address | Area | Beds / Baths | Price | Details |
|---|---|---|---|---|---|

|
#1
Tonetta Lake Rd
Brewster, NY 10509
|
2,383 sq. feet
|
2 baths 3 beds |
$174,900
|
show details |

|
#2
Patti Pl
Hopewell Junction, NY 12533
|
1,400 sq. feet
|
2 baths 3 beds |
$518,900
|
show details |

|
#3
Lenni Lenape Ct
Stony Point, NY 10980
|
3,252 sq. feet
|
3 baths 4 beds |
$699,900
|
show details |

|
#4
Dorothy Hts
Wappingers Falls, NY 12590
|
1,113 sq. feet
|
1 baths 3 beds |
$389,900
|
show details |

|
#5
N Brewster Rd
Brewster, NY 10509
|
3,424 sq. feet
|
2 baths 5 beds |
$325,000
|
show details |

|
#6
Penny Ln
Marlboro, NY 12542
|
2,514 sq. feet
|
2 baths 3 beds |
$299,900
|
show details |

|
#7
Maiden Ln
Maybrook, NY 12543
|
770 sq. feet
|
1 baths 2 beds |
$345,000
|
show details |

|
#8
N Riverside Ave
Croton On Hudson, NY 10520
|
1,642 sq. feet
|
2 baths 3 beds |
$595,000
|
show details |

|
#9
Chalmers Blvd
Amawalk, NY 10501
|
1,072 sq. feet
|
1 baths 1 beds |
$489,900
|
show details |

|
#10
Lyons Ln
Milton, NY 12547
|
1,872 sq. feet
|
2 baths 3 beds |
$34,900
|
show details |
| Photo | Address | Area | Beds / Baths | Price | Details |
|---|---|---|---|---|---|

|
#11
New Unionville Rd
Wallkill, NY 12589
|
- sq. feet
|
1 baths 5 beds |
$199,500
|
show details |

|
#12
Drew Ave
Highland Falls, NY 10928
|
1,724 sq. feet
|
2 baths 4 beds |
show details | |

|
#13
Lexington Hl # 7
Harriman, NY 10926
|
950 sq. feet
|
2 baths 2 beds |
show details | |

|
#14
Jessen Pl
Beacon, NY 12508
|
1,934 sq. feet
|
2 baths 4 beds |
show details | |

|
#15
Oakland Ave
Central Valley, NY 10917
|
1,904 sq. feet
|
2 baths 4 beds |
show details | |

|
#16
Honness Rd
Fishkill, NY 12524
|
3,292 sq. feet
|
2 baths 3 beds |
show details | |

|
#17
South St
Marlboro, NY 12542
|
1,637 sq. feet
|
1 baths 2 beds |
show details | |

|
#18
Farmers Mills Rd
Carmel, NY 10512
|
2,067 sq. feet
|
2 baths 3 beds |
show details | |

|
#19
Grape Hollow Rd
Holmes, NY 12531
|
3,972 sq. feet
|
3 baths 6 beds |
show details | |

|
#20
Hamilton Rd
Hopewell Junction, NY 12533
|
2,468 sq. feet
|
3 baths 4 beds |
show details |
| Photo | Address | Area | Beds / Baths | Price | Details |
|---|---|---|---|---|---|

|
#21
Route 9w # 9
Newburgh, NY 12550
|
1,314 sq. feet
|
1 baths 4 beds |
show details | |

|
#22
Captain Shankey Dr
Garnerville, NY 10923
|
981 sq. feet
|
1 baths 2 beds |
show details | |

|
#23
Edge Hill Rd
Wappingers Falls, NY 12590
|
3,263 sq. feet
|
3 baths 3 beds |
show details | |

|
#24
Harth Dr
New Windsor, NY 12553
|
1,410 sq. feet
|
1 baths 3 beds |
show details | |

|
#25
Paddock Pl
Newburgh, NY 12550
|
1,404 sq. feet
|
2 baths 3 beds |
show details | |

|
#26
Stowe Rd
Peekskill, NY 10566
|
- sq. feet
|
2 baths 4 beds |
show details | |

|
#27
Walnut Dr
Mahopac, NY 10541
|
2,284 sq. feet
|
2 baths 4 beds |
show details | |

|
#28
Kitchawan Rd
Ossining, NY 10562
|
7,000 sq. feet
|
5 baths 8 beds |
show details | |

|
#29
Hillside Ave
New Windsor, NY 12553
|
2,114 sq. feet
|
2 baths 5 beds |
show details | |

|
#30
James St
Stony Point, NY 10980
|
1,134 sq. feet
|
1 baths 2 beds |
show details |
| Photo | Address | Area | Beds / Baths | Price | Details |
|---|---|---|---|---|---|

|
#31
Echo Rd
Carmel, NY 10512
|
1,368 sq. feet
|
1 baths 3 beds |
show details | |

|
#32
Route 376
Wappingers Falls, NY 12590
|
1,894 sq. feet
|
1 baths 3 beds |
show details | |

|
#33
Patricia Ln
Washingtonville, NY 10992
|
1,310 sq. feet
|
1 baths 2 beds |
show details | |

|
#34
Concord St
Newburgh, NY 12550
|
1,548 sq. feet
|
1 baths 3 beds |
show details | |

|
#35
Friendly Rd
Mahopac, NY 10541
|
1,808 sq. feet
|
1 baths 4 beds |
show details | |

|
#36
Acorn Ct
Wappingers Falls, NY 12590
|
2,821 sq. feet
|
2 baths 4 beds |
show details | |

|
#37
Dunham Ct
Hopewell Junction, NY 12533
|
3,151 sq. feet
|
2 baths 4 beds |
show details | |

|
#38
Miller Hill Rd
Carmel, NY 10512
|
816 sq. feet
|
1 baths 1 beds |
show details | |

|
#39
Fox Run Ln
Carmel, NY 10512
|
706 sq. feet
|
1 baths 1 beds |
show details | |

|
#40
Purse Ln # 12533
Hopewell Junction, NY 12533
|
910 sq. feet
|
1 baths 2 beds |
show details |
| Photo | Address | Area | Beds / Baths | Price | Details |
|---|---|---|---|---|---|

|
#41
Edgewood Trl
Monroe, NY 10950
|
916 sq. feet
|
2 baths 2 beds |
show details | |

|
#42
Cooper Rd
Fishkill, NY 12524
|
1,346 sq. feet
|
2 baths 2 beds |
show details | |

|
#43
Cumberland Rd
Fishkill, NY 12524
|
2,630 sq. feet
|
3 baths 3 beds |
show details | |

|
#44
Starview Ave
Putnam Valley, NY 10579
|
1,952 sq. feet
|
2 baths 2 beds |
show details | |

|
#45
Stanley Rd
Garnerville, NY 10923
|
1,098 sq. feet
|
2 baths 2 beds |
show details | |

|
#46
All Angels Hill Rd
Wappingers Falls, NY 12590
|
1,196 sq. feet
|
2 baths 3 beds |
show details | |

|
#47
Ethan Allen Dr
Stony Point, NY 10980
|
1,890 sq. feet
|
1 baths 3 beds |
show details | |

|
#48
Bridge Ln
Haverstraw, NY 10927
|
2,520 sq. feet
|
3 baths 3 beds |
show details | |

|
#49
Harrisons Trl
Hopewell Junction, NY 12533
|
3,252 sq. feet
|
3 baths 4 beds |
show details | |

|
Check over 1 million property listings on Foreclosure.com!
|
browse all offers | |||

Household type by relationship:
Households: 97,118- In family households: 86,182 (19,004 male householders, 7,256 female householders)
21,650 spouses, 31,544 children (30,091 natural, 616 adopted, 837 stepchildren), 1,205 grandchildren, 762 brothers or sisters, 1,136 parents, foster children, 975 other relatives, 1,732 non-relatives
- In nonfamily households: 10,936 (4,152 male householders (3,154 living alone)), 4,629 female householders (3,961 living alone)), 2,155 nonrelatives
- In group quarters: 2,592 (674 institutionalized population)
20,870 married couples with children.
2,877 single-parent households (655 men, 2,222 women).
88.8% of residents of Philipstown speak English at home.
2.8% of residents speak Spanish at home (62% speak English very well, 21% speak English well, 14% speak English not well, 2% don't speak English at all).
7.3% of residents speak other Indo-European language at home (79% speak English very well, 15% speak English well, 6% speak English not well).
1.0% of residents speak Asian or Pacific Island language at home (44% speak English very well, 29% speak English well, 27% speak English not well).
0.2% of residents speak other language at home (100% speak English very well).
Foreign born population: 1,302 (13.5%)
(83.0% of them are naturalized citizens)
| Here: | 6.4 |
| State: | 6.3 |
| Here: | 4.6 |
| State: | 3.8 |
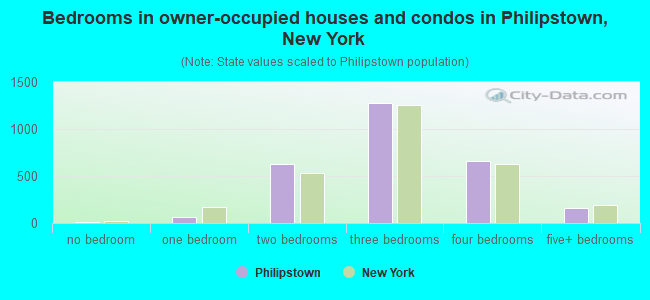
- Bedrooms in owner-occupied houses and condos in Philipstown, New York
- 7no bedroom
- 681 bedroom
- 6242 bedrooms
- 1,2783 bedrooms
- 6644 bedrooms
- 1635+ bedrooms
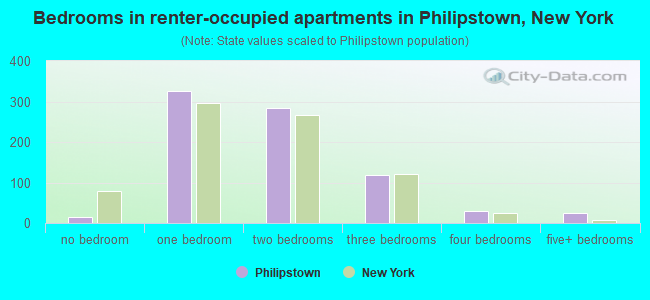
- Bedrooms in renter-occupied apartments in Philipstown, New York
- 15no bedroom
- 3251 bedroom
- 2832 bedrooms
- 1183 bedrooms
- 294 bedrooms
- 255+ bedrooms
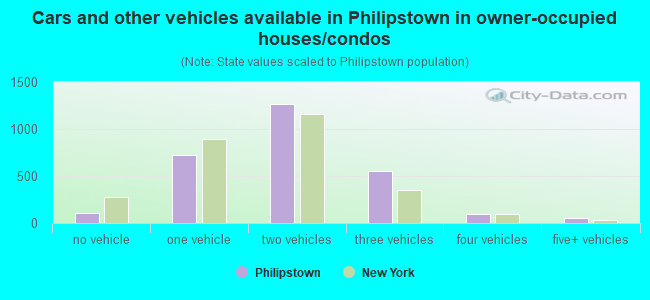
- Cars and other vehicles available in Philipstown in owner-occupied houses/condos
- 110no vehicle
- 7201 vehicle
- 1,2712 vehicles
- 5573 vehicles
- 984 vehicles
- 485+ vehicles
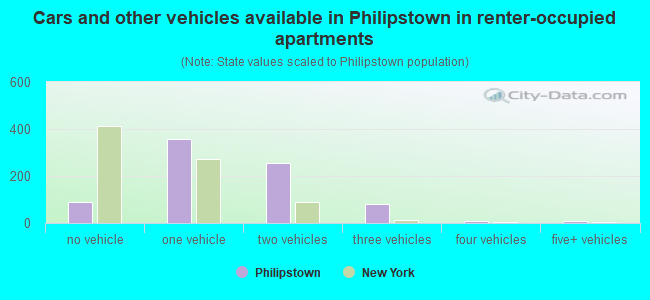
- Cars and other vehicles available in Philipstown in renter-occupied apartments
- 88no vehicle
- 3561 vehicle
- 2552 vehicles
- 793 vehicles
- 104 vehicles
- 75+ vehicles
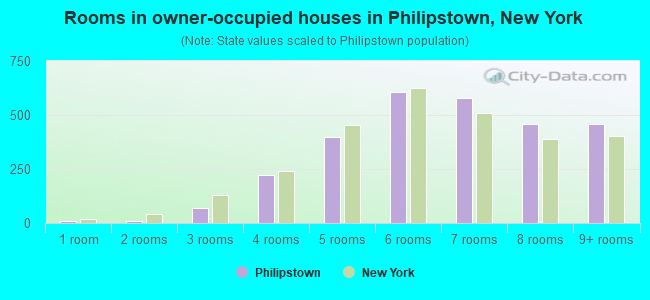
- Rooms in owner-occupied houses in Philipstown, New York
- 71 room
- 82 rooms
- 683 rooms
- 2214 rooms
- 3975 rooms
- 6086 rooms
- 5787 rooms
- 4598 rooms
- 4589+ rooms
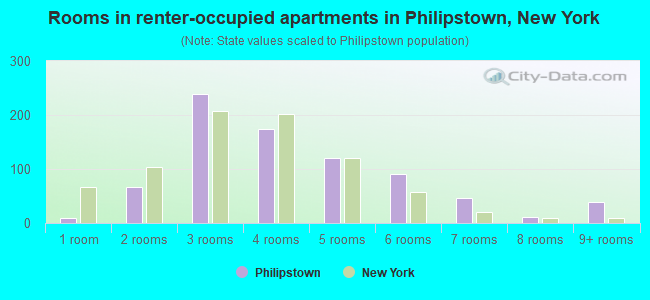
- Rooms in renter-occupied apartments in Philipstown, New York
- 101 room
- 662 rooms
- 2383 rooms
- 1744 rooms
- 1205 rooms
- 916 rooms
- 467 rooms
- 118 rooms
- 399+ rooms
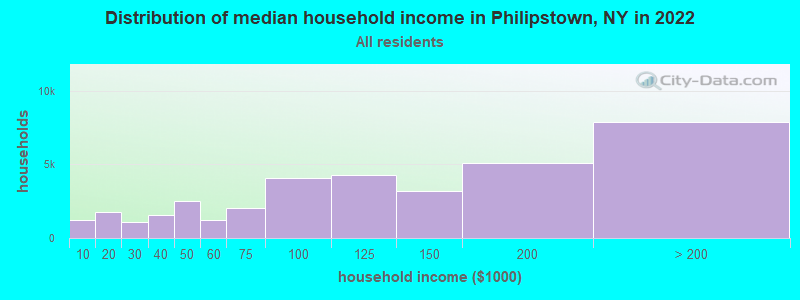
Philipstown, NY household income distribution

- 1,213Less than $10,000
- 1,779$10,000 to $19,999
- 1,058$20,000 to $29,999
- 1,580$30,000 to $39,999
- 2,509$40,000 to $49,999
- 1,240$50,000 to $59,999
- 2,019$60,000 to $74,999
- 4,096$75,000 to $99,999
- 4,274$100,000 to $124,999
- 3,166$125,000 to $149,999
- 5,091$150,000 to $199,999
- 7,886$200,000 or more
Percentage of workers working in this county: 36.4%
Number of people working at home: 711 (13.6% of all workers)
Travel time to work (commute)
- Less than 5 minutes: 137
- 5 to 9 minutes: 324
- 10 to 14 minutes: 432
- 15 to 19 minutes: 327
- 20 to 24 minutes: 332
- 25 to 29 minutes: 161
- 30 to 34 minutes: 400
- 35 to 39 minutes: 153
- 40 to 44 minutes: 257
- 45 to 59 minutes: 559
- 60 to 89 minutes: 630
- 90 or more minutes: 713
Means of transportation to work:
- Drove a car alone: 3,173 (67.7%)
- Carpooled: 354 (7.6%)
- Bus or trolley bus: 14 (0.3%)
- Subway or elevated: 30 (0.6%)
- Railroad: 695 (14.8%)
- Taxi: 5 (0.1%)
- Bicycle: 6 (0.1%)
- Walked: 110 (2.3%)
- Other means: 38 (0.8%)
- Worked at home: 263 (5.6%)
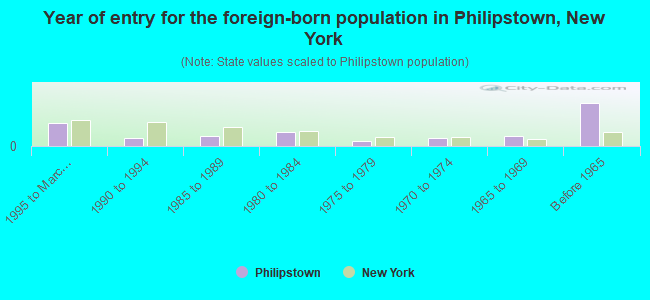
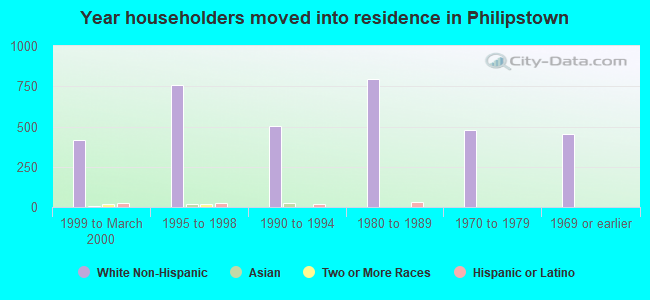
- Year of entry for the foreign-born population in Philipstown, New York
- 1631995 to March 2000
- 581990 to 1994
- 731985 to 1989
- 991980 to 1984
- 381975 to 1979
- 551970 to 1974
- 731965 to 1969
- 297Before 1965
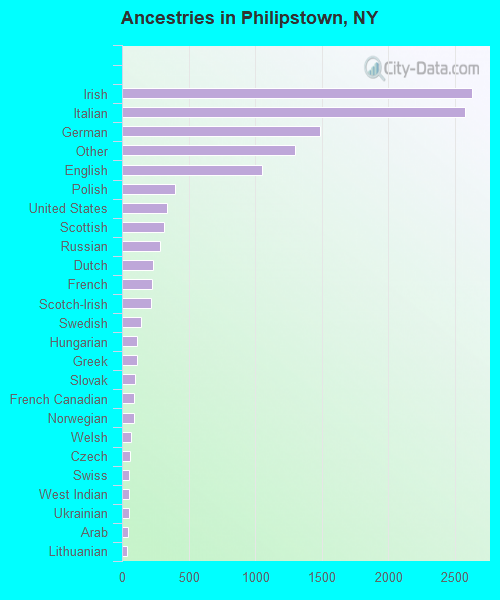
First ancestries reported:
- Irish: 2,625 (21.7%)
- Italian: 2,573 (21.2%)
- German: 1,489 (12.3%)
- Other: 1,301 (10.7%)
- English: 1,051 (8.7%)
- Polish: 396 (3.3%)
- United States: 340 (2.8%)
- Scottish: 319 (2.6%)
- Russian: 287 (2.4%)
- Dutch: 231 (1.9%)
- French: 228 (1.9%)
- Scotch-Irish: 217 (1.8%)
- Swedish: 146 (1.2%)
- Hungarian: 116 (1.0%)
- Greek: 111 (0.9%)
- Slovak: 95 (0.8%)
- French Canadian: 91 (0.8%)
- Norwegian: 87 (0.7%)
- Welsh: 70 (0.6%)
- Czech: 63 (0.5%)
- Swiss: 55 (0.5%)
- West Indian: 54 (0.4%)
- Ukrainian: 51 (0.4%)
- Arab: 44 (0.4%)
- Lithuanian: 36 (0.3%)
- Danish: 22 (0.2%)
- Portuguese: 20 (0.2%)
- Subsaharan African: 6 (0.05%)
Most common places of birth for foreign-born residents (%):
| Philipstown: | 12.7% (109) |
| New York: | 3.8% (147,729) |
| Philipstown: | 8.9% (76) |
| New York: | 6.0% (233,766) |
| Philipstown: | 6.5% (56) |
| New York: | 1.8% (69,327) |
| Philipstown: | 5.7% (49) |
| New York: | 0.3% (10,672) |
| Philipstown: | 5.4% (46) |
| New York: | 1.1% (41,934) |
| Philipstown: | 5.0% (43) |
| New York: | 1.4% (54,876) |
| Philipstown: | 4.4% (38) |
| New York: | 1.6% (62,237) |
| Philipstown: | 4.2% (36) |
| New York: | 2.5% (98,473) |
| Philipstown: | 4.0% (34) |
| New York: | 2.4% (94,595) |
| Philipstown: | 3.6% (31) |
| New York: | 3.6% (139,226) |
| Philipstown: | 3.0% (26) |
| New York: | 0.1% (4,305) |
| Philipstown: | 3.0% (26) |
| New York: | 0.2% (6,545) |
| Philipstown: | 2.5% (21) |
| New York: | 0.5% (20,310) |
| Philipstown: | 2.1% (18) |
| New York: | 2.4% (93,187) |
| Philipstown: | 2.0% (17) |
| New York: | 1.1% (42,335) |
| Philipstown: | 2.0% (17) |
| New York: | 0.6% (23,797) |
| Philipstown: | 1.9% (16) |
| New York: | 0.4% (16,228) |
| Philipstown: | 1.9% (16) |
| New York: | 1.9% (72,408) |
| Philipstown: | 1.6% (14) |
| New York: | 2.0% (76,977) |
| Philipstown: | 1.5% (13) |
| New York: | 0.3% (13,246) |
| Philipstown: | 1.5% (13) |
| New York: | 0.6% (25,059) |
Place of birth for U.S.-born residents:
- This state: 6,996
- Other state: 1,482
- Northeast: 637
- Midwest: 355
- South: 304
- West: 186
68% of Philipstown residents lived in the same house 5 years ago.
Out of people who lived in different houses, 32% lived in this county.
Out of people who lived in different counties, 82% lived in New York.
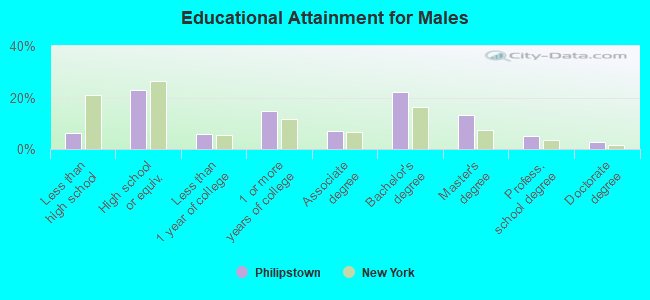
Education attainment for males 25 years and older:
- No schooling: 9
- Nursery to 4th grade: 0
- 5th and 6th grade: 18
- 7th and 8th grade: 42
- 9th grade: 28
- 10th grade: 54
- 11th grade: 17
- 12th grade, no diploma: 34
- High school graduate (or equivalency): 742
- Less than 1 year of college: 188
- Some college more than 1 year, no degree: 476
- Associate degree: 233
- Bachelor's degree: 720
- Master's degree: 430
- Professional school degree: 169
- Doctorate degree: 84
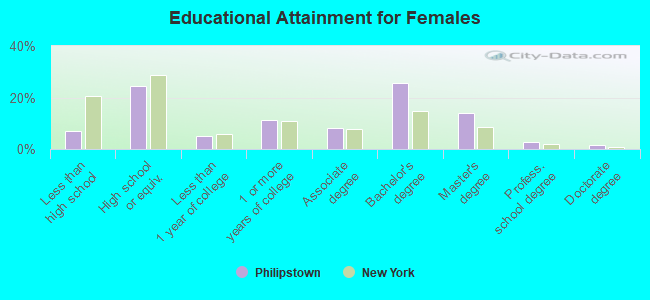
Education attainment for females 25 years and older:
- No schooling: 10
- Nursery to 4th grade: 6
- 5th and 6th grade: 2
- 7th and 8th grade: 54
- 9th grade: 16
- 10th grade: 61
- 11th grade: 33
- 12th grade, no diploma: 62
- High school graduate (or equivalency): 854
- Less than 1 year of college: 180
- Some college more than 1 year, no degree: 398
- Associate degree: 283
- Bachelor's degree: 891
- Master's degree: 484
- Professional school degree: 98
- Doctorate degree: 57
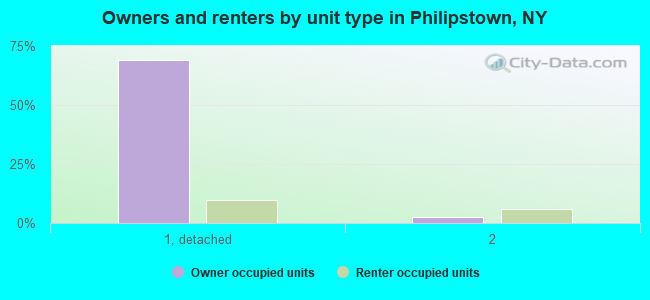
Housing units in structures:
- One, detached: 3,159
- One, attached: 117
- Two: 316
- 3 or 4: 123
- 5 to 9: 72
- 10 to 19: 51
- 20 to 49: 9
- 50 or more: 38
- Mobile homes: 98
Housing units lacking complete kitchen facilities: 1.0%
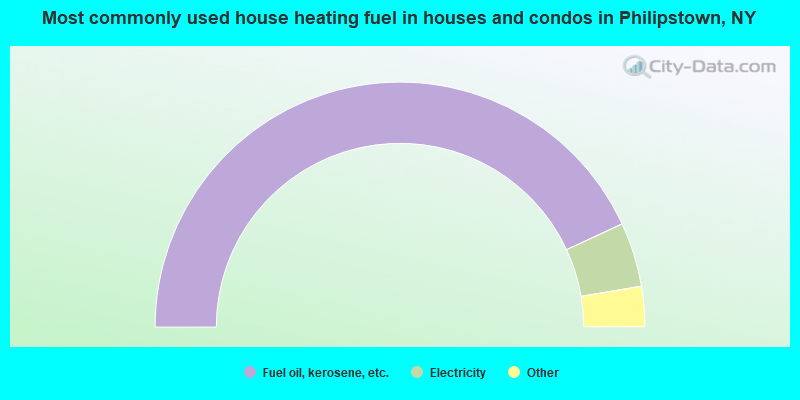
- 86.2%Fuel oil, kerosene, etc.
- 8.5%Electricity
- 3.3%Bottled, tank, or LP gas
- 1.2%Wood
- 0.5%Utility gas
- 0.2%Coal or coke
- 0.2%Solar energy
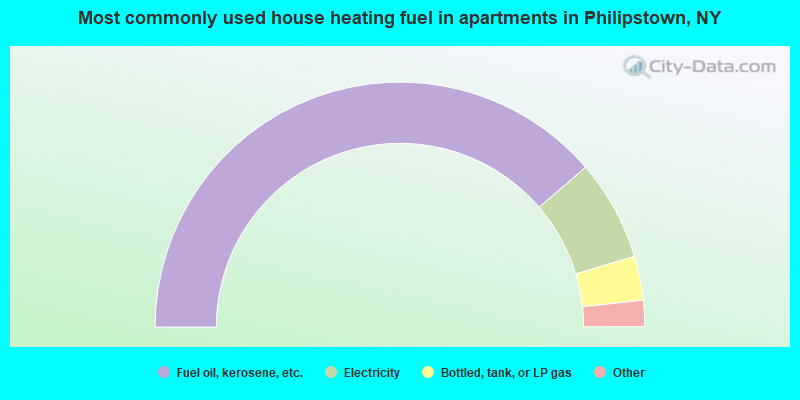
- 77.4%Fuel oil, kerosene, etc.
- 13.3%Electricity
- 5.8%Bottled, tank, or LP gas
- 2.6%Wood
- 0.9%Utility gas
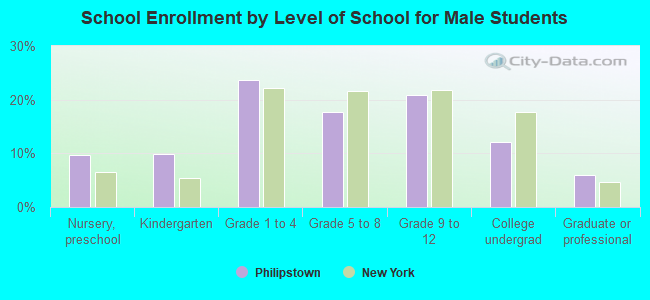
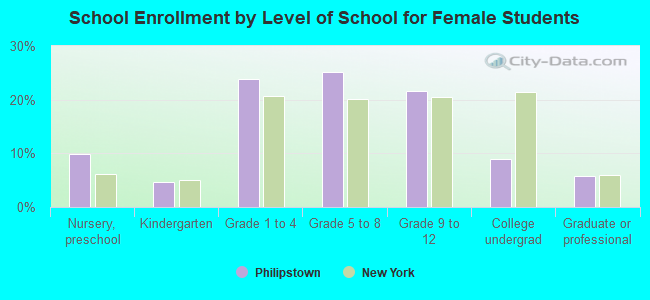
Private vs. public school enrollment:
| Here: | 9.5% |
| New York: | 14.0% |
| Here: | 13.1% |
| New York: | 13.2% |
| Here: | 47.5% |
| New York: | 38.2% |