Piedmont, CA (California) Houses and Residents
| Piedmont: | $2,186,750 |
| California: | $715,900 |
Total population: 11,236 (Urban population: 10,952, Rural population: 0)
Houses: 4,012 (3,855 occupied: 3,424 owner occupied, 433 renter occupied)
| % of renters here: | 11% |
| State: | 44% |
Housing density: 2,377 houses/condos per square mile
Median price asked for vacant for-sale houses and condos in 2022 in this county: $1,043,180.
Median contract rent in 2022: over $2,000
Median rent asked for vacant for-rent units in 2022: $4,172
Median gross rent in Piedmont, CA in 2022: over $2,000
Housing units in Piedmont with a mortgage: 2,247 (273 second mortgage, 0 home equity loan, 240 both second mortgage and home equity loan)
Houses without a mortgage: 42
Median household income for houses/condos with a mortgage: $262,173
Median household income for apartments without a mortgage: $239,817
Median monthly housing costs: $3,934
Compare current foreclosures near Piedmont, CA:
| Photo | Address | Area | Beds / Baths | Price | Details |
|---|---|---|---|---|---|

|
#1
Macarthur Blvd
Oakland, CA 94605
|
1,313 sq. feet
|
3 baths 3 beds |
$599,000
|
show details |

|
#2
2nd St
Richmond, CA 94801
|
887 sq. feet
|
1 baths 3 beds |
$364,000
|
show details |

|
#3
Kelsey St
Richmond, CA 94801
|
1,080 sq. feet
|
3 baths 4 beds |
show details | |

|
#4
Wickman Pl
San Lorenzo, CA 94580
|
900 sq. feet
|
1 baths 2 beds |
show details | |

|
#5
Mohr Ln Apt C
Concord, CA 94518
|
870 sq. feet
|
1 baths 2 beds |
show details | |

|
#6
El Portal Dr Apt D
San Pablo, CA 94806
|
1,058 sq. feet
|
2 baths 2 beds |
show details | |

|
#7
21st St
San Pablo, CA 94806
|
1,665 sq. feet
|
2 baths 3 beds |
show details | |

|
#8
Ritchie St
Oakland, CA 94605
|
2,208 sq. feet
|
2 baths 3 beds |
show details | |

|
#9
Lobos St
San Francisco, CA 94112
|
750 sq. feet
|
1 baths 2 beds |
show details | |

|
#10
Los Angeles St
Emeryville, CA 94608
|
803 sq. feet
|
1 baths 2 beds |
show details |
| Photo | Address | Area | Beds / Baths | Price | Details |
|---|---|---|---|---|---|

|
#11
Byxbee St
San Francisco, CA 94132
|
800 sq. feet
|
1 baths 1 beds |
show details | |

|
#12
Harkness Ave
San Francisco, CA 94134
|
1,412 sq. feet
|
2 baths 3 beds |
show details | |

|
#13
Minerva St
San Francisco, CA 94112
|
878 sq. feet
|
1 baths 2 beds |
show details | |

|
#14
Bolla Ave
Alamo, CA 94507
|
4,658 sq. feet
|
4 baths 4 beds |
show details | |

|
#15
106th Ave
Oakland, CA 94603
|
1,961 sq. feet
|
2 baths 3 beds |
show details | |

|
#16
Leslie Ave
Martinez, CA 94553
|
1,006 sq. feet
|
1 baths 2 beds |
show details | |

|
#17
Leslie Ave
Martinez, CA 94553
|
1,006 sq. feet
|
1 baths 2 beds |
show details | |

|
#18
Somerset Ave
Castro Valley, CA 94546
|
1,630 sq. feet
|
1 baths 3 beds |
show details | |

|
#19
Fairway Ave
Oakland, CA 94605
|
1,432 sq. feet
|
1 baths 2 beds |
show details | |

|
#20
Davis St
Oakland, CA 94601
|
1,408 sq. feet
|
2 baths 3 beds |
show details |
| Photo | Address | Area | Beds / Baths | Price | Details |
|---|---|---|---|---|---|

|
#21
Holloway Ave
San Francisco, CA 94132
|
1,110 sq. feet
|
5 baths 1 beds |
show details | |

|
#22
31st Ave
San Francisco, CA 94116
|
1,115 sq. feet
|
1 baths 2 beds |
show details | |

|
#23
Garfield St
San Francisco, CA 94132
|
1,355 sq. feet
|
1 baths 3 beds |
show details | |

|
#24
Coolidge Ave
Oakland, CA 94601
|
2,016 sq. feet
|
2 baths 3 beds |
show details | |

|
#25
Vale Rd Apt 35
San Pablo, CA 94806
|
1,858 sq. feet
|
3 baths 3 beds |
show details | |

|
#26
Lorenzo Ave
San Lorenzo, CA 94580
|
1,937 sq. feet
|
1 baths 3 beds |
show details | |

|
#27
Carberry Ave
Oakland, CA 94609
|
2,832 sq. feet
|
3 baths 4 beds |
show details | |

|
#28
Aspenwood Ct
Concord, CA 94521
|
3,161 sq. feet
|
3 baths 4 beds |
show details | |

|
#29
Duperu Dr
Crockett, CA 94525
|
2,476 sq. feet
|
3 baths 4 beds |
show details | |

|
#30
Hollister Ave
San Francisco, CA 94124
|
1,000 sq. feet
|
3 baths 5 beds |
show details |
| Photo | Address | Area | Beds / Baths | Price | Details |
|---|---|---|---|---|---|

|
#31
Caldecott Ln Unit 312
Oakland, CA 94618
|
1,095 sq. feet
|
2 baths 2 beds |
show details | |

|
#32
Vaqueros Ave
Rodeo, CA 94572
|
935 sq. feet
|
2 baths 3 beds |
show details | |

|
#33
Highland Dr
Concord, CA 94520
|
1,188 sq. feet
|
2 baths 3 beds |
show details | |

|
#34
Jane Ct
Martinez, CA 94553
|
1,121 sq. feet
|
2 baths 3 beds |
show details | |

|
#35
Santa Maria Ave
Castro Valley, CA 94546
|
1,176 sq. feet
|
1 baths 3 beds |
show details | |

|
#36
Olima St
Sausalito, CA 94965
|
- sq. feet
|
2 baths 4 beds |
show details | |

|
#37
Tribune Ave
Hayward, CA 94542
|
2,234 sq. feet
|
2 baths 4 beds |
show details | |

|
#38
F St
Oakland, CA 94603
|
842 sq. feet
|
1 baths 2 beds |
show details | |

|
#39
Madera Ct
Danville, CA 94526
|
2,344 sq. feet
|
3 baths 4 beds |
show details | |

|
#40
Joyce St
Hayward, CA 94544
|
1,000 sq. feet
|
1 baths 3 beds |
show details |
| Photo | Address | Area | Beds / Baths | Price | Details |
|---|---|---|---|---|---|

|
#41
Raymond Ave
San Francisco, CA 94134
|
975 sq. feet
|
1 baths 3 beds |
show details | |

|
#42
El Dorado Ave
Berkeley, CA 94707
|
2,370 sq. feet
|
2 baths 4 beds |
show details | |

|
#43
Balboa St
San Francisco, CA 94118
|
2,410 sq. feet
|
1 baths 3 beds |
show details | |

|
#44
Weld St
Oakland, CA 94621
|
9,160 sq. feet
|
1 baths 2 beds |
show details | |

|
#45
Oakdale Ave
Oakland, CA 94605
|
2,020 sq. feet
|
3 baths 3 beds |
show details | |

|
#46
Diablo Ct
Danville, CA 94526
|
2,971 sq. feet
|
2 baths 4 beds |
show details | |

|
#47
Madrid St
San Francisco, CA 94112
|
1,018 sq. feet
|
1 baths 4 beds |
show details | |

|
#48
Cedar Ct
Daly City, CA 94014
|
1,200 sq. feet
|
2 baths 3 beds |
show details | |

|
#49
3rd St
Hayward, CA 94541
|
1,324 sq. feet
|
1 baths 2 beds |
show details | |

|
Check over 1 million property listings on Foreclosure.com!
|
browse all offers | |||

Latest news about housing in Piedmont, CA collected exclusively by city-data.com from local newspapers, TV, and radio stations


Median year apartment built: 1938
Household type by relationship:
Households: 10,927- Male householders: 1,866 (181 living alone), Female householders: 1,843 (407 living alone)
2,733 spouses (2,733 opposite-sex spouses), 159 unmarried partners, (101 opposite-sex unmarried partners), 3,607 children (3,482 natural, 85 adopted, 40 stepchildren), 90 grandchildren, 22 brothers or sisters, 187 parents, 0 foster children, 137 other relatives, 274 non-relatives
- In group quarters: 4
Size of family households: 1,125 2-persons, 645 3-persons, 908 4-persons, 258 5-persons, 56 6-persons, 23 7-or-more-persons.
Size of nonfamily households: 621 1-person, 107 2-persons, 56 3-persons.
2,548 married couples with children.
244 single-parent households (73 men, 171 women).
85.0% of residents of Piedmont speak English at home.
2.0% of residents speak Spanish at home (86% speak English very well, 14% speak English well).
4.8% of residents speak other Indo-European language at home (97% speak English very well, 3% speak English well).
9.6% of residents speak Asian or Pacific Island language at home (70% speak English very well, 19% speak English well, 6% speak English not well, 5% don't speak English at all).
Foreign born population: 1,387 (12.7%)
(78.4% of them are naturalized citizens)
| Here: | 8.0 |
| State: | 6.0 |
| Here: | 6.9 |
| State: | 3.9 |
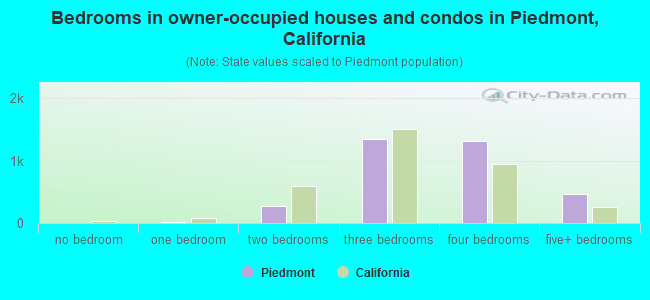
- Bedrooms in owner-occupied houses and condos in Piedmont, California
- 0no bedroom
- 151 bedroom
- 2662 bedrooms
- 1,3493 bedrooms
- 1,3234 bedrooms
- 4725+ bedrooms
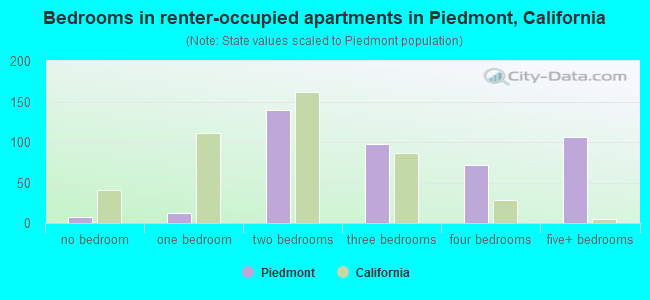
- Bedrooms in renter-occupied apartments in Piedmont, California
- 8no bedroom
- 121 bedroom
- 1392 bedrooms
- 973 bedrooms
- 724 bedrooms
- 1065+ bedrooms
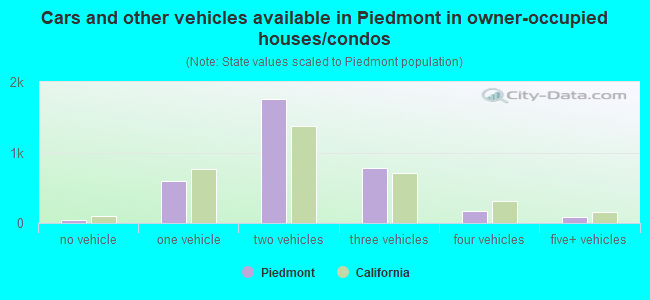
- Cars and other vehicles available in Piedmont in owner-occupied houses/condos
- 44no vehicle
- 5901 vehicle
- 1,7632 vehicles
- 7803 vehicles
- 1654 vehicles
- 845+ vehicles
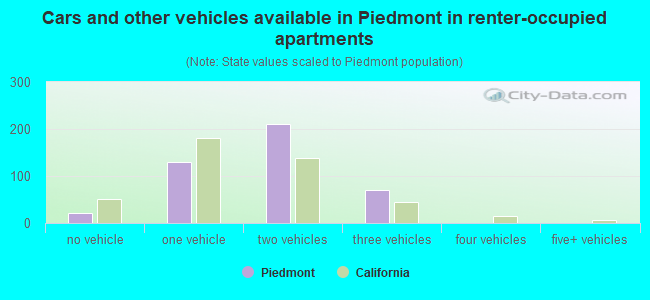
- Cars and other vehicles available in Piedmont in renter-occupied apartments
- 22no vehicle
- 1301 vehicle
- 2102 vehicles
- 713 vehicles
- 04 vehicles
- 05+ vehicles
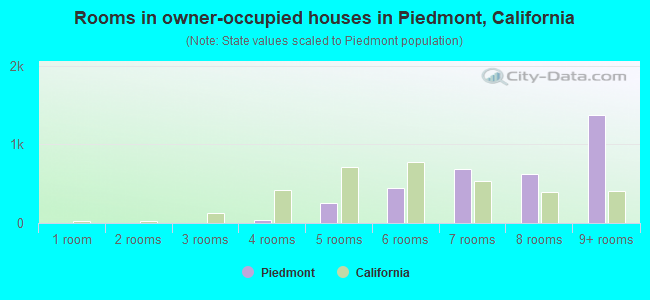
- Rooms in owner-occupied houses in Piedmont, California
- 01 room
- 02 rooms
- 03 rooms
- 414 rooms
- 2525 rooms
- 4466 rooms
- 6907 rooms
- 6228 rooms
- 1,3749+ rooms
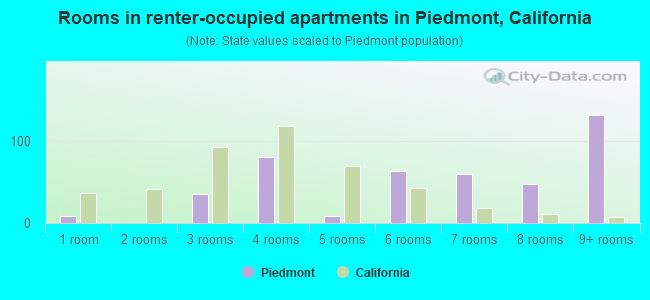
- Rooms in renter-occupied apartments in Piedmont, California
- 81 room
- 02 rooms
- 353 rooms
- 804 rooms
- 95 rooms
- 636 rooms
- 607 rooms
- 478 rooms
- 1319+ rooms
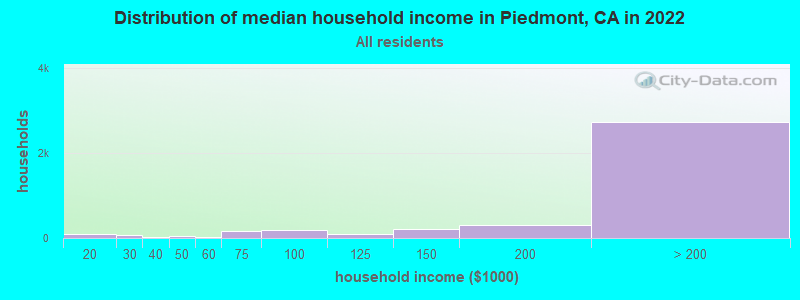
Piedmont, CA household income distribution

- 21Less than $10,000
- 94$10,000 to $19,999
- 60$20,000 to $29,999
- 26$30,000 to $39,999
- 36$40,000 to $49,999
- 16$50,000 to $59,999
- 158$60,000 to $74,999
- 180$75,000 to $99,999
- 103$100,000 to $124,999
- 211$125,000 to $149,999
- 295$150,000 to $199,999
- 2,730$200,000 or more
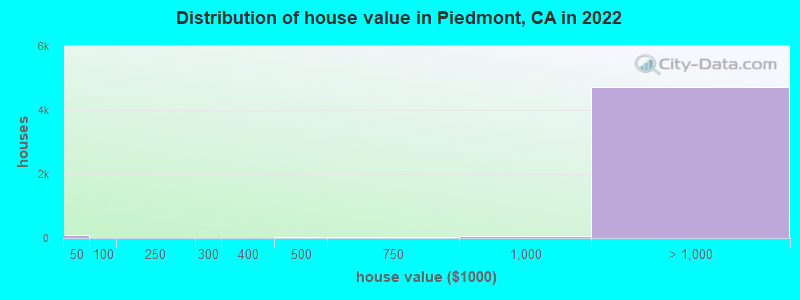
Home value of owner - occupied houses in 2022 in Piedmont, CA
-
- 77Less than $10,000
- 17$25,000 to $29,999
- 8$40,000 to $49,999
- 14$250,000 to $299,999
- 33$400,000 to $499,999
- 33$500,000 to $749,999
- 63$750,000 to $999,999
- 245$1,000,000 to $1,499,999
- 756$1,500,000 to $1,999,999
- 3,726$2,000,000 or more
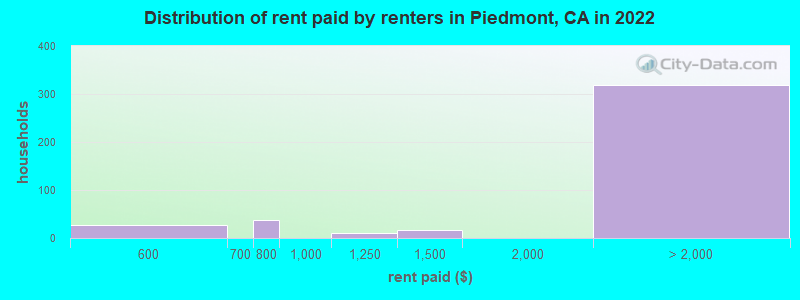
Rent paid by renters in 2022 in Piedmont, CA
-
- 27$500 to $549
- 37$750 to $799
- 9$1,000 to $1,249
- 15$1,250 to $1,499
- 19$2,000 to $2,499
- 63$3,000 to $3,499
- 191$3,500 or more
- 44No cash rent
Percentage of workers working in this county: 73.0%
Number of people working at home: 2,284 (44.6% of all workers)
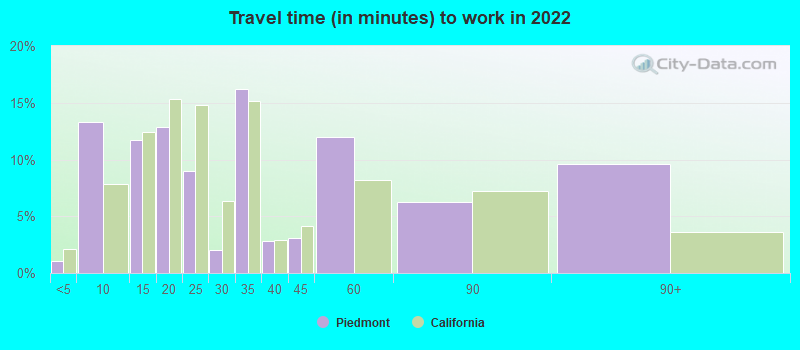
Travel time to work (commute)
- Less than 5 minutes: 32
- 5 to 9 minutes: 265
- 10 to 14 minutes: 354
- 15 to 19 minutes: 599
- 20 to 24 minutes: 275
- 25 to 29 minutes: 293
- 30 to 34 minutes: 497
- 35 to 39 minutes: 104
- 40 to 44 minutes: 177
- 45 to 59 minutes: 289
- 60 to 89 minutes: 208
- 90 or more minutes: 58
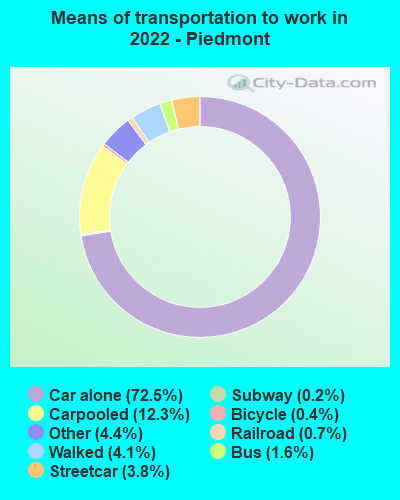
Means of transportation to work:
- Drove a car alone: 1,683 (39.6%)
- Carpooled: 300 (7.1%)
- Bus: 31 (0.7%)
- Subway or elevated rail: 68 (1.6%)
- Long-distance train or commuter rail: 4 (0.1%)
- Light rail, streetcar or trolley: 12 (0.3%)
- Taxi: 107 (2.5%)
- Bicycle: 10 (0.2%)
- Walked: 95 (2.2%)
- Worked at home: 2,284 (53.7%)
- Unemployment by race in 2022
- Unemployment rate for White non-Hispanic residents
- 5.5%Males
- 1.1%Females
- Unemployment rate for Asian residents
- 0.9%Males
- 3.5%Females
- Unemployment rate for Hispanic or Latino residents
- 8.6%Females
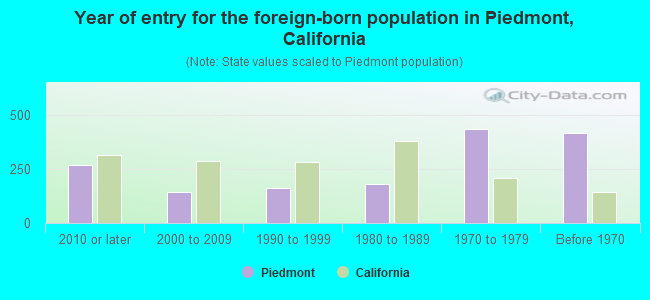
- Year of entry for the foreign-born population in Piedmont, California
- 2682010 or later
- 1452000 to 2009
- 1631990 to 1999
- 1821980 to 1989
- 4341970 to 1979
- 416Before 1970
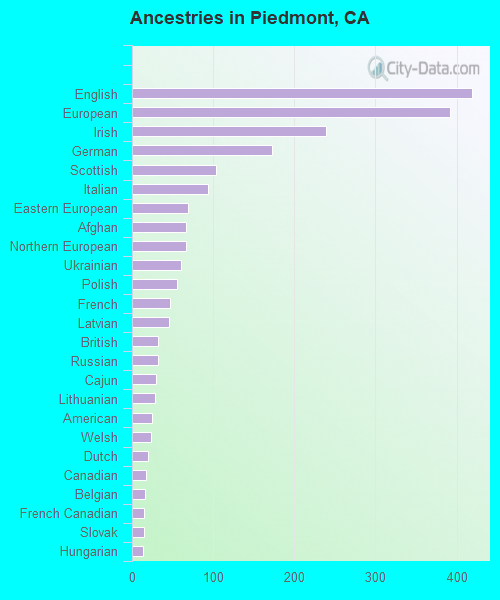
First ancestries reported:
- English: 419 (9.1%)
- European: 392 (8.5%)
- Irish: 239 (5.2%)
- German: 173 (3.8%)
- Scottish: 103 (2.2%)
- Italian: 94 (2.0%)
- Eastern European: 69 (1.5%)
- Afghan: 66 (1.4%)
- Northern European: 66 (1.4%)
- Ukrainian: 61 (1.3%)
- Polish: 55 (1.2%)
- French: 47 (1.0%)
- Latvian: 46 (1.0%)
- British: 32 (0.7%)
- Russian: 32 (0.7%)
- Cajun: 29 (0.6%)
- Lithuanian: 28 (0.6%)
- American: 25 (0.5%)
- Welsh: 23 (0.5%)
- Dutch: 20 (0.4%)
- Canadian: 17 (0.4%)
- Belgian: 16 (0.3%)
- French Canadian: 15 (0.3%)
- Slovak: 15 (0.3%)
- Hungarian: 13 (0.3%)
- Bahamian: 13 (0.3%)
- Swedish: 12 (0.3%)
- Finnish: 11 (0.2%)
- Basque: 9 (0.2%)
- Czech: 8 (0.2%)
- Yugoslavian: 8 (0.2%)
Most common places of birth for foreign-born residents (%):
| Piedmont: | 19.3% (268) |
| California: | 6.6% (684,672) |
| Piedmont: | 8.7% (120) |
| California: | 1.2% (127,477) |
| Piedmont: | 7.8% (108) |
| California: | 1.0% (105,215) |
| Piedmont: | 7.5% (104) |
| California: | 0.4% (40,224) |
| Piedmont: | 6.6% (91) |
| California: | 1.7% (176,274) |
| Piedmont: | 6.5% (90) |
| California: | 3.0% (315,248) |
| Piedmont: | 5.6% (78) |
| California: | 0.5% (53,260) |
| Piedmont: | 5.3% (74) |
| California: | 0.6% (60,761) |
| Piedmont: | 3.9% (54) |
| California: | 4.9% (512,335) |
| Piedmont: | 3.7% (51) |
| California: | 0.6% (57,953) |
| Piedmont: | 3.6% (50) |
| California: | 7.8% (818,297) |
| Piedmont: | 3.5% (49) |
| California: | 0.4% (39,097) |
| Piedmont: | 3.2% (45) |
| California: | 1.0% (103,575) |
| Piedmont: | 2.9% (40) |
| California: | 5.2% (539,184) |
| Piedmont: | 2.5% (35) |
| California: | 0.7% (73,304) |
| Piedmont: | 2.4% (33) |
| California: | 0.3% (33,029) |
| Piedmont: | 1.7% (23) |
| California: | 0.2% (16,998) |
| Piedmont: | 1.6% (22) |
| California: | 0.6% (60,582) |
| Piedmont: | 1.5% (21) |
| California: | 0.2% (23,338) |
Place of birth for U.S.-born residents:
- This state: 5,763
- Other state: 3,572
- Northeast: 1,215
- Midwest: 987
- South: 805
- West: 577
89.6% of Piedmont residents lived in the same house 1 years ago.
Out of people who lived in different houses, 30.7% lived in this county.
Out of people who lived in different counties, 63.8% lived in California.
| Piedmont: | 89.6% |
| State average: | 88.9% |
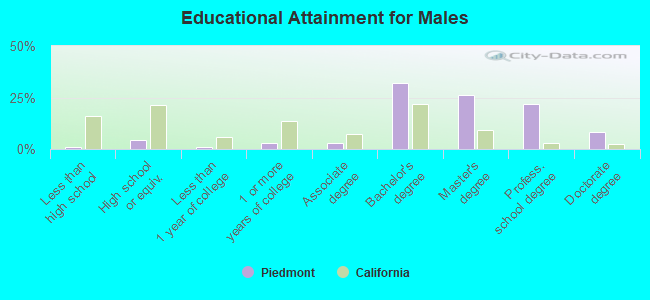
Education attainment for males 25 years and older:
- No schooling: 0
- Nursery to 4th grade: 30
- 5th and 6th grade: 0
- 7th and 8th grade: 0
- 9th grade: 0
- 10th grade: 0
- 11th grade: 0
- 12th grade, no diploma: 0
- High school graduate (or equivalency): 167
- Less than 1 year of college: 38
- Some college more than 1 year, no degree: 121
- Associate degree: 104
- Bachelor's degree: 1,237
- Master's degree: 1,006
- Professional school degree: 847
- Doctorate degree: 317
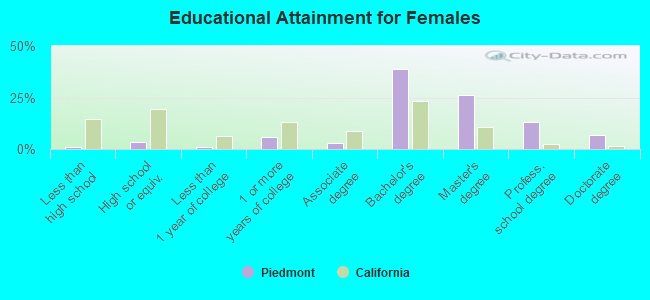
Education attainment for females 25 years and older:
- No schooling: 0
- Nursery to 4th grade: 0
- 5th and 6th grade: 0
- 7th and 8th grade: 30
- 9th grade: 0
- 10th grade: 0
- 11th grade: 0
- 12th grade, no diploma: 18
- High school graduate (or equivalency): 136
- Less than 1 year of college: 47
- Some college more than 1 year, no degree: 243
- Associate degree: 127
- Bachelor's degree: 1,568
- Master's degree: 1,052
- Professional school degree: 528
- Doctorate degree: 279


Housing units in structures:
- One, detached: 3,810
- One, attached: 38
- Two: 99
- 3 or 4: 40
- 20 to 49: 4
- Mobile homes: 19
Housing units lacking complete kitchen facilities in 2022: 0.8%
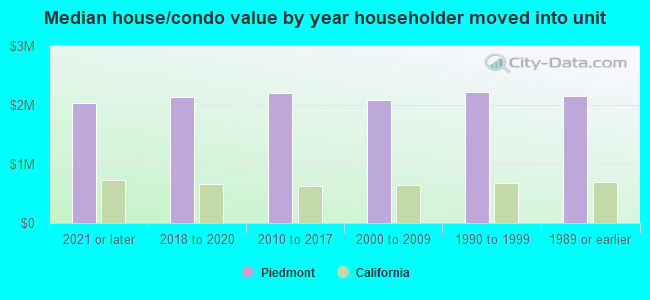
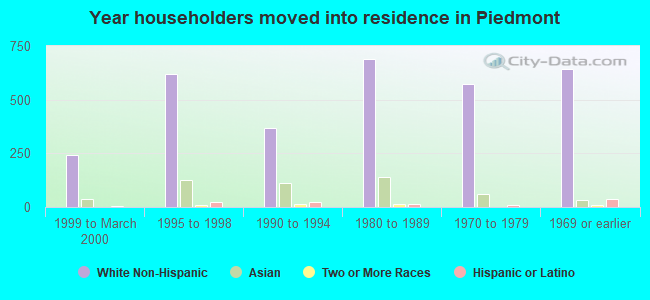
House/condo owner moved in on average 16 years ago
Renter moved in on average 3 years ago
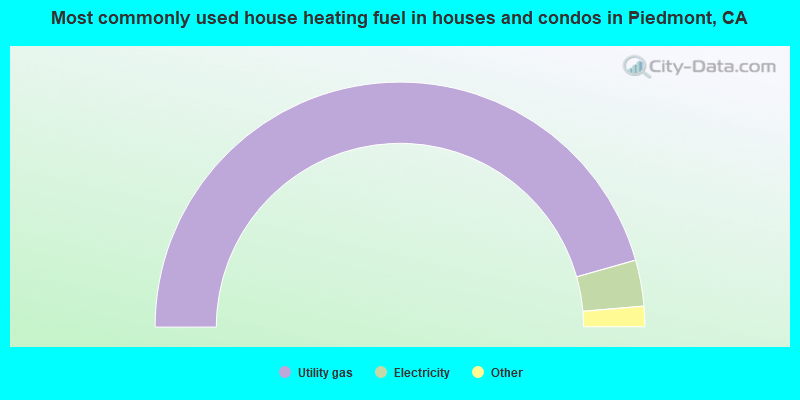
- 91.3%Utility gas
- 6.1%Electricity
- 1.7%Bottled, tank, or LP gas
- 0.5%No fuel used
- 0.3%Wood
- 0.2%Solar energy
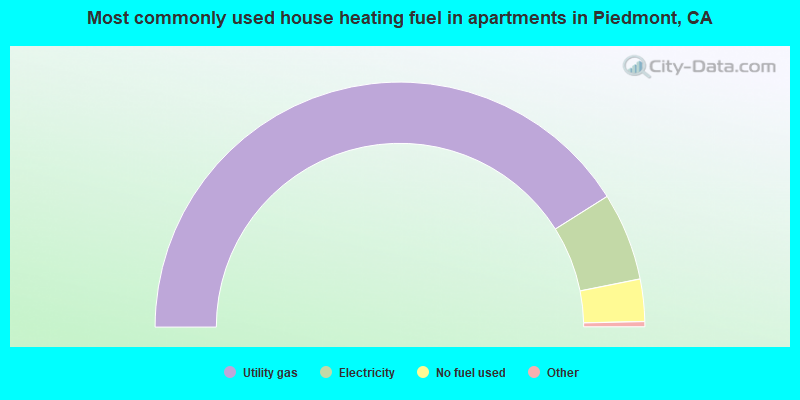
- 82.6%Utility gas
- 11.7%Electricity
- 5.6%No fuel used
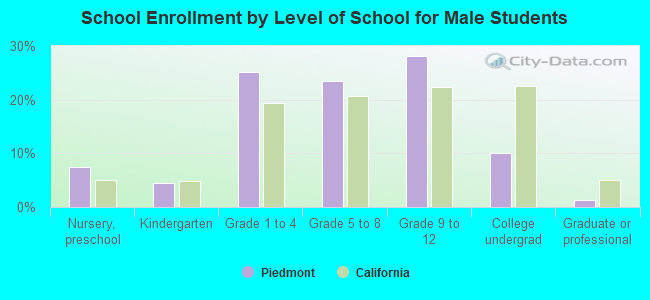
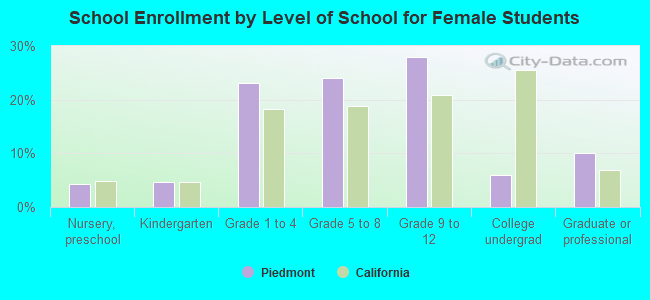
Private vs. public school enrollment:
| Here: | 1.7% |
| California: | 10.5% |
| Here: | 11.8% |
| California: | 8.5% |
| Here: | 30.8% |
| California: | 15.9% |