Pike Road, AL (Alabama) Houses and Residents
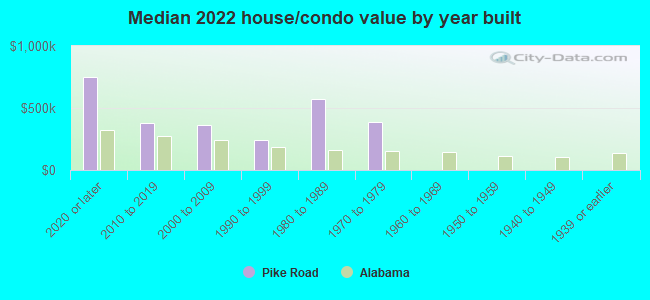
| Pike Road: | $392,610 |
| Alabama: | $200,900 |
Mean price in 2022:
Detached houses: $438,426
Here: $438,426 State: $273,076 Mobile homes: $325,272
Here: $325,272 State: $77,780
Total population: 7,933 (Urban population: 0, Rural population: 243 (19 farm, 224 nonfarm))
Houses: 3,537 (3,253 occupied: 2,765 owner occupied, 495 renter occupied)
| % of renters here: | 15% |
| State: | 30% |
Housing density: 955 houses/condos per square mile
Median price asked for vacant for-sale houses and condos in 2022: $1,077,589.
Median contract rent in 2022: $1,318 (lower quartile is $1,280, upper quartile is $1,392)
Median rent asked for vacant for-rent units in 2022: $1,400
Median gross rent in Pike Road, AL in 2022: $1,389
Housing units in Pike Road with a mortgage: 2,269 (163 second mortgage, 19 home equity loan, 142 both second mortgage and home equity loan)
Houses without a mortgage: 24
Median household income for houses/condos with a mortgage: $119,467
Median household income for apartments without a mortgage: $134,216
Median monthly housing costs: $1,502
Compare current foreclosures in Pike Road, AL:
| Photo | Address | Area | Beds / Baths | Price | Details |
|---|---|---|---|---|---|

|
#1
Stableway Rd
Pike Road, AL 36064
|
1,707 sq. feet
|
- baths 3 beds |
show details | |

|
#2
Old Carter Hill Rd
Pike Road, AL 36064
|
1,134 sq. feet
|
- baths 4 beds |
show details | |

|
#3
S Onyx Ct
Pike Road, AL 36064
|
- sq. feet
|
- baths - beds |
show details | |

|
#4
Kingston Dr
Pike Road, AL 36064
|
- sq. feet
|
- baths - beds |
show details | |

|
#5
Saw Tooth Loop
Pike Road, AL 36064
|
- sq. feet
|
- baths - beds |
show details | |

|
#6
Emerald Dr
Pike Road, AL 36064
|
- sq. feet
|
- baths - beds |
show details | |

|
#7
Stone Park Blvd Apt 507
Pike Road, AL 36064
|
- sq. feet
|
- baths - beds |
show details | |

|
#8
Baxter Rd
Pike Road, AL 36064
|
- sq. feet
|
- baths - beds |
show details | |

|
#9
Saw Tooth Loop
Pike Road, AL 36064
|
- sq. feet
|
- baths - beds |
show details | |

|
#10
Stone Park Blvd Apt 609
Pike Road, AL 36064
|
- sq. feet
|
- baths - beds |
show details |
| Photo | Address | Area | Beds / Baths | Price | Details |
|---|---|---|---|---|---|

|
#11
Queen Williams Rd
Pike Road, AL 36064
|
1,125 sq. feet
|
- baths - beds |
show details | |

|
#12
Grace Chapel Trl
Pike Road, AL 36064
|
- sq. feet
|
- baths - beds |
show details | |

|
#13
Stone Park Blvd Apt 2314
Pike Road, AL 36064
|
- sq. feet
|
- baths - beds |
show details | |

|
#14
Penn Rd
Pike Road, AL 36064
|
- sq. feet
|
- baths - beds |
show details | |

|
#15
Stone Park Blvd Apt 1613
Pike Road, AL 36064
|
- sq. feet
|
- baths - beds |
show details | |

|
#16
Alexander Rd
Pike Road, AL 36064
|
- sq. feet
|
- baths - beds |
show details | |

|
#17
Shell Stone Ct
Pike Road, AL 36064
|
- sq. feet
|
- baths - beds |
show details | |

|
#18
Avenue Of The Orchards
Pike Road, AL 36064
|
- sq. feet
|
- baths - beds |
show details | |

|
#19
Vaughn Rd
Pike Road, AL 36064
|
1,092 sq. feet
|
- baths - beds |
show details | |

|
#20
Stone Park Blvd Apt 606
Pike Road, AL 36064
|
- sq. feet
|
- baths - beds |
show details |
| Photo | Address | Area | Beds / Baths | Price | Details |
|---|---|---|---|---|---|

|
#21
Stone Park Blvd Apt 114
Pike Road, AL 36064
|
- sq. feet
|
- baths - beds |
show details | |

|
#22
Stone Park Blvd Apt 1101
Pike Road, AL 36064
|
- sq. feet
|
- baths - beds |
show details | |

|
#23
Cedar Ln
Pike Road, AL 36064
|
- sq. feet
|
- baths - beds |
show details | |

|
#24
S Charleson Xing
Pike Road, AL 36064
|
- sq. feet
|
- baths - beds |
show details | |

|
#25
Shell Stone Ct
Pike Road, AL 36064
|
- sq. feet
|
- baths - beds |
show details | |

|
#26
Melison Dr
Pike Road, AL 36064
|
- sq. feet
|
- baths - beds |
show details | |

|
#27
Boulder Dr
Pike Road, AL 36064
|
- sq. feet
|
- baths - beds |
show details | |

|
#28
Bridlebrook Blvd
Pike Road, AL 36064
|
1,804 sq. feet
|
- baths - beds |
show details | |

|
#29
Grace Chapel Trl
Pike Road, AL 36064
|
- sq. feet
|
- baths - beds |
show details | |

|
#30
Stone Park Blvd
Pike Road, AL 36064
|
- sq. feet
|
- baths - beds |
show details |
| Photo | Address | Area | Beds / Baths | Price | Details |
|---|---|---|---|---|---|

|
#31
Alexander Rd
Pike Road, AL 36064
|
1,796 sq. feet
|
- baths - beds |
show details | |

|
#32
Foxchase Dr
Pike Road, AL 36064
|
- sq. feet
|
- baths - beds |
show details | |

|
#33
Cantera Way
Pike Road, AL 36064
|
- sq. feet
|
- baths - beds |
show details | |

|
#34
Boykin Lakes Loop
Pike Road, AL 36064
|
- sq. feet
|
- baths - beds |
show details | |

|
#35
Vaughn Crossing Rd
Pike Road, AL 36064
|
- sq. feet
|
- baths - beds |
show details | |

|
#36
Fierness Trl
Pike Road, AL 36064
|
- sq. feet
|
- baths - beds |
show details | |

|
#37
Deer Path
Pike Road, AL 36064
|
1,406 sq. feet
|
- baths - beds |
show details | |

|
#38
Kingston Dr
Pike Road, AL 36064
|
1,560 sq. feet
|
- baths - beds |
show details | |

|
#39
Boykin Lakes Loop
Pike Road, AL 36064
|
- sq. feet
|
- baths - beds |
show details | |

|
#40
Stone Park Blvd
Pike Road, AL 36064
|
- sq. feet
|
- baths - beds |
show details |
| Photo | Address | Area | Beds / Baths | Price | Details |
|---|---|---|---|---|---|

|
#41
Saint Martins Ct
Pike Road, AL 36064
|
- sq. feet
|
- baths - beds |
show details | |

|
#42
Stone Park Blvd
Pike Road, AL 36064
|
- sq. feet
|
- baths - beds |
show details | |

|
#43
Alexander Rd
Pike Road, AL 36064
|
- sq. feet
|
- baths - beds |
show details | |

|
Check over 1 million property listings on Foreclosure.com!
|
browse all offers | |||


 | Tell me about Montgomery (12 replies) |
| Considering a move to Montgomery Ala (7 replies) |
| Family friendly Historic Montgomery (11 replies) |
| Best place to live near Troy (1 reply) |
| Decent area near Montgomery? (5 replies) |
| Maxwell AFB (5 replies) |

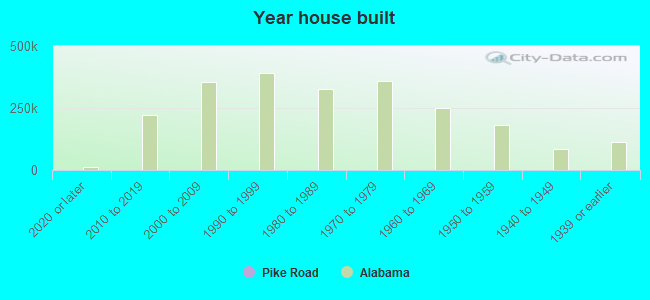
Median year apartment built: 2010
Household type by relationship:
Households: 9,576- Male householders: 1,611 (268 living alone), Female householders: 1,595 (169 living alone)
2,264 spouses (2,251 opposite-sex spouses), 19 unmarried partners, (19 opposite-sex unmarried partners), 3,529 children (3,245 natural, 75 adopted, 208 stepchildren), 108 grandchildren, 65 brothers or sisters, 196 parents, 14 foster children, 95 other relatives, 75 non-relatives
Size of family households: 1,164 2-persons, 498 3-persons, 632 4-persons, 276 5-persons, 26 6-persons, 12 7-or-more-persons.
Size of nonfamily households: 458 1-person, 26 2-persons, 12 5-persons.
2,422 married couples with children.
430 single-parent households (27 men, 403 women).
93.4% of residents of Pike Road speak English at home.
0.9% of residents speak Spanish at home (69% speak English very well, 31% speak English well).
0.9% of residents speak other Indo-European language at home (86% speak English very well, 11% speak English well, 2% speak English not well).
4.5% of residents speak Asian or Pacific Island language at home (53% speak English very well, 29% speak English well, 18% speak English not well).
Foreign born population: 425 (4.4%)
(24.0% of them are naturalized citizens)
| Here: | 7.7 |
| State: | 6.5 |
| Here: | 5.9 |
| State: | 4.7 |
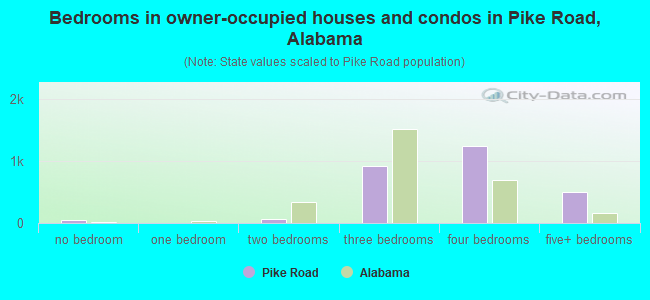
- Bedrooms in owner-occupied houses and condos in Pike Road, Alabama
- 50no bedroom
- 41 bedroom
- 582 bedrooms
- 9163 bedrooms
- 1,2374 bedrooms
- 5005+ bedrooms
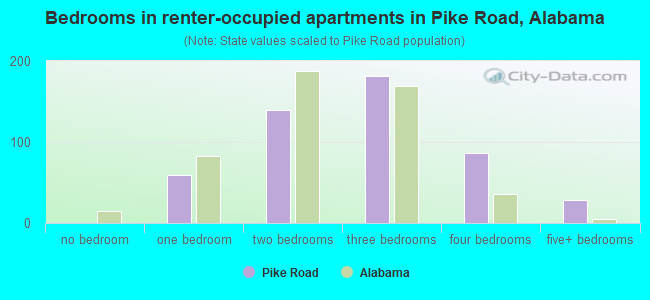
- Bedrooms in renter-occupied apartments in Pike Road, Alabama
- 0no bedroom
- 591 bedroom
- 1402 bedrooms
- 1813 bedrooms
- 874 bedrooms
- 295+ bedrooms
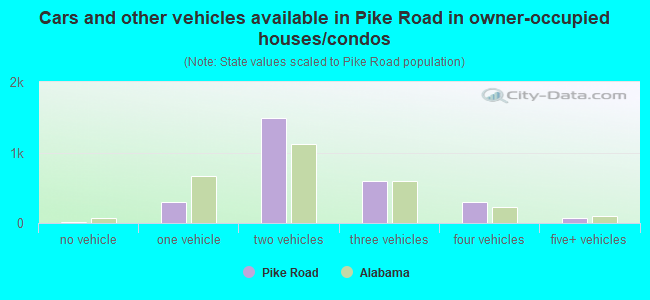
- Cars and other vehicles available in Pike Road in owner-occupied houses/condos
- 19no vehicle
- 3041 vehicle
- 1,4852 vehicles
- 5943 vehicles
- 2994 vehicles
- 655+ vehicles
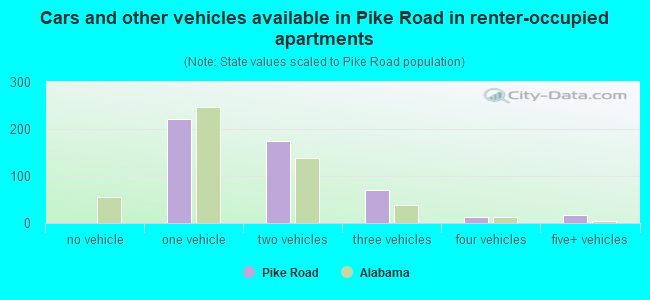
- Cars and other vehicles available in Pike Road in renter-occupied apartments
- 0no vehicle
- 2221 vehicle
- 1742 vehicles
- 703 vehicles
- 134 vehicles
- 175+ vehicles
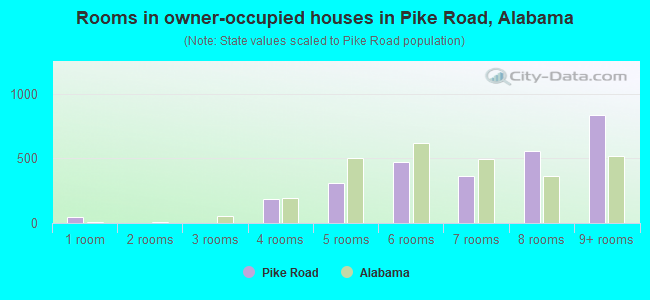
- Rooms in owner-occupied houses in Pike Road, Alabama
- 501 room
- 02 rooms
- 03 rooms
- 1854 rooms
- 3065 rooms
- 4696 rooms
- 3647 rooms
- 5558 rooms
- 8369+ rooms
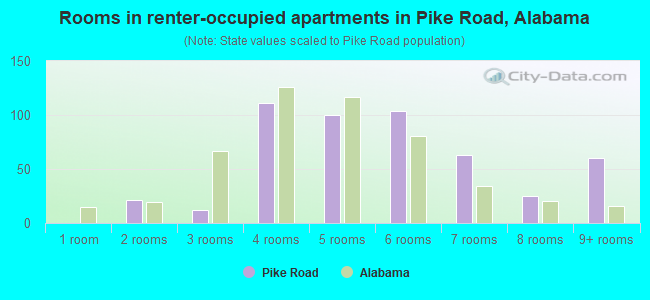
- Rooms in renter-occupied apartments in Pike Road, Alabama
- 01 room
- 212 rooms
- 123 rooms
- 1114 rooms
- 1005 rooms
- 1046 rooms
- 637 rooms
- 258 rooms
- 609+ rooms
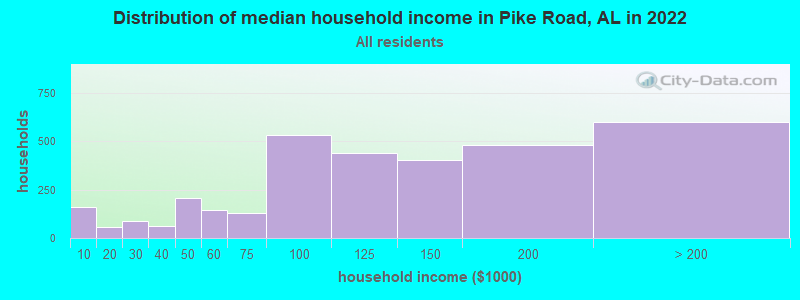
Pike Road, AL household income distribution

- 161Less than $10,000
- 57$10,000 to $19,999
- 89$20,000 to $29,999
- 60$30,000 to $39,999
- 208$40,000 to $49,999
- 145$50,000 to $59,999
- 131$60,000 to $74,999
- 531$75,000 to $99,999
- 437$100,000 to $124,999
- 401$125,000 to $149,999
- 478$150,000 to $199,999
- 598$200,000 or more
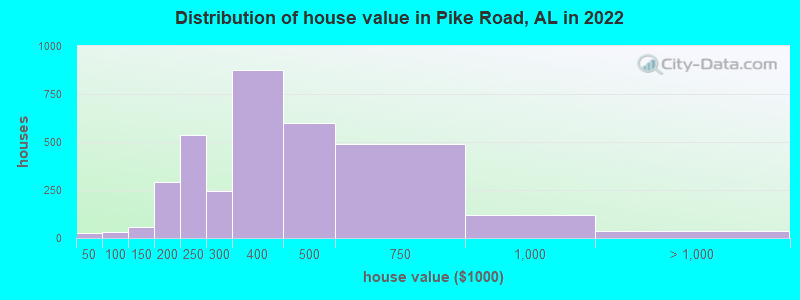
Home value of owner - occupied houses in 2022 in Pike Road, AL
-
- 27Less than $10,000
- 3$60,000 to $69,999
- 4$70,000 to $79,999
- 22$80,000 to $89,999
- 14$100,000 to $124,999
- 44$125,000 to $149,999
- 47$150,000 to $174,999
- 245$175,000 to $199,999
- 535$200,000 to $249,999
- 243$250,000 to $299,999
- 875$300,000 to $399,999
- 596$400,000 to $499,999
- 488$500,000 to $749,999
- 118$750,000 to $999,999
- 35$1,000,000 to $1,499,999
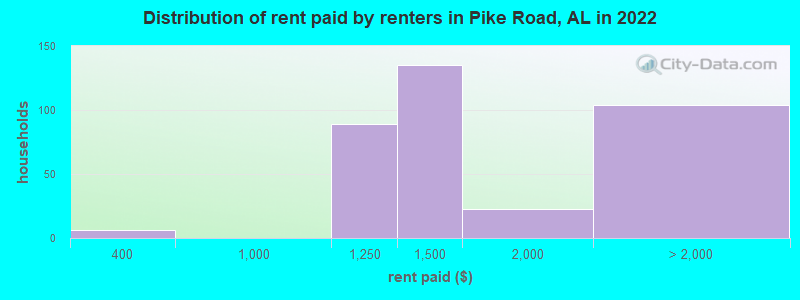
Rent paid by renters in 2022 in Pike Road, AL
-
- 6$350 to $399
- 88$1,000 to $1,249
- 135$1,250 to $1,499
- 22$1,500 to $1,999
- 23$2,000 to $2,499
- 25$2,500 to $2,999
- 53No cash rent
Percentage of workers working in this county: 91.5%
Number of people working at home: 691 (13.9% of all workers)
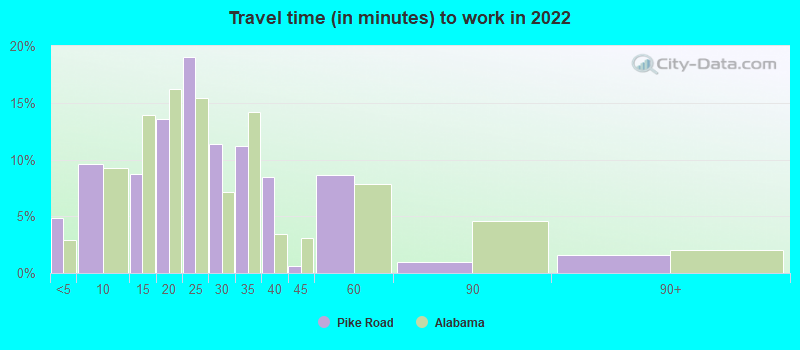
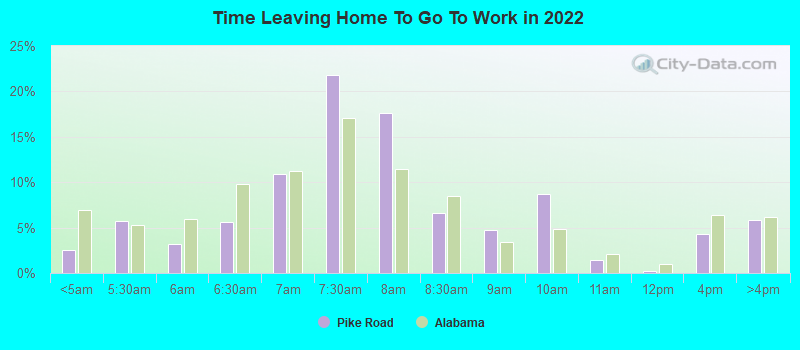
Travel time to work (commute)
- Less than 5 minutes: 102
- 5 to 9 minutes: 248
- 10 to 14 minutes: 339
- 15 to 19 minutes: 855
- 20 to 24 minutes: 833
- 25 to 29 minutes: 476
- 30 to 34 minutes: 736
- 35 to 39 minutes: 301
- 40 to 44 minutes: 91
- 45 to 59 minutes: 107
- 60 to 89 minutes: 149
- 90 or more minutes: 105
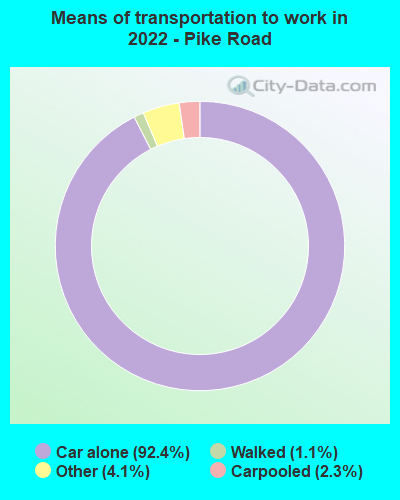
Means of transportation to work:
- Drove a car alone: 808 (56.7%)
- Carpooled: 24 (1.7%)
- Taxi: 85 (6.0%)
- Walked: 12 (0.8%)
- Worked at home: 575 (40.3%)
- Unemployment by race in 2022
- Unemployment rate for White non-Hispanic residents
- 0.5%Males
- Unemployment rate for Black residents
- 6.8%Females
- Unemployment rate for Asian residents
- 8.9%Males
- 3.7%Females
- Unemployment rate for Hispanic or Latino residents
- 29.4%Females
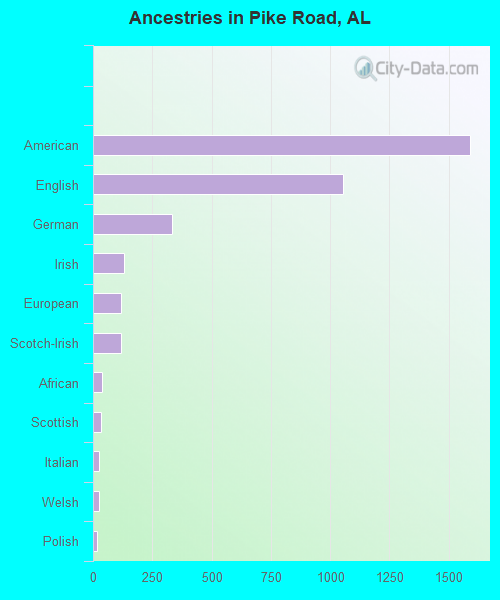
First ancestries reported:
- American: 1,590 (26.8%)
- English: 1,053 (17.8%)
- German: 334 (5.6%)
- Irish: 131 (2.2%)
- European: 119 (2.0%)
- Scotch-Irish: 119 (2.0%)
- African: 37 (0.6%)
- Scottish: 33 (0.6%)
- Italian: 27 (0.5%)
- Welsh: 26 (0.4%)
- Polish: 17 (0.3%)
- British: 14 (0.2%)
- French: 13 (0.2%)
- Austrian: 9 (0.2%)
- French Canadian: 8 (0.1%)
- Armenian: 6 (0.1%)
- Czech: 6 (0.1%)
- Brazilian: 5 (0.08%)
- Iranian: 1 (0.02%)
Most common places of birth for foreign-born residents (%):
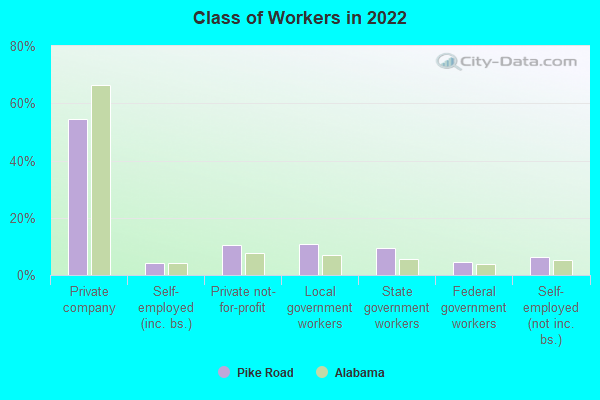
| Pike Road: | 54.7% (248) |
| Alabama: | 5.2% (9,293) |
| Pike Road: | 6.6% (30) |
| Alabama: | 3.9% (6,831) |
| Pike Road: | 6.0% (27) |
| Alabama: | 3.6% (6,414) |
| Pike Road: | 5.3% (24) |
| Alabama: | 4.6% (8,075) |
| Pike Road: | 4.9% (22) |
| Alabama: | 0.1% (206) |
| Pike Road: | 4.4% (20) |
| Alabama: | 0.3% (457) |
| Pike Road: | 3.3% (15) |
| Alabama: | 26.4% (46,832) |
| Pike Road: | 3.1% (14) |
| Alabama: | 2.3% (4,000) |
| Pike Road: | 1.5% (7) |
| Alabama: | 0.3% (451) |
| Pike Road: | 1.5% (7) |
| Alabama: | 1.1% (1,867) |
Place of birth for U.S.-born residents:
- This state: 6,912
- Other state: 2,088
- Northeast: 238
- Midwest: 214
- South: 1,544
- West: 116
88.8% of Pike Road residents lived in the same house 1 years ago.
Out of people who lived in different houses, 43.9% lived in this county.
Out of people who lived in different counties, 50.2% lived in Alabama.
| Pike Road: | 88.8% |
| State average: | 87.6% |
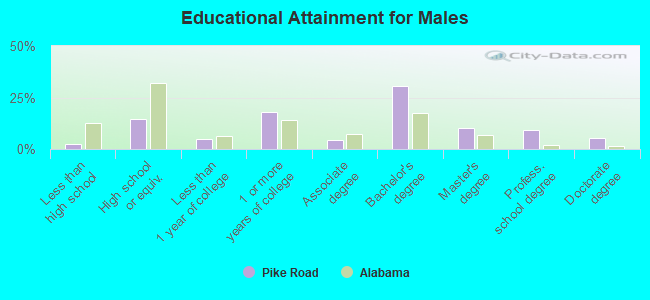
Education attainment for males 25 years and older:
- No schooling: 12
- Nursery to 4th grade: 0
- 5th and 6th grade: 0
- 7th and 8th grade: 6
- 9th grade: 0
- 10th grade: 14
- 11th grade: 13
- 12th grade, no diploma: 19
- High school graduate (or equivalency): 392
- Less than 1 year of college: 131
- Some college more than 1 year, no degree: 485
- Associate degree: 124
- Bachelor's degree: 825
- Master's degree: 280
- Professional school degree: 248
- Doctorate degree: 145
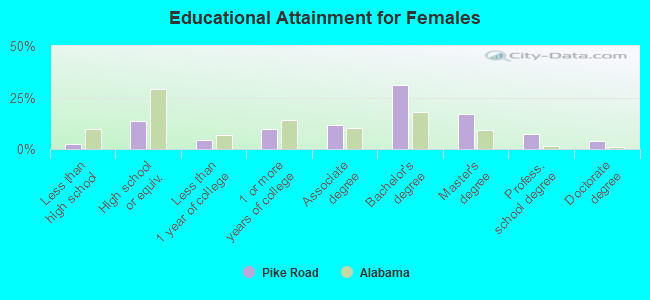
Education attainment for females 25 years and older:
- No schooling: 36
- Nursery to 4th grade: 0
- 5th and 6th grade: 0
- 7th and 8th grade: 0
- 9th grade: 0
- 10th grade: 24
- 11th grade: 0
- 12th grade, no diploma: 24
- High school graduate (or equivalency): 481
- Less than 1 year of college: 144
- Some college more than 1 year, no degree: 333
- Associate degree: 402
- Bachelor's degree: 1,072
- Master's degree: 587
- Professional school degree: 245
- Doctorate degree: 129


Housing units in structures:
- One, detached: 2,974
- One, attached: 33
- 3 or 4: 11
- 5 to 9: 95
- 10 to 19: 307
- 20 to 49: 27
- 50 or more: 37
- Mobile homes: 51
Housing units lacking complete kitchen facilities in 2022: 0.2%
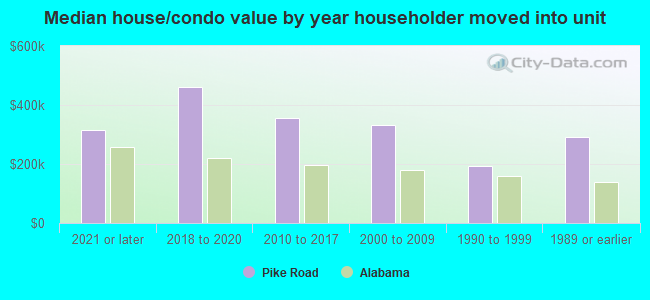
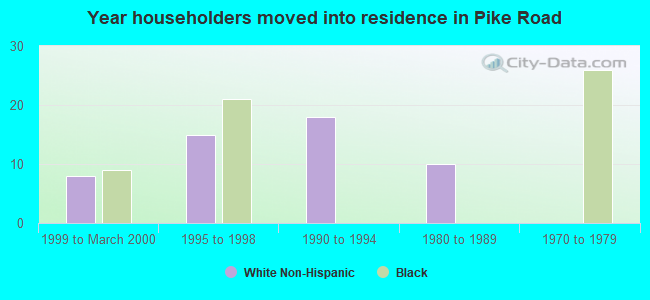
House/condo owner moved in on average 5 years ago
Renter moved in on average 5 years ago
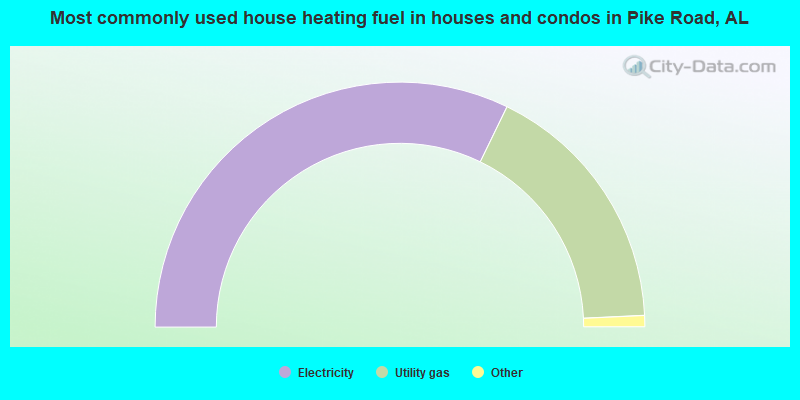
- 64.4%Electricity
- 34.1%Utility gas
- 1.3%Bottled, tank, or LP gas
- 0.2%Wood
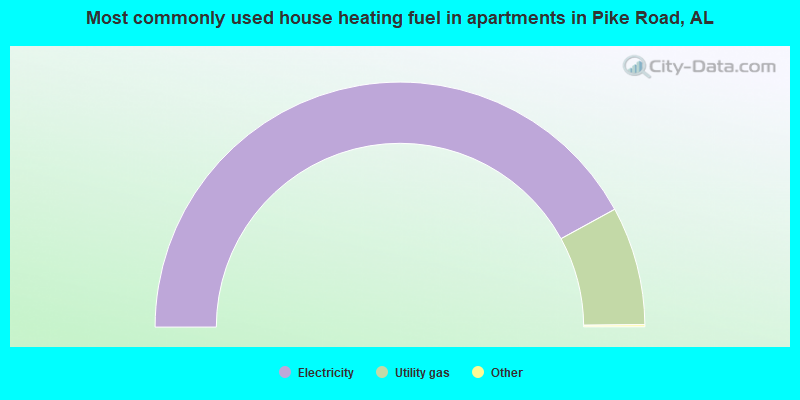
- 84.3%Electricity
- 15.7%Utility gas
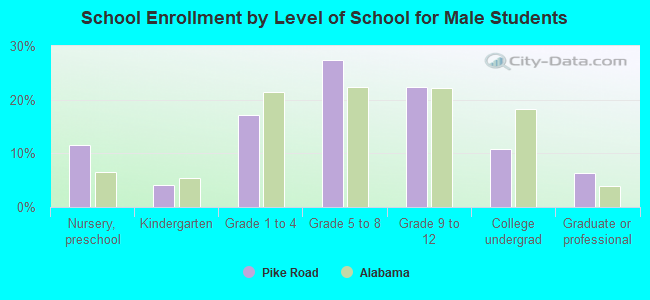
Private vs. public school enrollment:
| Here: | 30.5% |
| Alabama: | 14.7% |
| Here: | 43.2% |
| Alabama: | 16.3% |
| Here: | 5.3% |
| Alabama: | 14.6% |