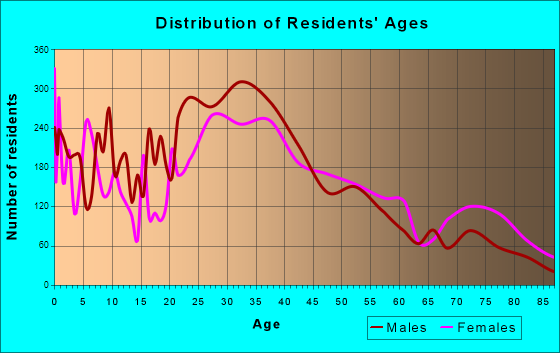
Port Chester, NY (New York) Houses and Residents
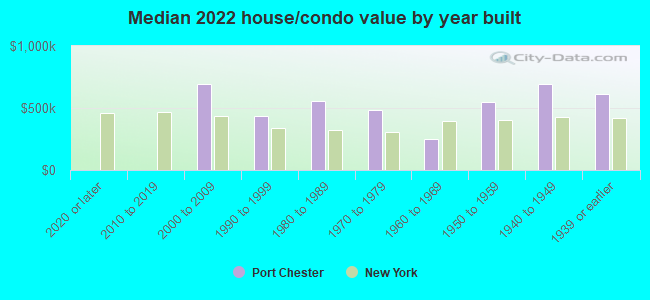
| Port Chester: | $562,398 |
| New York: | $400,400 |
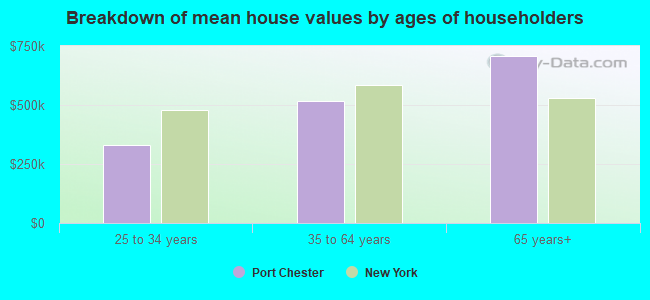
Mean price in 2022:
Detached houses: $698,287
Here: $698,287 State: $476,719 Townhouses or other attached units: $489,421
Here: $489,421 State: $699,270 In 2-unit structures: $522,009
Here: $522,009 State: $713,077 In 3-to-4-unit structures: $451,567
Here: $451,567 State: $764,568 In 5-or-more-unit structures: $252,303
Here: $252,303 State: $912,009
Total population: 29,522 (Urban population: 27,867, Rural population: 0)
Houses: 10,832 (10,345 occupied: 4,672 owner occupied, 5,698 renter occupied)
| % of renters here: | 55% |
| State: | 46% |
Housing density: 4,596 houses/condos per square mile
Median price asked for vacant for-sale houses and condos in 2022: $195,479.
Median contract rent in 2022: $1,778 (lower quartile is $1,314, upper quartile is over $2,000)
Median rent asked for vacant for-rent units in 2022: $3,757
Median gross rent in Port Chester, NY in 2022: $1,928
Housing units in Port Chester with a mortgage: 3,285 (285 second mortgage, 0 home equity loan, 216 both second mortgage and home equity loan)
Houses without a mortgage: 23
Median household income for houses/condos with a mortgage: $141,691
Median household income for apartments without a mortgage: $88,520
Median monthly housing costs: $2,118
Compare current foreclosures near Port Chester, NY:
| Photo | Address | Area | Beds / Baths | Price | Details |
|---|---|---|---|---|---|

|
#1
Riverdale Ave
Port Chester, NY 10573
|
1,616 sq. feet
|
1 baths 3 beds |
$659,900
|
show details |

|
#2
James Ct
Port Chester, NY 10573
|
1,420 sq. feet
|
3 baths 2 beds |
show details | |

|
#3
Beacon Ln
Port Chester, NY 10573
|
2,650 sq. feet
|
2 baths 4 beds |
show details | |

|
#4
Robert Ave
Port Chester, NY 10573
|
2,062 sq. feet
|
2 baths 4 beds |
show details | |

|
#5
Park Ave
Port Chester, NY 10573
|
1,884 sq. feet
|
3 baths 4 beds |
show details | |

|
#6
Willett Ave
Port Chester, NY 10573
|
2,346 sq. feet
|
2 baths 4 beds |
show details | |

|
#7
Bush Ave
Port Chester, NY 10573
|
1,500 sq. feet
|
2 baths 3 beds |
show details | |

|
#8
N Main St
Port Chester, NY 10573
|
- sq. feet
|
- baths - beds |
show details | |

|
#9
S Regent St
Port Chester, NY 10573
|
- sq. feet
|
- baths - beds |
show details | |

|
#10
Crane Ave
White Plains, NY 10603
|
2,400 sq. feet
|
2 baths 4 beds |
$724,900
|
show details |
| Photo | Address | Area | Beds / Baths | Price | Details |
|---|---|---|---|---|---|

|
#11
Midland Ave Apt 4h
Bronxville, NY 10708
|
900 sq. feet
|
1 baths 1 beds |
$184,000
|
show details |

|
#12
Fordham Hill Oval
Bronx, NY 10468
|
700 sq. feet
|
1 baths 1 beds |
$154,900
|
show details |

|
#13
Central Park Ave Apt 9m
Yonkers, NY 10710
|
1,300 sq. feet
|
2 baths 3 beds |
$319,900
|
show details |

|
#14
N Broadway Apt A6
Yonkers, NY 10701
|
950 sq. feet
|
2 baths 2 beds |
$219,900
|
show details |

|
#15
Pearsall Dr
Mount Vernon, NY 10552
|
650 sq. feet
|
1 baths 1 beds |
$127,500
|
show details |

|
#16
Martin Dr
Harrington Park, NJ 07640
|
1,746 sq. feet
|
3 baths 3 beds |
$965,000
|
show details |

|
#17
Sandy Hill Rd
Oyster Bay, NY 11771
|
9,672 sq. feet
|
6 baths 9 beds |
$1,394,900
|
show details |

|
#18
17th Ave 1st Floor
Whitestone, NY 11357
|
610 sq. feet
|
1 baths 1 beds |
$229,900
|
show details |

|
#19
N Broadway
Irvington, NY 10533
|
850 sq. feet
|
1 baths 2 beds |
$315,000
|
show details |

|
#20
Elm Tree Pl
Stamford, CT 06906
|
4,172 sq. feet
|
4 baths 7 beds |
$687,500
|
show details |
| Photo | Address | Area | Beds / Baths | Price | Details |
|---|---|---|---|---|---|

|
#21
E 221st St
Bronx, NY 10467
|
1,890 sq. feet
|
2 baths 3 beds |
$554,900
|
show details |

|
#22
Davenport Ave Apt 1b
New Rochelle, NY 10805
|
750 sq. feet
|
1 baths 1 beds |
$159,900
|
show details |

|
#23
Swinton Ave
Bronx, NY 10465
|
1,938 sq. feet
|
2 baths 3 beds |
$789,900
|
show details |

|
#24
Edcris Ln
Huntington, NY 11743
|
1,450 sq. feet
|
2 baths 3 beds |
$550,000
|
show details |

|
#25
Limerick St
Stamford, CT 06902
|
1,382 sq. feet
|
4 baths 5 beds |
$919,900
|
show details |

|
#26
Olinville Ave Apt 11c
Bronx, NY 10467
|
1,000 sq. feet
|
2 baths 3 beds |
$385,000
|
show details |

|
#27
Putnam Ave
Port Chester, NY 10573
|
- sq. feet
|
- baths - beds |
show details | |

|
#28
Arlington Ave Apt 11n
Bronx, NY 10471
|
500 sq. feet
|
- baths 1 beds |
$182,500
|
show details |

|
#29
Edgewater Park 46d Unit 46d
Bronx, NY 10465
|
- sq. feet
|
2 baths 3 beds |
$324,900
|
show details |

|
#30
Talmadge Hill Rd
Darien, CT 06820
|
- sq. feet
|
4 baths 5 beds |
$2,395,000
|
show details |
| Photo | Address | Area | Beds / Baths | Price | Details |
|---|---|---|---|---|---|

|
#31
Glenwood Ave Apt 74
Yonkers, NY 10703
|
- sq. feet
|
1 baths 3 beds |
$313,000
|
show details |

|
#32
Central Park Ave
Yonkers, NY 10710
|
1,000 sq. feet
|
1 baths 2 beds |
show details | |

|
#33
Northill St Apt 2x
Stamford, CT 06907
|
1,076 sq. feet
|
2 baths 2 beds |
show details | |

|
#34
Powells Cove Blvd Apt 4d
Whitestone, NY 11357
|
1,800 sq. feet
|
2 baths 2 beds |
show details | |

|
#35
Stornowaye St
Chappaqua, NY 10514
|
5,023 sq. feet
|
4 baths 4 beds |
show details | |

|
#36
The Promenade
Glen Head, NY 11545
|
- sq. feet
|
2 baths 3 beds |
show details | |

|
#37
Portland Pl
Yonkers, NY 10703
|
- sq. feet
|
3 baths 6 beds |
show details | |

|
#38
Juniper St
Dumont, NJ 07628
|
1,550 sq. feet
|
2 baths 3 beds |
show details | |

|
#39
Westview Ave
White Plains, NY 10603
|
1,513 sq. feet
|
3 baths 5 beds |
show details | |

|
#40
Wyndover Ln
Stamford, CT 06902
|
4,398 sq. feet
|
3 baths 3 beds |
show details |
| Photo | Address | Area | Beds / Baths | Price | Details |
|---|---|---|---|---|---|

|
#41
William St
Ossining, NY 10562
|
1,160 sq. feet
|
2 baths 3 beds |
show details | |

|
#42
E View Ct
Jericho, NY 11753
|
2,246 sq. feet
|
3 baths 3 beds |
show details | |

|
#43
Tilden St # 4b
Bronx, NY 10467
|
1,000 sq. feet
|
1 baths 2 beds |
show details | |

|
#44
Renaissance Sq
White Plains, NY 10601
|
1,658 sq. feet
|
3 baths 2 beds |
show details | |

|
#45
Rosalind Ave
Pleasantville, NY 10570
|
2,700 sq. feet
|
3 baths 4 beds |
show details | |

|
#46
Soundview Ave Unit 60
Stamford, CT 06902
|
2,189 sq. feet
|
1 baths 3 beds |
show details | |

|
#47
Kings Hwy
Valley Cottage, NY 10989
|
1,754 sq. feet
|
3 baths 4 beds |
show details | |

|
#48
Ellis Pl
Ossining, NY 10562
|
1,432 sq. feet
|
2 baths 3 beds |
show details | |

|
#49
S Broadway
White Plains, NY 10605
|
3,606 sq. feet
|
2 baths 7 beds |
show details | |

|
Check over 1 million property listings on Foreclosure.com!
|
browse all offers | |||


 | Houses in Two Jurisdictions (10 replies) |
| Port Chester development... (3 replies) |
| If you don't have a household income of >$300K and/or have family here, why do you live in Westchester? (22 replies) |
| How to find a rental apartment? (3 replies) |
| Upper Middle class african-american communities in ny (2042 replies) |
| Scarsdale or Great Neck? (36 replies) |
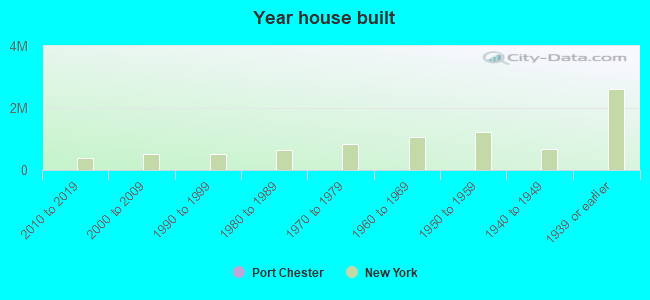
Median year apartment built: 1959
Household type by relationship:
Households: 31,053- Male householders: 5,185 (929 living alone), Female householders: 4,948 (1,396 living alone)
5,256 spouses (5,228 opposite-sex spouses), 524 unmarried partners, (521 opposite-sex unmarried partners), 9,481 children (9,069 natural, 69 adopted, 342 stepchildren), 1,162 grandchildren, 783 brothers or sisters, 493 parents, 0 foster children, 1,056 other relatives, 1,902 non-relatives
- In group quarters: 260
Size of family households: 2,337 2-persons, 1,530 3-persons, 1,971 4-persons, 561 5-persons, 643 6-persons, 239 7-or-more-persons.
Size of nonfamily households: 2,528 1-person, 290 2-persons, 79 3-persons, 15 6-persons, 49 7-or-more-persons.
3,497 married couples with children.
1,676 single-parent households (555 men, 1,121 women).
37.3% of residents of Port Chester speak English at home.
57.6% of residents speak Spanish at home (50% speak English very well, 23% speak English well, 22% speak English not well, 5% don't speak English at all).
4.3% of residents speak other Indo-European language at home (69% speak English very well, 18% speak English well, 13% speak English not well).
1.4% of residents speak Asian or Pacific Island language at home (48% speak English very well, 38% speak English well, 14% speak English not well).
0.2% of residents speak other language at home (54% speak English very well, 46% speak English not well).
Foreign born population: 13,474 (43.4%)
(46.4% of them are naturalized citizens)
| Here: | 5.6 |
| State: | 6.3 |
| Here: | 3.9 |
| State: | 3.8 |
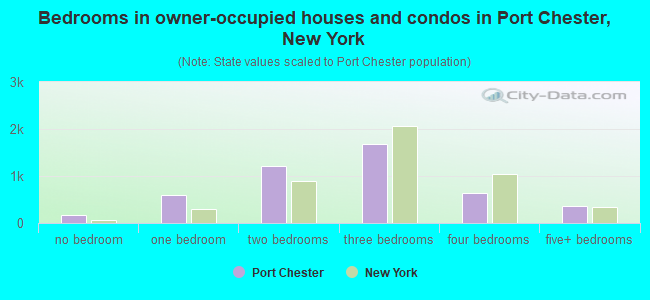
- Bedrooms in owner-occupied houses and condos in Port Chester, New York
- 168no bedroom
- 5941 bedroom
- 1,2232 bedrooms
- 1,6853 bedrooms
- 6314 bedrooms
- 3725+ bedrooms
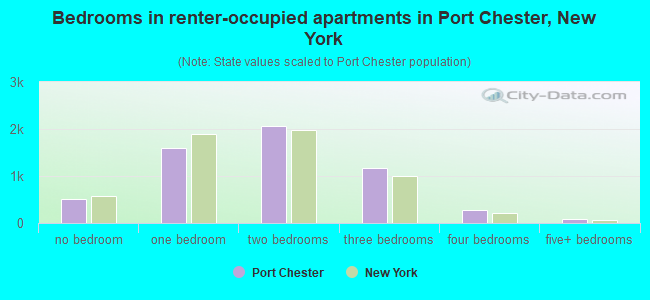
- Bedrooms in renter-occupied apartments in Port Chester, New York
- 521no bedroom
- 1,5981 bedroom
- 2,0602 bedrooms
- 1,1673 bedrooms
- 2674 bedrooms
- 865+ bedrooms
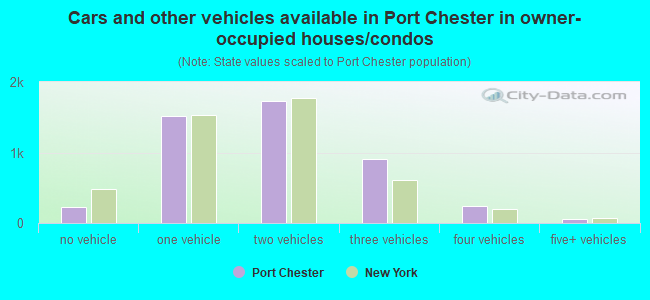
- Cars and other vehicles available in Port Chester in owner-occupied houses/condos
- 224no vehicle
- 1,5181 vehicle
- 1,7332 vehicles
- 9023 vehicles
- 2354 vehicles
- 605+ vehicles
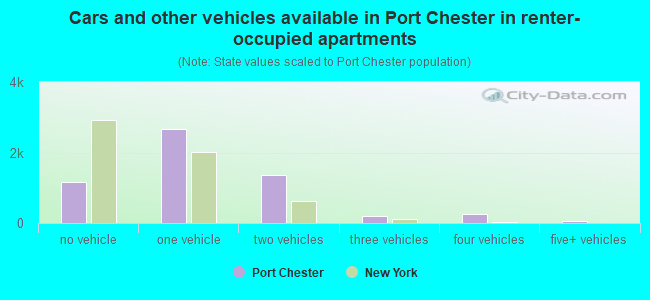
- Cars and other vehicles available in Port Chester in renter-occupied apartments
- 1,154no vehicle
- 2,6801 vehicle
- 1,3732 vehicles
- 1923 vehicles
- 2484 vehicles
- 525+ vehicles
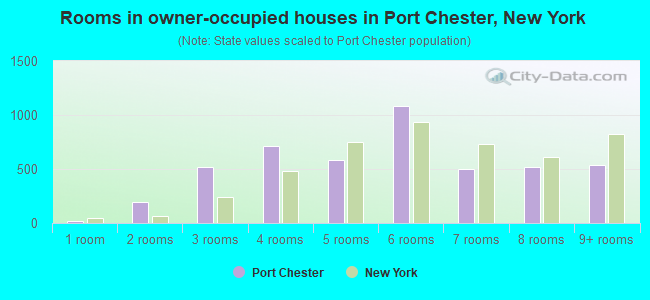
- Rooms in owner-occupied houses in Port Chester, New York
- 231 room
- 1972 rooms
- 5153 rooms
- 7114 rooms
- 5815 rooms
- 1,0846 rooms
- 5047 rooms
- 5198 rooms
- 5389+ rooms
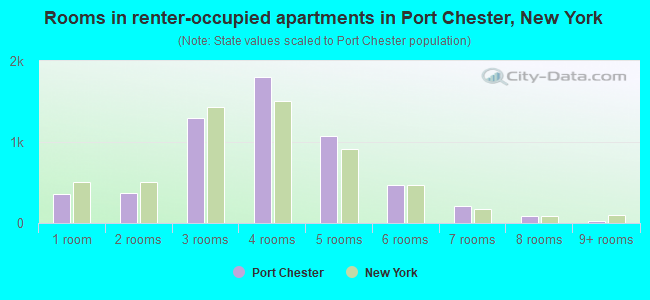
- Rooms in renter-occupied apartments in Port Chester, New York
- 3601 room
- 3682 rooms
- 1,2953 rooms
- 1,8044 rooms
- 1,0805 rooms
- 4726 rooms
- 2067 rooms
- 908 rooms
- 249+ rooms
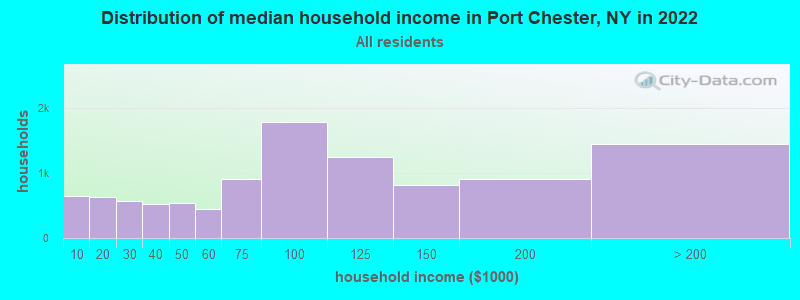
Port Chester, NY household income distribution

- 643Less than $10,000
- 633$10,000 to $19,999
- 560$20,000 to $29,999
- 520$30,000 to $39,999
- 536$40,000 to $49,999
- 449$50,000 to $59,999
- 904$60,000 to $74,999
- 1,778$75,000 to $99,999
- 1,243$100,000 to $124,999
- 806$125,000 to $149,999
- 904$150,000 to $199,999
- 1,445$200,000 or more
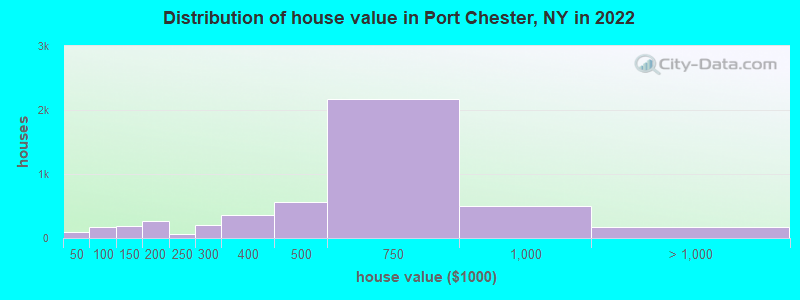
Home value of owner - occupied houses in 2022 in Port Chester, NY
-
- 22$20,000 to $24,999
- 64$40,000 to $49,999
- 41$50,000 to $59,999
- 14$60,000 to $69,999
- 47$80,000 to $89,999
- 77$100,000 to $124,999
- 117$125,000 to $149,999
- 78$150,000 to $174,999
- 181$175,000 to $199,999
- 69$200,000 to $249,999
- 198$250,000 to $299,999
- 361$300,000 to $399,999
- 568$400,000 to $499,999
- 2,172$500,000 to $749,999
- 498$750,000 to $999,999
- 49$1,000,000 to $1,499,999
- 58$1,500,000 to $1,999,999
- 66$2,000,000 or more
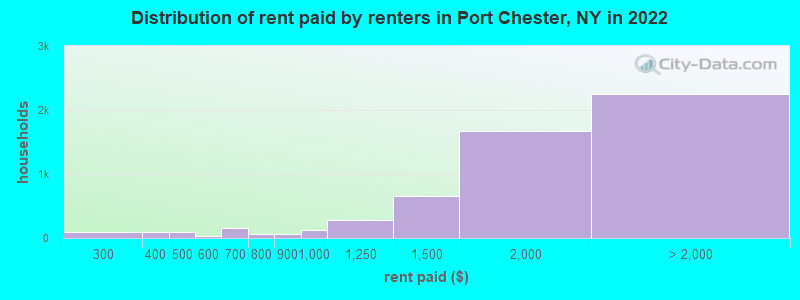
Rent paid by renters in 2022 in Port Chester, NY
-
- 10$100 to $149
- 86$200 to $249
- 9$250 to $299
- 97$300 to $349
- 82$400 to $449
- 8$450 to $499
- 7$500 to $549
- 30$550 to $599
- 13$600 to $649
- 143$650 to $699
- 64$750 to $799
- 57$800 to $899
- 131$900 to $999
- 275$1,000 to $1,249
- 654$1,250 to $1,499
- 1,674$1,500 to $1,999
- 1,148$2,000 to $2,499
- 701$2,500 to $2,999
- 72$3,000 to $3,499
- 134$3,500 or more
- 189No cash rent
Percentage of workers working in this county: 68.6%
Number of people working at home: 1,725 (10.8% of all workers)
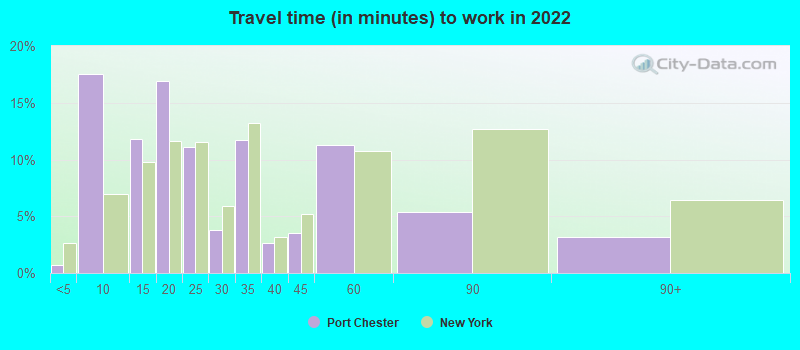
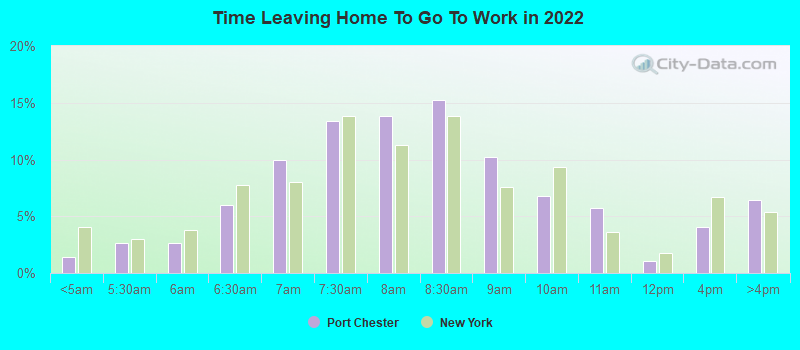
Travel time to work (commute)
- Less than 5 minutes: 330
- 5 to 9 minutes: 1,980
- 10 to 14 minutes: 1,956
- 15 to 19 minutes: 3,053
- 20 to 24 minutes: 1,623
- 25 to 29 minutes: 703
- 30 to 34 minutes: 1,250
- 35 to 39 minutes: 290
- 40 to 44 minutes: 305
- 45 to 59 minutes: 1,139
- 60 to 89 minutes: 1,190
- 90 or more minutes: 245
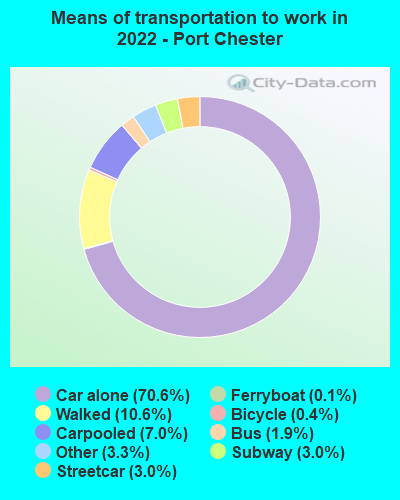
Means of transportation to work:
- Drove a car alone: 6,108 (58.0%)
- Carpooled: 616 (5.8%)
- Bus: 139 (1.3%)
- Subway or elevated rail: 350 (3.3%)
- Long-distance train or commuter rail: 195 (1.9%)
- Ferryboat: 12 (0.1%)
- Taxi: 501 (4.8%)
- Bicycle: 41 (0.4%)
- Walked: 909 (8.6%)
- Worked at home: 1,725 (16.4%)
- Unemployment by race in 2022
- Unemployment rate for White non-Hispanic residents
- 2.1%Males
- 2.0%Females
- Unemployment rate for Black residents
- 3.9%Males
- 3.6%Females
- Unemployment rate for American Indian and Alaska Native residents
- 51.5%Males
- 43.7%Females
- Unemployment rate for Asian residents
- 12.7%Males
- Unemployment rate for other race residents
- 5.6%Males
- 4.6%Females
- Unemployment rate for two or more race residents
- 8.1%Males
- Unemployment rate for Hispanic or Latino residents
- 8.6%Males
- 6.6%Females
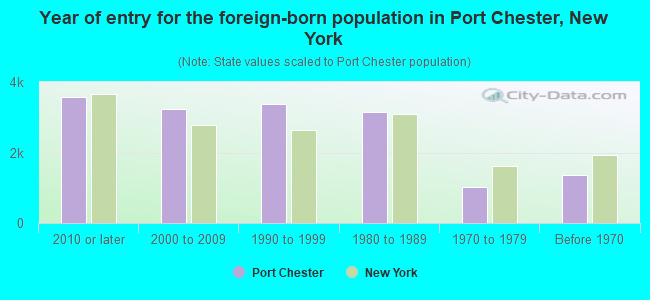
- Year of entry for the foreign-born population in Port Chester, New York
- 3,5622010 or later
- 3,2302000 to 2009
- 3,3681990 to 1999
- 3,1401980 to 1989
- 1,0271970 to 1979
- 1,365Before 1970
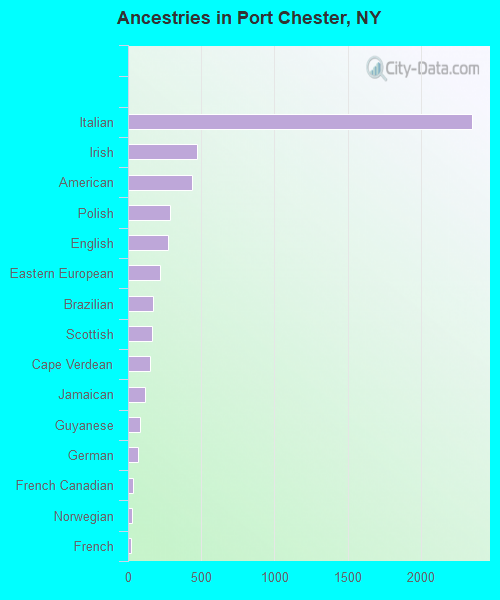
First ancestries reported:
- Italian: 2,348 (12.6%)
- Irish: 472 (2.5%)
- American: 437 (2.4%)
- Polish: 285 (1.5%)
- English: 270 (1.5%)
- Eastern European: 216 (1.2%)
- Brazilian: 169 (0.9%)
- Scottish: 167 (0.9%)
- Cape Verdean: 148 (0.8%)
- Jamaican: 119 (0.6%)
- Guyanese: 81 (0.4%)
- German: 68 (0.4%)
- French Canadian: 31 (0.2%)
- Norwegian: 29 (0.2%)
- French: 23 (0.1%)
- African: 21 (0.1%)
- Basque: 17 (0.09%)
- European: 17 (0.09%)
- Iranian: 17 (0.09%)
- Ukrainian: 15 (0.08%)
- Lebanese: 13 (0.07%)
- Greek: 11 (0.06%)
- Egyptian: 9 (0.05%)
- Danish: 9 (0.05%)
- British West Indian: 9 (0.05%)
- Czechoslovakian: 8 (0.04%)
- Czech: 5 (0.03%)
- Maltese: 4 (0.02%)
- British: 3 (0.02%)
- Barbadian: 2 (0.01%)
- Ghanaian: 1 (0.01%)
Most common places of birth for foreign-born residents (%):
| Port Chester: | 20.4% (2,716) |
| New York: | 1.4% (61,245) |
| Port Chester: | 17.3% (2,313) |
| New York: | 3.9% (177,448) |
| Port Chester: | 14.8% (1,980) |
| New York: | 4.8% (214,559) |
| Port Chester: | 11.9% (1,586) |
| New York: | 1.2% (54,759) |
| Port Chester: | 7.9% (1,060) |
| New York: | 11.1% (501,040) |
| Port Chester: | 7.8% (1,045) |
| New York: | 2.5% (111,920) |
| Port Chester: | 2.5% (330) |
| New York: | 2.4% (108,067) |
| Port Chester: | 1.9% (254) |
| New York: | 0.7% (30,658) |
| Port Chester: | 1.9% (253) |
| New York: | 1.8% (81,374) |
Place of birth for U.S.-born residents:
- This state: 13,182
- Other state: 3,890
- Northeast: 2,507
- Midwest: 428
- South: 675
- West: 193
93.2% of Port Chester residents lived in the same house 1 years ago.
Out of people who lived in different houses, 39.4% lived in this county.
Out of people who lived in different counties, 40.5% lived in New York.
| Port Chester: | 93.2% |
| State average: | 89.6% |
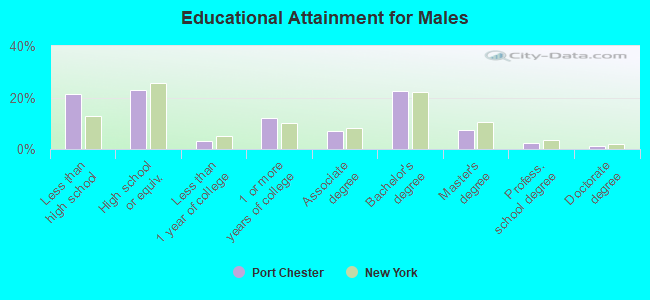
Education attainment for males 25 years and older:
- No schooling: 767
- Nursery to 4th grade: 37
- 5th and 6th grade: 474
- 7th and 8th grade: 202
- 9th grade: 55
- 10th grade: 132
- 11th grade: 287
- 12th grade, no diploma: 455
- High school graduate (or equivalency): 2,622
- Less than 1 year of college: 374
- Some college more than 1 year, no degree: 1,349
- Associate degree: 806
- Bachelor's degree: 2,576
- Master's degree: 834
- Professional school degree: 273
- Doctorate degree: 138
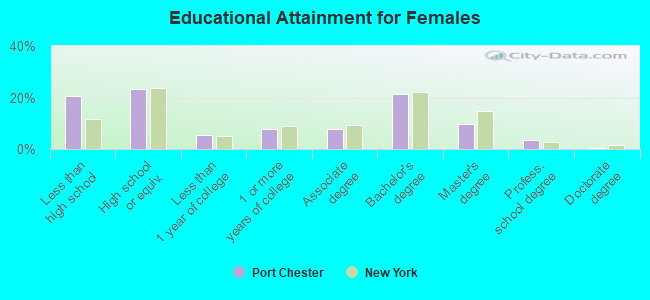
Education attainment for females 25 years and older:
- No schooling: 676
- Nursery to 4th grade: 73
- 5th and 6th grade: 495
- 7th and 8th grade: 111
- 9th grade: 98
- 10th grade: 125
- 11th grade: 218
- 12th grade, no diploma: 268
- High school graduate (or equivalency): 2,355
- Less than 1 year of college: 542
- Some college more than 1 year, no degree: 803
- Associate degree: 794
- Bachelor's degree: 2,166
- Master's degree: 974
- Professional school degree: 350
- Doctorate degree: 43
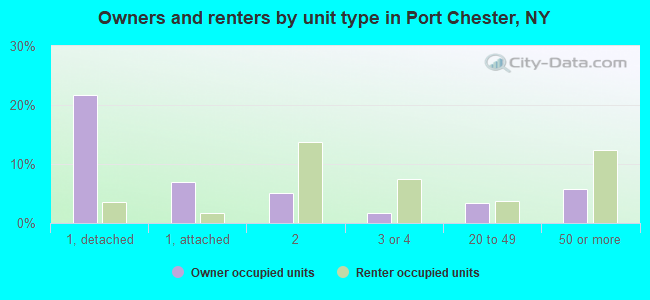
Housing units in structures:
- One, detached: 2,659
- One, attached: 897
- Two: 2,006
- 3 or 4: 1,167
- 5 to 9: 872
- 10 to 19: 502
- 20 to 49: 650
- 50 or more: 2,077
Housing units lacking complete kitchen facilities in 2022: 2.3%
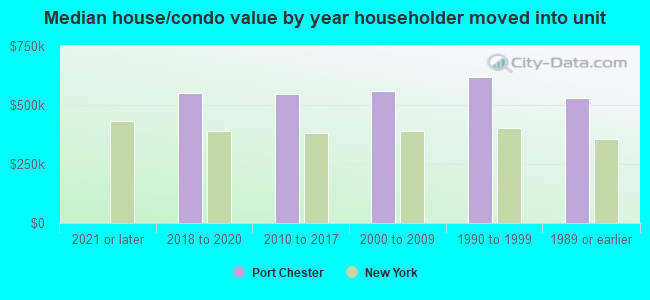
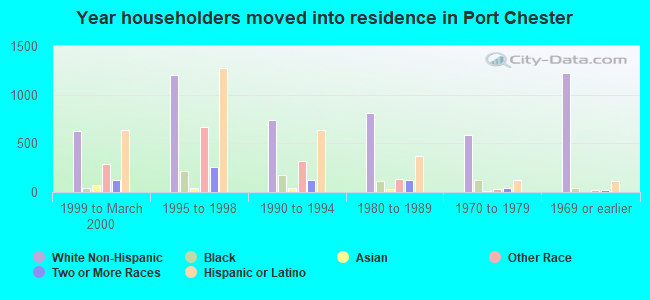
House/condo owner moved in on average 12 years ago
Renter moved in on average 7 years ago
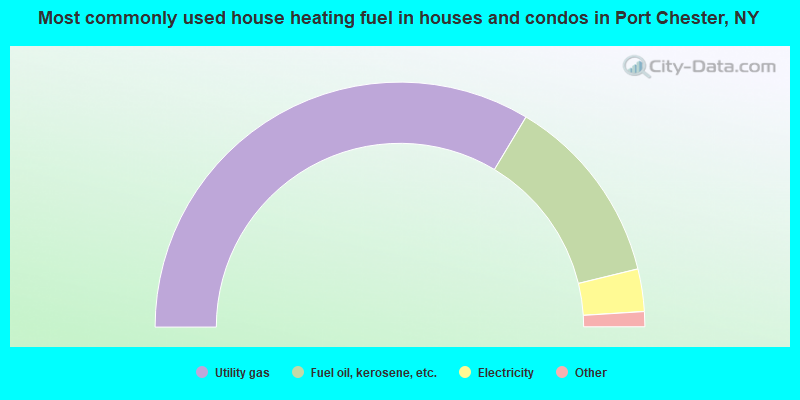
- 67.2%Utility gas
- 25.2%Fuel oil, kerosene, etc.
- 5.6%Electricity
- 1.3%Bottled, tank, or LP gas
- 0.4%Other fuel
- 0.3%No fuel used
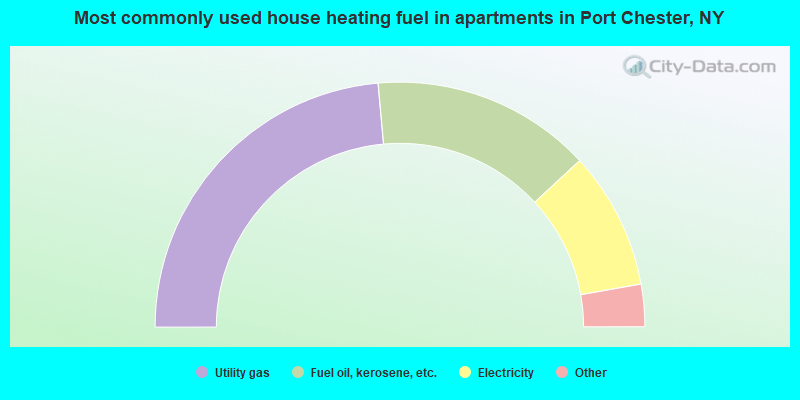
- 47.2%Utility gas
- 29.1%Fuel oil, kerosene, etc.
- 18.2%Electricity
- 3.4%Other fuel
- 2.0%Bottled, tank, or LP gas
- 0.2%No fuel used
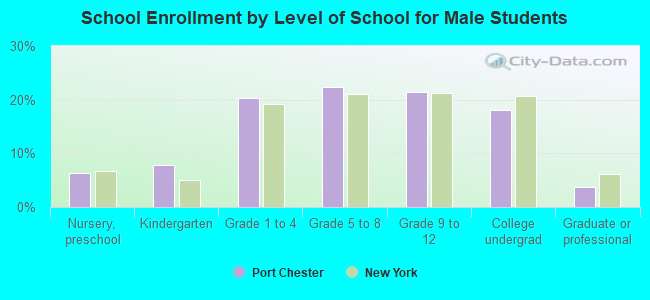
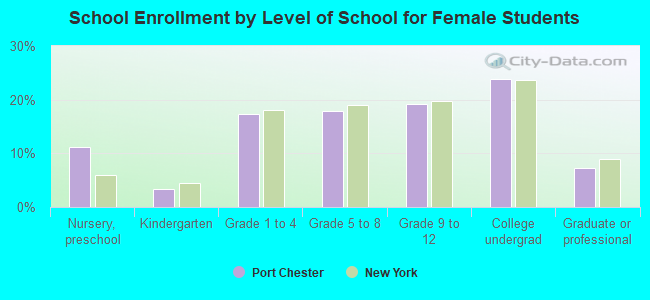
Private vs. public school enrollment:
| Here: | 4.0% |
| New York: | 15.6% |
| Here: | 6.3% |
| New York: | 15.0% |
| Here: | 23.9% |
| New York: | 39.2% |