Portsmouth, VA (Virginia) Houses and Residents
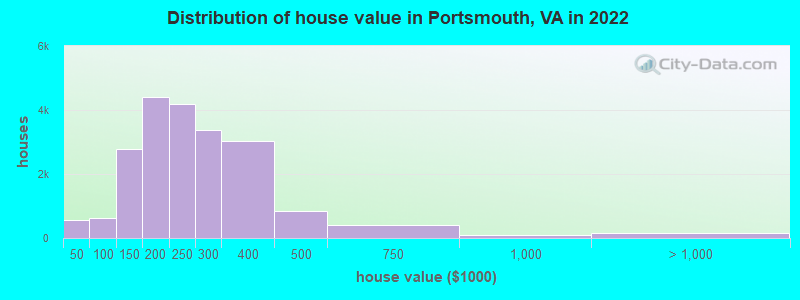
Estimated median house or condo value in 2022: $231,700 (it was $81,000 in 2000 )
Portsmouth:
$231,700Virginia:
$365,700
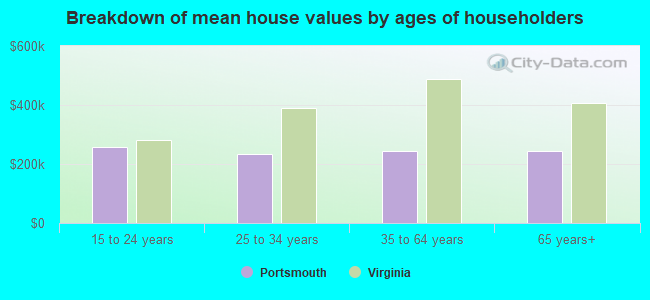
Lower value quartile - upper value quartile: $178,700 - $295,900Mean price in 2022: Detached houses: $272,723 Here:
$272,723State:
$472,865
Townhouses or other attached units: $216,613 Here:
$216,613State:
$457,437
In 2-unit structures: $258,798 Here:
$258,798State:
$396,289
In 3-to-4-unit structures: $184,854 Here:
$184,854State:
$252,346
In 5-or-more-unit structures: $196,645 Here:
$196,645State:
$382,551
Mobile homes: $172,936 Here:
$172,936State:
$100,736
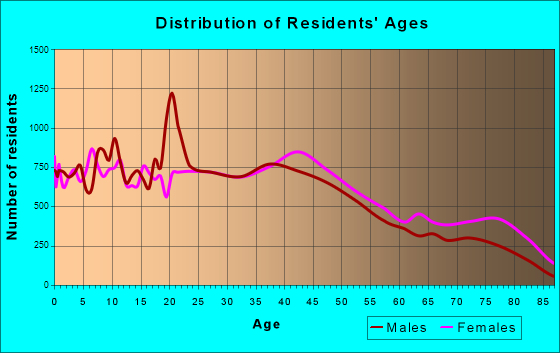
Total population: 96,004 (All urban)
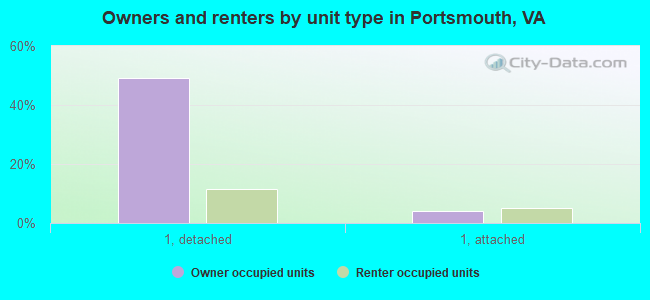
Houses: 43,394 (40,178 occupied: 23,687 owner occupied, 16,491 renter occupied )
% of renters here:
41%State:
33%
Housing density: 1,309 houses/condos per square mile
Median price asked for vacant for-sale houses and condos in 2022: $165,963.
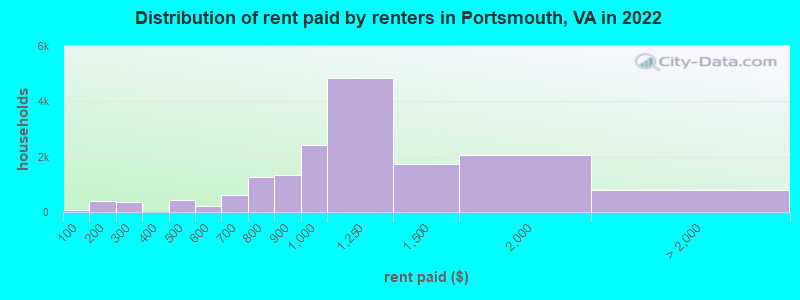
Median contract rent in 2022: $1,047 (lower quartile is $850, upper quartile is $1,258)
Median rent asked for vacant for-rent units in 2022: $896
Median gross rent in Portsmouth, VA in 2022: $1,240
Housing units in Portsmouth with a mortgage: 17,090 (2,610 second mortgage, 0 home equity loan, 2,199 both second mortgage and home equity loan )Houses without a mortgage: 480
Median household income for houses/condos with a mortgage: $71,936
Median household income for apartments without a mortgage: $54,885
Median monthly housing costs: $1,284
Data:
Median house or condo value ($)
Median house or condo value ($ change since 2000)
Median house or condo value ($) - White
Median house or condo value ($) - Black or African American
Median house or condo value ($) - Asian
Median house or condo value ($) - Hispanic or Latino
Median house or condo value ($) - American Indian and Alaska Native
Median house or condo value ($) - Multirace
Median house or condo value ($) - Other Race
Median price asked for mobile homes ($)
Household density (households per square mile)
Mean house or condo value by units in structure - 1, detached ($)
Mean house or condo value by units in structure - 1, attached ($)
Mean house or condo value by units in structure - 2 ($)
Mean house or condo value by units in structure by units in structure - 3 or 4 ($)
Mean house or condo value by units in structure - 5 or more ($)
Mean house or condo value by units in structure - Boat, RV, van, etc. ($)
Mean house or condo value by units in structure - Mobile home ($)
Median contract rent ($)
Median contract rent - Lower quartile ($)
Median contract rent - Upper quartile ($)
Median gross rent ($)
Urban houses (%)
Rural houses (%)
Houses occupied (%)
Houses occupied (% change since 2000)
Houses owner occupied (%)
Houses owner occupied (% change since 2000)
Houses renter occupied (%)
Houses renter occupied (% change since 2000)
Vacant housing units - For rent (%)
Vacant housing units - For rent (% change since 2000)
Vacant housing units - For sale only (%)
Vacant housing units - For sale only (% change since 2000)
Vacant housing units - Rented or sold, not occupied (%)
Vacant housing units - Rented or sold, not occupied (% change since 2000)
Vacant housing units - For seasonal, recreational, or occasional use (%)
Vacant housing units - For seasonal, recreational, or occasional use (% change since 2000)
Vacant housing units - For migrant workers (%)
Vacant housing units - For migrant workers (% change since 2000)
Vacant housing units - Other vacant (%)
Vacant housing units - Other vacant (% change since 2000)
Median monthly housing costs ($)
Median household income for houses/condos with a mortgage ($)
Median household income for houses/condos without a mortgage ($)
Median household income ($)
Median household income ($) - White
Median household income ($) - Black or African American
Median household income ($) - Asian
Median household income ($) - Hispanic or Latino
Median household income ($) - American Indian and Alaska Native
Median household income ($) - Multirace
Median household income ($) - Other Race
Mortgage status - with mortgage (%)
Mortgage status - with second mortgage (%)
Mortgage status - with home equity loan (%)
Mortgage status - with both second mortgage and home equity loan (%)
Mortgage status - without a mortgage (%)
Median year house/condo built
Median year apartment built
Household type by relationship - Male householder living alone (%)
Household type by relationship - Male householder not living alone (%)
Household type by relationship - Female householder living alone (%)
Household type by relationship - Female householder not living alone (%)
Household type by relationship - Opposite-Sex spouse (%)
Household type by relationship - Same-Sex spouse (%)
Household type by relationship - Opposite-Sex unmarried partner (%)
Household type by relationship - Same-Sex unmarried partner (%)
Household type by relationship - In group quarters (%)
Size of family households - 2-person household (%)
Size of family households - 3-person household (%)
Size of family households - 4-person household (%)
Size of family households - 5-person household (%)
Size of family households - 6-person household (%)
Size of family households - 7-or-more-person household (%)
Size of nonfamily households - 1-person household (%)
Size of nonfamily households - 2-person household (%)
Size of nonfamily households - 3-person household (%)
Size of nonfamily households - 4-person household (%)
Size of nonfamily households - 5-person household (%)
Size of nonfamily households - 6-person household (%)
Size of nonfamily households - 7-or-moreperson household (%)
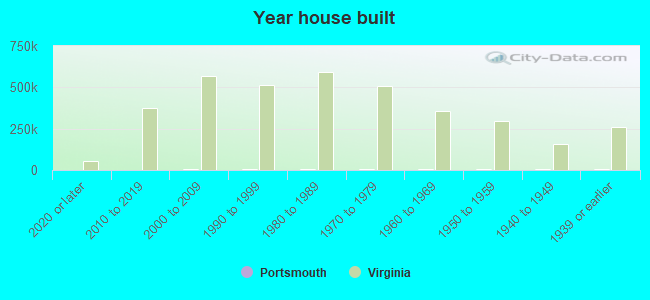
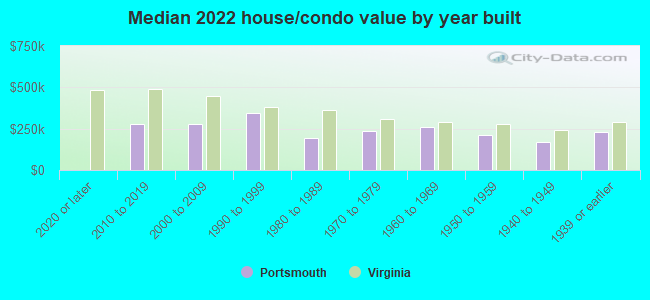
Year house built - Built 2010 or later (%)
Year house built - Built 2000 to 2009 (%)
Year house built - Built 1990 to 1999 (%)
Year house built - Built 1980 to 1989 (%)
Year house built - Built 1970 to 1979 (%)
Year house built - Built 1960 to 1969 (%)
Year house built - Built 1950 to 1959 (%)
Year house built - Built 1940 to 1949 (%)
Year house built - Built 1939 or earlier (%)
Median number of rooms in houses and condos
Median number of rooms in apartments
Median number of bedrooms in owner occupied houses
Mean number of bedrooms in owner occupied houses
Median number of bedrooms in renter occupied houses
Mean number of bedrooms in renter occupied houses
Median number of vehichles in owner occupied houses
Mean number of vehichles in owner occupied houses
Median number of vehichles in renter occupied houses
Mean number of vehichles in renter occupied houses
Rooms in owner-occupied houses - 1 room (%)
Rooms in owner-occupied houses - 2 rooms (%)
Rooms in owner-occupied houses - 3 rooms (%)
Rooms in owner-occupied houses - 4 rooms (%)
Rooms in owner-occupied houses - 5 rooms (%)
Rooms in owner-occupied houses - 6 rooms (%)
Rooms in owner-occupied houses - 7 rooms (%)
Rooms in owner-occupied houses - 8 rooms (%)
Rooms in owner-occupied houses - 9+ rooms (%)
Rooms in renter-occupied houses - 1 room (%)
Rooms in renter-occupied houses - 2 rooms (%)
Rooms in renter-occupied houses - 3 rooms (%)
Rooms in renter-occupied houses - 4 rooms (%)
Rooms in renter-occupied houses - 5 rooms (%)
Rooms in renter-occupied houses - 6 rooms (%)
Rooms in renter-occupied houses - 7 rooms (%)
Rooms in renter-occupied houses - 8 rooms (%)
Rooms in renter-occupied houses - 9+ rooms (%)
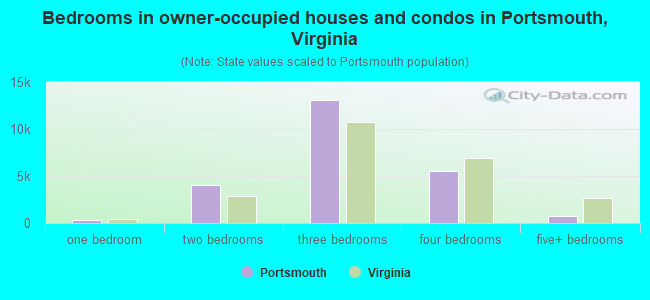
Bedrooms in owner-occupied houses - no bedrooms (%)
Bedrooms in owner-occupied houses - 1 bedroom (%)
Bedrooms in owner-occupied houses - 2 bedrooms (%)
Bedrooms in owner-occupied houses - 3 bedrooms (%)
Bedrooms in owner-occupied houses - 4 bedrooms (%)
Bedrooms in owner-occupied houses - 5+ bedrooms (%)
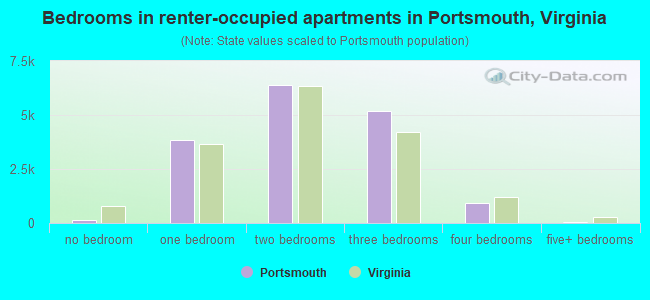
Bedrooms in renter-occupied houses - no bedrooms (%)
Bedrooms in renter-occupied houses - 1 bedroom (%)
Bedrooms in renter-occupied houses - 2 bedrooms (%)
Bedrooms in renter-occupied houses - 3 bedrooms (%)
Bedrooms in renter-occupied houses - 4 bedrooms (%)
Bedrooms in renter-occupied houses - 5+ bedrooms (%)
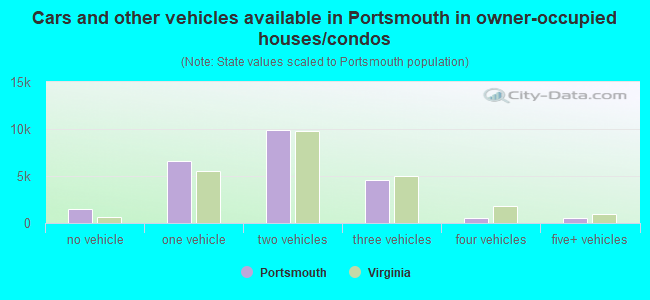
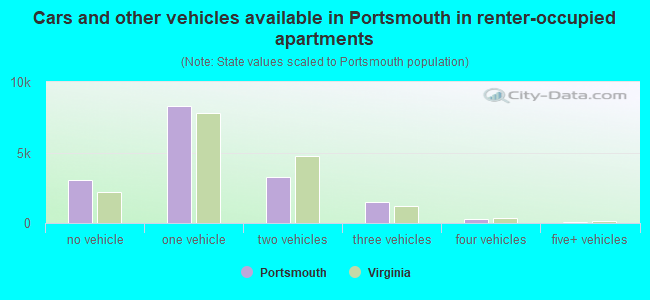
Vehicles available in owner-occupied houses - no vehicle available (%)
Vehicles available in owner-occupied houses - 1 vehicle available(%)
Vehicles available in owner-occupied houses - 2 Vehicles available (%)
Vehicles available in owner-occupied houses - 3 Vehicles available (%)
Vehicles available in owner-occupied houses - 4 Vehicles available (%)
Vehicles available in owner-occupied houses - 5+ Vehicles available (%)
Vehicles available in renter-occupied houses - no vehicle available (%)
Vehicles available in renter-occupied houses - 1 vehicle available (%)
Vehicles available in renter-occupied houses - 2 Vehicles available (%)
Vehicles available in renter-occupied houses - 3 Vehicles available (%)
Vehicles available in renter-occupied houses - 4 Vehicles available (%)
Vehicles available in renter-occupied houses - 5+ Vehicles available (%)
Housing units in structures - 1, detached (%)
Housing units in structures - 1, attached (%)
Housing units in structures - 2 (%)
Housing units in structures - 3 or 4 (%)
Housing units in structures - 5 to 9 (%)
Housing units in structures - 10 to 19 (%)
Housing units in structures - 20 to 49 (%)
Housing units in structures - 50 or more (%)
Housing units in structures - Mobile home (%)
Housing units in structures - Boat, RV, van, etc. (%)
Housing units in structures - Owners - 1, detached (%)
Housing units in structures - Owners - 1, attached (%)
Housing units in structures - Owners - 2 (%)
Housing units in structures - Owners - 3 or 4 (%)
Housing units in structures - Owners - 5 to 9 (%)
Housing units in structures - Owners - 10 to 19 (%)
Housing units in structures - Owners - 20 to 49 (%)
Housing units in structures - Owners - 50 or more (%)
Housing units in structures - Owners - Mobile home (%)
Housing units in structures - Owners - Boat, RV, van, etc. (%)
Housing units in structures - Renters - 1, detached (%)
Housing units in structures - Renters - 1, attached (%)
Housing units in structures - Renters - 2 (%)
Housing units in structures - Renters - 3 or 4 (%)
Housing units in structures - Renters - 5 to 9 (%)
Housing units in structures - Renters - 10 to 19 (%)
Housing units in structures - Renters - 20 to 49 (%)
Housing units in structures - Renters - 50 or more (%)
Housing units in structures - Renters - Mobile home (%)
Housing units in structures - Renters - Boat, RV, van, etc. (%)
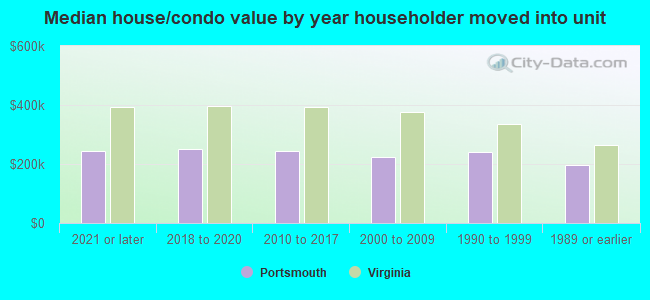
House/condo owner moved in on average (years ago)
Renter moved in on average (years ago)
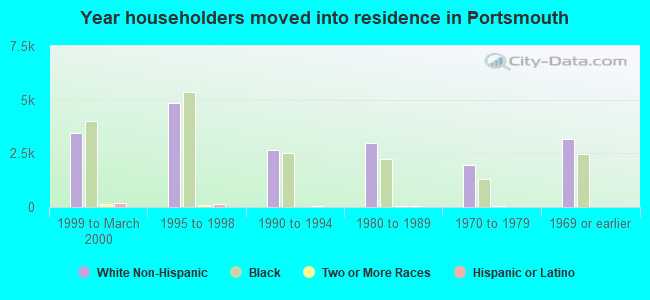
Year householder moved into unit - Moved in 1999 to March 2000 (%)
Year householder moved into unit - Moved in 1999 to March 2000 (%) - White
Year householder moved into unit - Moved in 1999 to March 2000 (%) - Black or African American
Year householder moved into unit - Moved in 1999 to March 2000 (%) - Asian
Year householder moved into unit - Moved in 1999 to March 2000 (%) - Hispanic or Latino
Year householder moved into unit - Moved in 1999 to March 2000 (%) - American Indian and Alaska Native
Year householder moved into unit - Moved in 1999 to March 2000 (%) - Multirace
Year householder moved into unit - Moved in 1999 to March 2000 (%) - Other Race
Year householder moved into unit - Moved in 1995 to 1998 (%)
Year householder moved into unit - Moved in 1995 to 1998 (%) - White
Year householder moved into unit - Moved in 1995 to 1998 (%) - Black or African American
Year householder moved into unit - Moved in 1995 to 1998 (%) - Asian
Year householder moved into unit - Moved in 1995 to 1998 (%) - Hispanic or Latino
Year householder moved into unit - Moved in 1995 to 1998 (%) - American Indian and Alaska Native
Year householder moved into unit - Moved in 1995 to 1998 (%) - Multirace
Year householder moved into unit - Moved in 1995 to 1998 (%) - Other Race
Year householder moved into unit - Moved in 1990 to 1994 (%)
Year householder moved into unit - Moved in 1990 to 1994 (%) - White
Year householder moved into unit - Moved in 1990 to 1994 (%) - Black or African American
Year householder moved into unit - Moved in 1990 to 1994 (%) - Asian
Year householder moved into unit - Moved in 1990 to 1994 (%) - Hispanic or Latino
Year householder moved into unit - Moved in 1990 to 1994 (%) - American Indian and Alaska Native
Year householder moved into unit - Moved in 1990 to 1994 (%) - Multirace
Year householder moved into unit - Moved in 1990 to 1994 (%) - Other Race
Year householder moved into unit - Moved in 1980 to 1989 (%)
Year householder moved into unit - Moved in 1980 to 1989 (%) - White
Year householder moved into unit - Moved in 1980 to 1989 (%) - Black or African American
Year householder moved into unit - Moved in 1980 to 1989 (%) - Asian
Year householder moved into unit - Moved in 1980 to 1989 (%) - Hispanic or Latino
Year householder moved into unit - Moved in 1980 to 1989 (%) - American Indian and Alaska Native
Year householder moved into unit - Moved in 1980 to 1989 (%) - Multirace
Year householder moved into unit - Moved in 1980 to 1989 (%) - Other Race
Year householder moved into unit - Moved in 1970 to 1979 (%)
Year householder moved into unit - Moved in 1970 to 1979 (%) - White
Year householder moved into unit - Moved in 1970 to 1979 (%) - Black or African American
Year householder moved into unit - Moved in 1970 to 1979 (%) - Asian
Year householder moved into unit - Moved in 1970 to 1979 (%) - Hispanic or Latino
Year householder moved into unit - Moved in 1970 to 1979 (%) - American Indian and Alaska Native
Year householder moved into unit - Moved in 1970 to 1979 (%) - Multirace
Year householder moved into unit - Moved in 1970 to 1979 (%) - Other Race
Year householder moved into unit - Moved in 1969 or earlier (%)
Year householder moved into unit - Moved in 1969 or earlier (%) - White
Year householder moved into unit - Moved in 1969 or earlier (%) - Black or African American
Year householder moved into unit - Moved in 1969 or earlier (%) - Asian
Year householder moved into unit - Moved in 1969 or earlier (%) - Hispanic or Latino
Year householder moved into unit - Moved in 1969 or earlier (%) - American Indian and Alaska Native
Year householder moved into unit - Moved in 1969 or earlier (%) - Multirace
Year householder moved into unit - Moved in 1969 or earlier (%) - Other Race
Housing units lacking complete plumbing facilities (%)
Housing units lacking complete kitchen facilities (%)
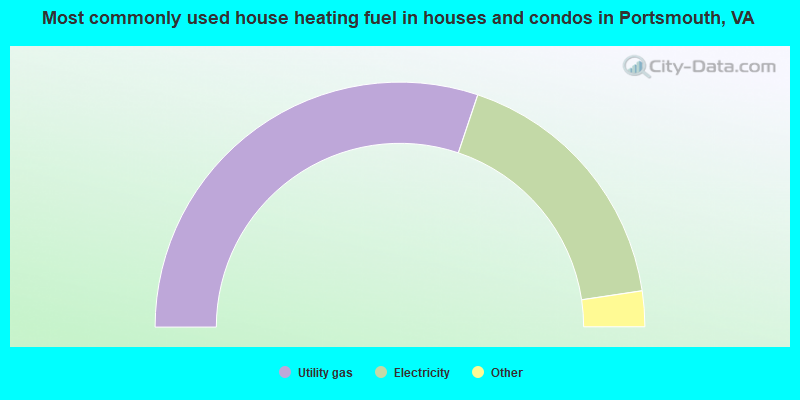
House heating fuel used in houses and condos - Utility gas (%)
House heating fuel used in houses and condos - Bottled, tank, or LP gas (%)
House heating fuel used in houses and condos - Electricity (%)
House heating fuel used in houses and condos - Fuel oil, kerosene, etc. (%)
House heating fuel used in houses and condos - Coal or coke (%)
House heating fuel used in houses and condos - Wood (%)
House heating fuel used in houses and condos - Solar energy (%)
House heating fuel used in houses and condos - Other fuel (%)
House heating fuel used in houses and condos - No fuel used (%)
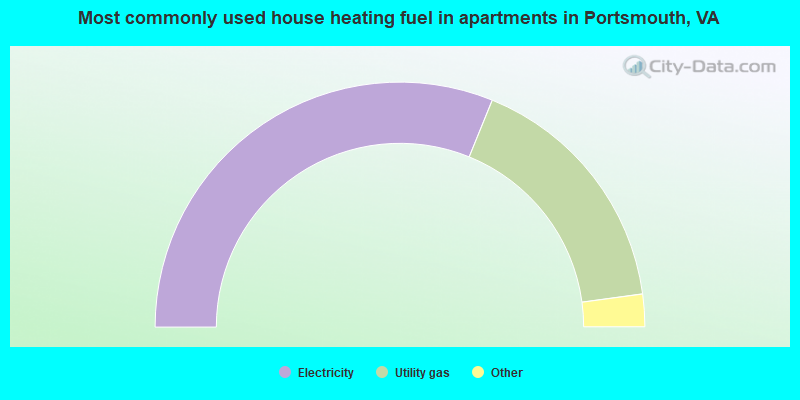
House heating fuel used in apartments - Utility gas (%)
House heating fuel used in apartments - Bottled, tank, or LP gas (%)
House heating fuel used in apartments - Electricity (%)
House heating fuel used in apartments - Fuel oil, kerosene, etc. (%)
House heating fuel used in apartments - Coal or coke (%)
House heating fuel used in apartments - Wood (%)
House heating fuel used in apartments - Solar energy (%)
House heating fuel used in apartments - Other fuel (%)
House heating fuel used in apartments - No fuel used (%)
Latest news about housing in Portsmouth, VA collected exclusively by city-data.com from local newspapers, TV, and radio stations
Median year house/condo built: 1964Median year apartment built: 1975Household type by relationship:
Households: 97,029
Male householders: 17,355 (6,542 living alone ), Female householders: 22,823 (8,122 living alone )12,947 spouses (12,923 opposite-sex spouses ), 2,593 unmarried partners , (2,258 opposite-sex unmarried partners ), 29,902 children (27,630 natural , 1,194 adopted , 1,078 stepchildren ), 3,675 grandchildren , 990 brothers or sisters , 1,036 parents , 81 foster children , 770 other relatives , 2,116 non-relatives In group quarters: 2,741
Size of family households: 9,780 2-persons , 6,406 3-persons , 3,711 4-persons , 1,353 5-persons , 1,387 6-persons , 571 7-or-more-persons .
Size of nonfamily households: 14,664 1-person , 2,249 2-persons , 57 4-persons .
8,682 married couples with children. single-parent households (2,147 men , 8,634 women ).
94.6% of residents of Portsmouth speak English at home. of residents speak Spanish at home (65% speak English very well , 25% speak English well , 9% speak English not well , 1% don't speak English at all ).of residents speak other Indo-European language at home (87% speak English very well , 8% speak English well , 5% speak English not well ).of residents speak Asian or Pacific Island language at home (63% speak English very well , 23% speak English well , 11% speak English not well , 4% don't speak English at all ).of residents speak other language at home (72% speak English very well , 16% speak English well , 12% speak English not well ).
Foreign born population: 2,685 (2.8%)of them are naturalized citizens )
Median number of rooms in houses and condos:
Median number of rooms in apartments
Owner-occupied Renter-occupied
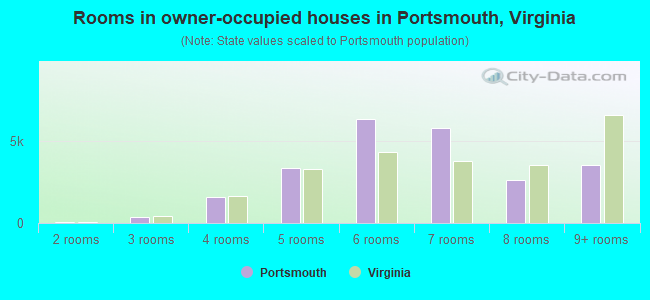
Rooms in owner-occupied houses in Portsmouth, Virginia
44 1 room 74 2 rooms 345 3 rooms 1,574 4 rooms 3,333 5 rooms 6,324 6 rooms 5,806 7 rooms 2,651 8 rooms 3,536 9+ rooms
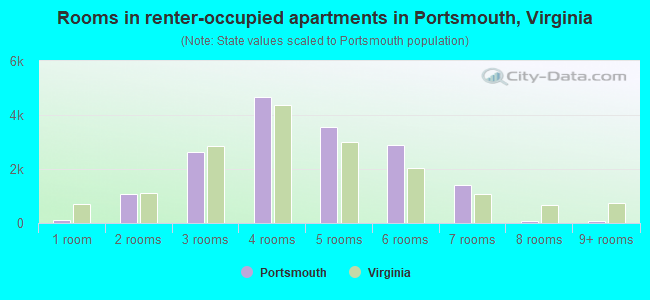
Rooms in renter-occupied apartments in Portsmouth, Virginia
117 1 room 1,065 2 rooms 2,641 3 rooms 4,660 4 rooms 3,555 5 rooms 2,894 6 rooms 1,424 7 rooms 77 8 rooms 58 9+ rooms
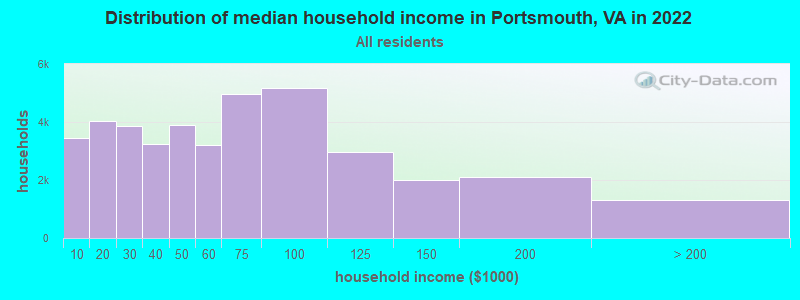
Portsmouth, VA household income distribution 3,452 Less than $10,0004,049 $10,000 to $19,9993,848 $20,000 to $29,9993,226 $30,000 to $39,9993,884 $40,000 to $49,9993,206 $50,000 to $59,9994,957 $60,000 to $74,9995,162 $75,000 to $99,9992,965 $100,000 to $124,9992,015 $125,000 to $149,9992,096 $150,000 to $199,9991,318 $200,000 or more
Home value of owner - occupied houses in 2022 in Portsmouth, VA 150 Less than $10,00089 $10,000 to $14,999136 $15,000 to $19,99963 $20,000 to $24,99946 $25,000 to $29,99925 $30,000 to $34,99921 $35,000 to $39,99922 $40,000 to $49,99974 $50,000 to $59,99949 $60,000 to $69,999142 $70,000 to $79,999157 $80,000 to $89,999180 $90,000 to $99,9991,483 $100,000 to $124,9991,300 $125,000 to $149,9992,343 $150,000 to $174,9992,053 $175,000 to $199,9994,194 $200,000 to $249,9993,388 $250,000 to $299,9993,017 $300,000 to $399,999840 $400,000 to $499,999406 $500,000 to $749,999109 $750,000 to $999,99987 $1,000,000 to $1,499,9997 $1,500,000 to $1,999,99956 $2,000,000 or moreRent paid by renters in 2022 in Portsmouth, VA 55 Less than $100280 $100 to $149126 $150 to $199257 $200 to $24999 $250 to $299423 $400 to $449201 $550 to $599159 $600 to $649463 $650 to $699852 $700 to $749401 $750 to $7991,333 $800 to $8992,409 $900 to $9994,829 $1,000 to $1,2491,751 $1,250 to $1,4992,062 $1,500 to $1,999220 $2,000 to $2,499571 No cash rent
Percentage of workers working in this county: 42.4%Number of people working at home: 3,922 (8.6% of all workers )
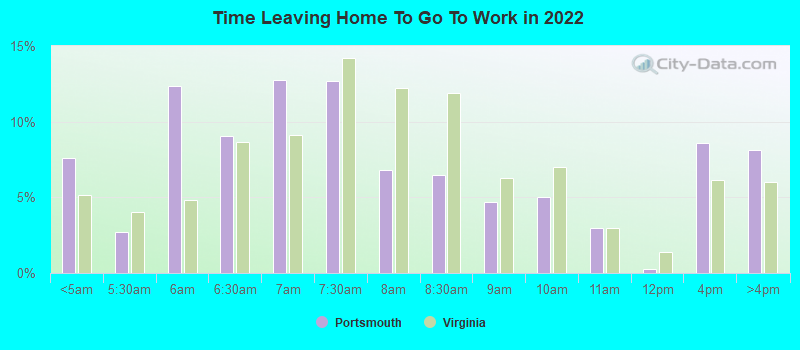
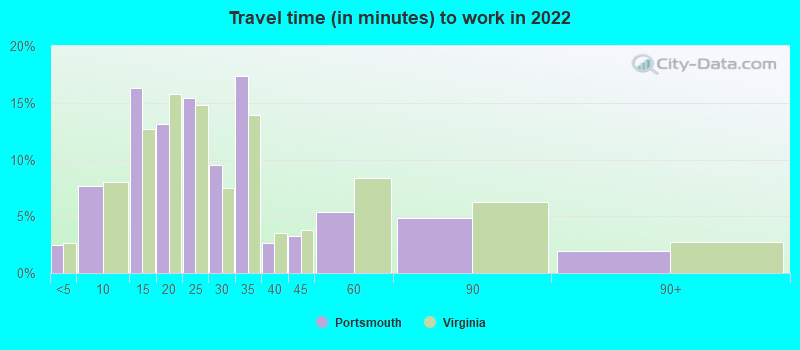
Travel time to work (commute)
Less than 5 minutes: 1,5395 to 9 minutes: 3,46010 to 14 minutes: 6,49515 to 19 minutes: 7,73420 to 24 minutes: 5,60525 to 29 minutes: 2,35630 to 34 minutes: 6,93835 to 39 minutes: 1,32040 to 44 minutes: 37945 to 59 minutes: 3,29260 to 89 minutes: 1,03290 or more minutes: 485
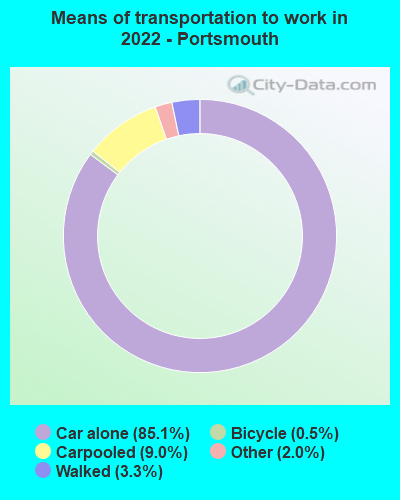
Means of transportation to work:
Drove a car alone: 41,568 (78.6%)Carpooled: 4,414 (8.3%)Bus : 13 (0.0%)Taxi: 963 (1.8%)Bicycle: 255 (0.5%)Walked: 1,621 (3.1%)Worked at home: 4,058 (7.7%)
Unemployment by race in 2022
Unemployment rate for White non-Hispanic residents 4.1% Males6.7% FemalesUnemployment rate for Black residents 19.4% Males6.2% FemalesUnemployment rate for American Indian and Alaska Native residents 73.8% FemalesUnemployment rate for Asian residents 3.6% FemalesUnemployment rate for other race residents 18.9% FemalesUnemployment rate for two or more race residents 2.4% Males2.6% FemalesUnemployment rate for Hispanic or Latino residents 9.6% Females
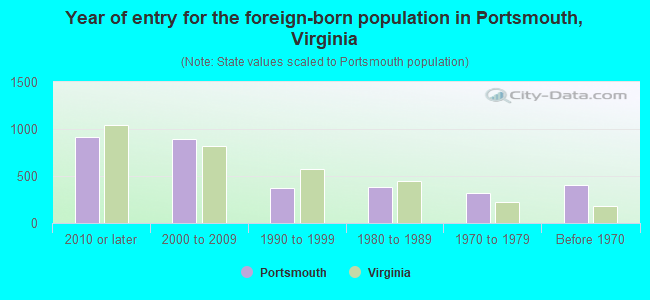
Year of entry for the foreign-born population in Portsmouth, Virginia
917 2010 or later 890 2000 to 2009 368 1990 to 1999 388 1980 to 1989 322 1970 to 1979 400 Before 1970
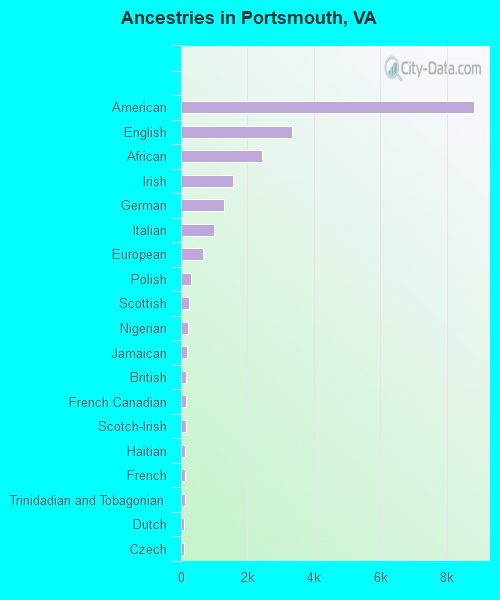
First ancestries reported:
American: 8,837 (15.0%)
English: 3,342 (5.7%)
African: 2,440 (4.2%)
Irish: 1,573 (2.7%)
German: 1,283 (2.2%)
Italian: 995 (1.7%)
European: 671 (1.1%)
Polish: 290 (0.5%)
Scottish: 237 (0.4%)
Nigerian: 201 (0.3%)
Jamaican: 167 (0.3%)
British: 153 (0.3%)
French Canadian: 150 (0.3%)
Scotch-Irish: 141 (0.2%)
Haitian: 122 (0.2%)
French: 113 (0.2%)
Trinidadian and Tobagonian: 109 (0.2%)
Dutch: 92 (0.2%)
Czech: 82 (0.1%)
Iraqi: 76 (0.1%)
Romanian: 57 (0.10%)
Ukrainian: 56 (0.10%)
Portuguese: 50 (0.09%)
Greek: 49 (0.08%)
Welsh: 48 (0.08%)
Hungarian: 45 (0.08%)
British West Indian: 41 (0.07%)
Swedish: 37 (0.06%)
Canadian: 34 (0.06%)
Norwegian: 32 (0.05%)
U.S. Virgin Islander: 31 (0.05%)
Eastern European: 30 (0.05%)
Russian: 29 (0.05%)
Egyptian: 26 (0.04%)
Austrian: 22 (0.04%)
Slovak: 19 (0.03%)
Armenian: 18 (0.03%)
Afghan: 14 (0.02%)
New Zealander: 13 (0.02%)
Danish: 13 (0.02%)
Scandinavian: 13 (0.02%)
Swiss: 11 (0.02%)
West Indian: 11 (0.02%)
Finnish: 10 (0.02%)
Palestinian: 10 (0.02%)
Brazilian: 7 (0.01%)
Croatian: 6 (0.01%)
Cajun: 6 (0.01%)
Australian: 6 (0.01%)
Northern European: 5 (0.01%)
Slavic: 4 (0.01%)
Moroccan: 4 (0.01%)
Ugandan: 3 (0.01%)
Most common places of birth for foreign-born residents (%): Mexico Portsmouth:
19.0% (585)Virginia:
5.3% (57,498)
Philippines Portsmouth:
10.1% (312)Virginia:
4.8% (52,629)
China, excluding Hong Kong and Taiwan Portsmouth:
7.8% (240)Virginia:
3.9% (42,989)
Germany Portsmouth:
4.2% (130)Virginia:
1.7% (18,227)
Jamaica Portsmouth:
4.2% (128)Virginia:
1.0% (10,734)
Trinidad and Tobago Portsmouth:
3.6% (111)Virginia:
0.4% (4,211)
Nigeria Portsmouth:
2.7% (82)Virginia:
0.6% (6,956)
Korea Portsmouth:
2.5% (76)Virginia:
4.9% (52,857)
Nicaragua Portsmouth:
2.4% (74)Virginia:
0.6% (6,916)
Canada Portsmouth:
2.1% (66)Virginia:
1.2% (12,984)
Oceania, n.e.c. Portsmouth:
2.0% (62)Virginia:
0.0% (309)
Venezuela Portsmouth:
2.0% (61)Virginia:
0.8% (8,186)
Pakistan Portsmouth:
1.9% (60)Virginia:
2.3% (24,582)
Taiwan Portsmouth:
1.8% (57)Virginia:
0.6% (7,042)
Guatemala Portsmouth:
1.8% (57)Virginia:
3.3% (35,938)
Iraq Portsmouth:
1.8% (57)Virginia:
0.9% (9,351)
Italy Portsmouth:
1.6% (50)Virginia:
0.5% (5,147)
Place of birth for U.S.-born residents:
This state: 62,455Other state: 30,920Northeast: 8,469Midwest: 3,956South: 14,875West: 3,620 83.5% of Portsmouth residents lived in the same house 1 years ago.
Out of people who lived in different houses, 22.8% lived in this county.
Out of people who lived in different counties, 64.2% lived in Virginia.
Portsmouth:
83.5%State average:
86.6%
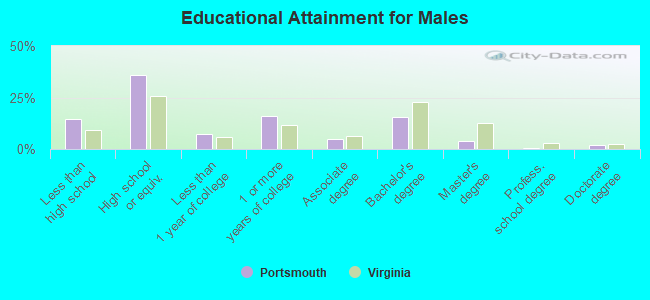
Education attainment for males 25 years and older:
No schooling: 618Nursery to 4th grade: 445th and 6th grade: 07th and 8th grade: 2169th grade: 40810th grade: 1,29111th grade: 59712th grade, no diploma: 1,039High school graduate (or equivalency): 10,506Less than 1 year of college: 2,174Some college more than 1 year, no degree: 4,621Associate degree: 1,341Bachelor's degree: 4,455Master's degree: 1,095Professional school degree: 112Doctorate degree: 538
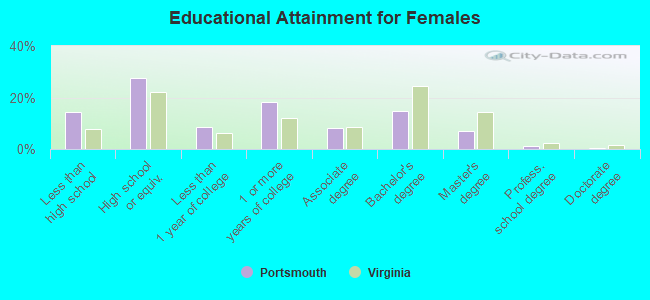
Education attainment for females 25 years and older:
No schooling: 651Nursery to 4th grade: 05th and 6th grade: 1957th and 8th grade: 8129th grade: 73710th grade: 70311th grade: 50112th grade, no diploma: 1,290High school graduate (or equivalency): 9,364Less than 1 year of college: 2,858Some college more than 1 year, no degree: 6,164Associate degree: 2,704Bachelor's degree: 5,041Master's degree: 2,355Professional school degree: 438Doctorate degree: 118
Housing units in structures:
One, detached: 26,621One, attached: 4,646Two: 1,0693 or 4: 2,5325 to 9: 3,59910 to 19: 2,33620 to 49: 84050 or more: 1,391Mobile homes: 276Boats, RVs, vans, etc.: 84Median worth of mobile homes: $55,000
Housing units lacking complete plumbing facilities in 2022: 1.3%Housing units lacking complete kitchen facilities in 2022: 1.5%House/condo owner moved in on average 11 years ago
Renter moved in on average 3 years ago
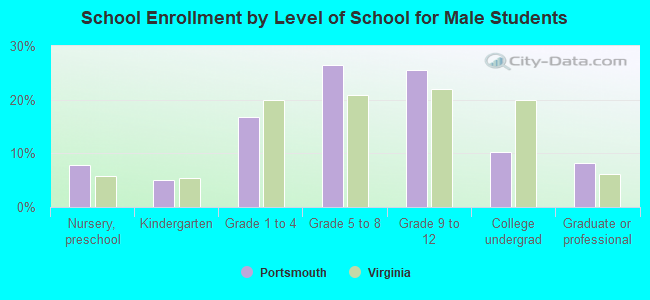
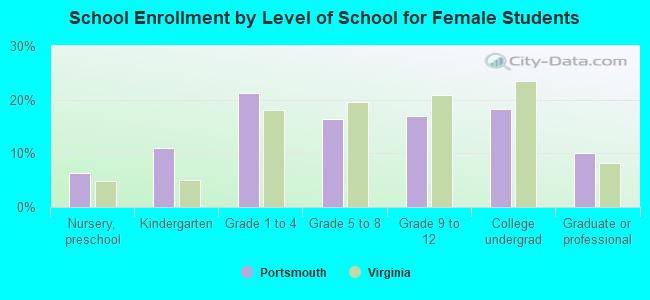
Private vs. public school enrollment:
Students in private schools in grades 1 to 8 (elementary and middle school): 1,200 Students in private schools in grades 9 to 12 (high school): 579 Students in private undergraduate colleges: 899