Reinbeck, IA (Iowa) Houses and Residents
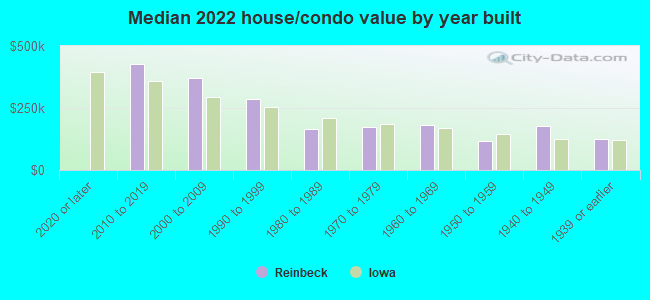
| Reinbeck: | $159,238 |
| Iowa: | $194,600 |
Total population: 1,639 (Urban population: 0, Rural population: 1,742 (7 farm, 1,735 nonfarm))
Houses: 827 (771 occupied: 628 owner occupied, 155 renter occupied)
| % of renters here: | 20% |
| State: | 28% |
Housing density: 455 houses/condos per square mile
Median price asked for vacant for-sale houses and condos in 2022 in this county: $86,650.
Median contract rent in 2022: $516 (lower quartile is $461, upper quartile is $755)
Median rent asked for vacant for-rent units in 2022: $989
Median gross rent in Reinbeck, IA in 2022: $653
Housing units in Reinbeck with a mortgage: 365 (83 second mortgage, 0 home equity loan, 83 both second mortgage and home equity loan)
Houses without a mortgage: 7
Median household income for houses/condos with a mortgage: $109,995
Median household income for apartments without a mortgage: $77,103
Median monthly housing costs: $896
Compare current foreclosures near Reinbeck, IA:
| Photo | Address | Area | Beds / Baths | Price | Details |
|---|---|---|---|---|---|

|
#1
Norwood St
Reinbeck, IA 50669
|
2,097 sq. feet
|
1 baths 4 beds |
show details | |

|
#2
Eastgate Dr
Reinbeck, IA 50669
|
- sq. feet
|
- baths - beds |
show details | |

|
#3
Bertch Ave
Waterloo, IA 50702
|
1,013 sq. feet
|
1 baths 2 beds |
$127,500
|
show details |

|
#4
Watters Rd
Hudson, IA 50643
|
1,874 sq. feet
|
3 baths 3 beds |
show details | |

|
#5
Washington St
Gladbrook, IA 50635
|
2,217 sq. feet
|
2 baths 4 beds |
show details | |

|
#6
W 9th St
Cedar Falls, IA 50613
|
983 sq. feet
|
1 baths 2 beds |
show details | |

|
#7
7th St
Gladbrook, IA 50635
|
1,292 sq. feet
|
1 baths 3 beds |
show details | |

|
#8
Colfax St
Holland, IA 50642
|
1,534 sq. feet
|
1 baths 3 beds |
show details | |

|
#9
W 7th St
Waterloo, IA 50702
|
964 sq. feet
|
1 baths 2 beds |
show details | |

|
#10
Campbell Ave
Waterloo, IA 50701
|
1,206 sq. feet
|
1 baths 3 beds |
show details |
| Photo | Address | Area | Beds / Baths | Price | Details |
|---|---|---|---|---|---|

|
#11
Downing Ave
Waterloo, IA 50701
|
1,268 sq. feet
|
1 baths 3 beds |
show details | |

|
#12
Downing Ave
Waterloo, IA 50701
|
1,144 sq. feet
|
1 baths 4 beds |
show details | |

|
#13
Sager Ave
Waterloo, IA 50701
|
932 sq. feet
|
2 baths 2 beds |
show details | |

|
#14
Kingsley Ave
Waterloo, IA 50701
|
1,004 sq. feet
|
3 baths 2 beds |
show details | |

|
#15
Alameda St
Cedar Falls, IA 50613
|
1,650 sq. feet
|
1 baths 3 beds |
show details | |

|
#16
Lindner Dr
Waterloo, IA 50702
|
1,580 sq. feet
|
1 baths 3 beds |
show details | |

|
#17
Moir St
Waterloo, IA 50701
|
1,280 sq. feet
|
2 baths 3 beds |
show details | |

|
#18
Rainbow Dr
Cedar Falls, IA 50613
|
958 sq. feet
|
1 baths 2 beds |
show details | |

|
#19
Saint Andrews Ave
Waterloo, IA 50701
|
1,418 sq. feet
|
2 baths 2 beds |
show details | |

|
#20
Orchard Dr
Cedar Falls, IA 50613
|
1,363 sq. feet
|
2 baths 3 beds |
show details |
| Photo | Address | Area | Beds / Baths | Price | Details |
|---|---|---|---|---|---|

|
#21
Norris Ct
Waterloo, IA 50701
|
1,435 sq. feet
|
1 baths 3 beds |
show details | |

|
#22
Rachael St
Waterloo, IA 50701
|
1,552 sq. feet
|
2 baths 2 beds |
show details | |

|
#23
W 4th St
Waterloo, IA 50701
|
1,866 sq. feet
|
2 baths 3 beds |
show details | |

|
#24
Byron Ave
Waterloo, IA 50702
|
752 sq. feet
|
1 baths 2 beds |
show details | |

|
#25
Randolph St
Waterloo, IA 50702
|
1,024 sq. feet
|
1 baths 3 beds |
show details | |

|
#26
Letsch Rd
Waterloo, IA 50701
|
1,204 sq. feet
|
2 baths 3 beds |
show details | |

|
#27
Quesada Ave
Cedar Falls, IA 50613
|
2,004 sq. feet
|
2 baths 2 beds |
show details | |

|
#28
Country Ln
Waterloo, IA 50701
|
1,747 sq. feet
|
2 baths 3 beds |
show details | |

|
#29
Denver St
Waterloo, IA 50702
|
1,952 sq. feet
|
3 baths 3 beds |
show details | |

|
#30
Rainbow Dr
Waterloo, IA 50701
|
- sq. feet
|
- baths - beds |
show details |
| Photo | Address | Area | Beds / Baths | Price | Details |
|---|---|---|---|---|---|

|
#31
Eureka St
Waterloo, IA 50702
|
- sq. feet
|
- baths - beds |
show details | |

|
#32
Saint Francis Dr Apt 10
Waterloo, IA 50702
|
- sq. feet
|
- baths - beds |
show details | |

|
#33
Pearl St
Cedar Falls, IA 50613
|
- sq. feet
|
- baths - beds |
show details | |

|
#34
Sager Ave
Waterloo, IA 50701
|
- sq. feet
|
- baths - beds |
show details | |

|
#35
Franklin St Apt 1
Cedar Falls, IA 50613
|
- sq. feet
|
- baths - beds |
show details | |

|
#36
Darlene Ct Apt 1
Waterloo, IA 50701
|
- sq. feet
|
- baths - beds |
show details | |

|
#37
Russell Rd Apt 1
Waterloo, IA 50701
|
- sq. feet
|
- baths - beds |
show details | |

|
#38
Bluegrass Cir, Unit 112
Cedar Falls, IA 50613
|
- sq. feet
|
- baths - beds |
show details | |

|
#39
Union Rd Lot 36
Cedar Falls, IA 50613
|
- sq. feet
|
- baths - beds |
show details | |

|
#40
170th St
Dysart, IA 52224
|
- sq. feet
|
- baths - beds |
show details |
| Photo | Address | Area | Beds / Baths | Price | Details |
|---|---|---|---|---|---|

|
#41
5th St
Gladbrook, IA 50635
|
- sq. feet
|
- baths - beds |
show details | |

|
#42
4th St
Hudson, IA 50643
|
- sq. feet
|
- baths - beds |
show details | |

|
#43
Fletcher Ave
Waterloo, IA 50701
|
- sq. feet
|
- baths - beds |
show details | |

|
#44
220th St
Gladbrook, IA 50635
|
- sq. feet
|
- baths - beds |
show details | |

|
Check over 1 million property listings on Foreclosure.com!
|
browse all offers | |||

Latest news about housing in Reinbeck, IA collected exclusively by city-data.com from local newspapers, TV, and radio stations

 | Cedar falls area and small towns (8 replies) |
| moving to Waterloo/cedar falls area (17 replies) |
Median year apartment built: 1974
Household type by relationship:
Households: 1,790- Male householders: 405 (113 living alone), Female householders: 357 (121 living alone)
403 spouses (403 opposite-sex spouses), 50 unmarried partners, (46 opposite-sex unmarried partners), 495 children (476 natural, 5 adopted, 14 stepchildren), 13 grandchildren, 9 brothers or sisters, 14 parents, 0 foster children, 2 other relatives, 6 non-relatives
- In group quarters: 34
Size of family households: 224 2-persons, 101 3-persons, 119 4-persons, 49 5-persons, 17 6-persons.
Size of nonfamily households: 244 1-person, 19 2-persons, 3 3-persons.
290 married couples with children.
67 single-parent households (29 men, 38 women).
97.8% of residents of Reinbeck speak English at home.
1.2% of residents speak Spanish at home (14% speak English very well, 76% speak English not well, 10% don't speak English at all).
0.8% of residents speak other Indo-European language at home (100% speak English very well).
0.2% of residents speak other language at home (100% speak English very well).
Foreign born population: 43 (2.4%)
(72.1% of them are naturalized citizens)
| Here: | 6.5 |
| State: | 6.8 |
| Here: | 4.2 |
| State: | 4.2 |
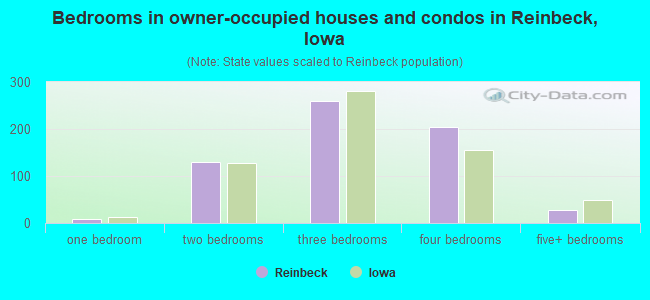
- Bedrooms in owner-occupied houses and condos in Reinbeck, Iowa
- 0no bedroom
- 81 bedroom
- 1292 bedrooms
- 2593 bedrooms
- 2054 bedrooms
- 275+ bedrooms
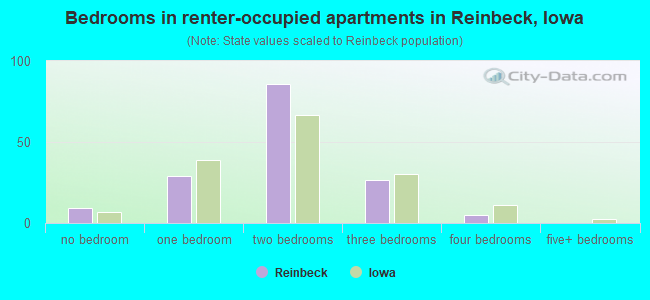
- Bedrooms in renter-occupied apartments in Reinbeck, Iowa
- 9no bedroom
- 291 bedroom
- 862 bedrooms
- 273 bedrooms
- 54 bedrooms
- 05+ bedrooms
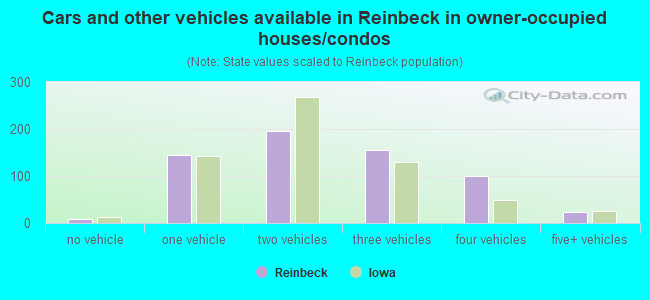
- Cars and other vehicles available in Reinbeck in owner-occupied houses/condos
- 9no vehicle
- 1441 vehicle
- 1952 vehicles
- 1563 vehicles
- 1014 vehicles
- 235+ vehicles
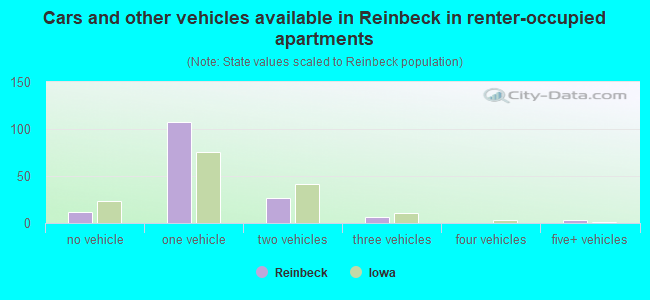
- Cars and other vehicles available in Reinbeck in renter-occupied apartments
- 12no vehicle
- 1071 vehicle
- 272 vehicles
- 63 vehicles
- 04 vehicles
- 35+ vehicles
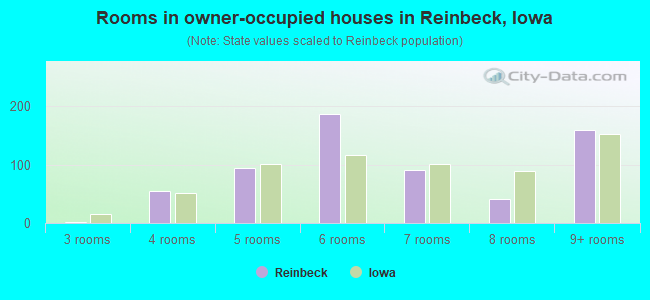
- Rooms in owner-occupied houses in Reinbeck, Iowa
- 01 room
- 02 rooms
- 23 rooms
- 544 rooms
- 955 rooms
- 1866 rooms
- 917 rooms
- 418 rooms
- 1609+ rooms
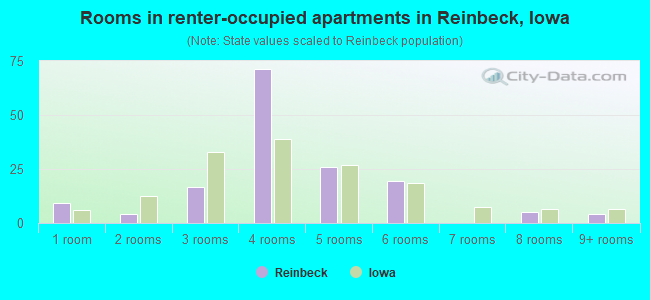
- Rooms in renter-occupied apartments in Reinbeck, Iowa
- 91 room
- 42 rooms
- 173 rooms
- 714 rooms
- 265 rooms
- 206 rooms
- 07 rooms
- 58 rooms
- 49+ rooms
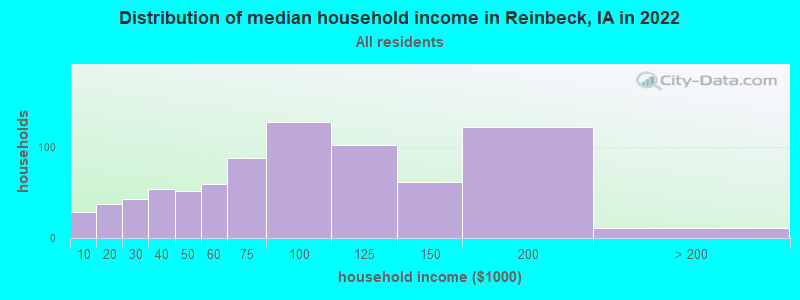
Reinbeck, IA household income distribution

- 29Less than $10,000
- 37$10,000 to $19,999
- 43$20,000 to $29,999
- 54$30,000 to $39,999
- 52$40,000 to $49,999
- 59$50,000 to $59,999
- 88$60,000 to $74,999
- 127$75,000 to $99,999
- 102$100,000 to $124,999
- 61$125,000 to $149,999
- 121$150,000 to $199,999
- 11$200,000 or more
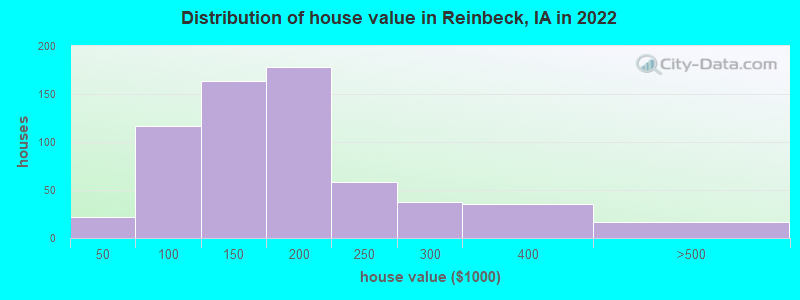
Home value of owner - occupied houses in 2022 in Reinbeck, IA
-
- 0$25,000 to $29,999
- 21$40,000 to $49,999
- 10$50,000 to $59,999
- 13$60,000 to $69,999
- 25$70,000 to $79,999
- 12$80,000 to $89,999
- 33$90,000 to $99,999
- 111$100,000 to $124,999
- 52$125,000 to $149,999
- 146$150,000 to $174,999
- 31$175,000 to $199,999
- 57$200,000 to $249,999
- 38$250,000 to $299,999
- 34$300,000 to $399,999
- 14$400,000 to $499,999
- 2$500,000 to $749,999
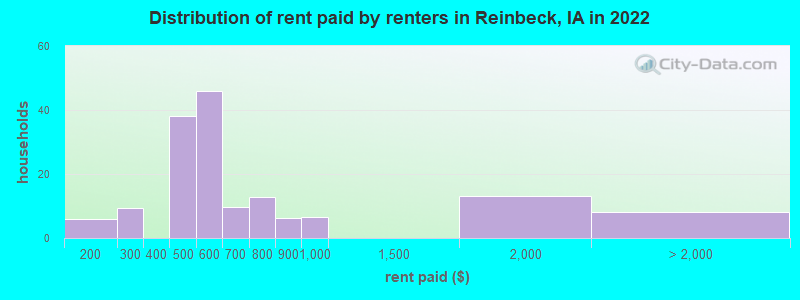
Rent paid by renters in 2022 in Reinbeck, IA
-
- 3$100 to $149
- 2$150 to $199
- 6$200 to $249
- 2$250 to $299
- 20$400 to $449
- 17$450 to $499
- 44$500 to $549
- 0$550 to $599
- 3$600 to $649
- 6$650 to $699
- 12$750 to $799
- 6$800 to $899
- 6$900 to $999
- 13$1,500 to $1,999
- 8No cash rent
Percentage of workers working in this county: 52.1%
Number of people working at home: 44 (5.1% of all workers)
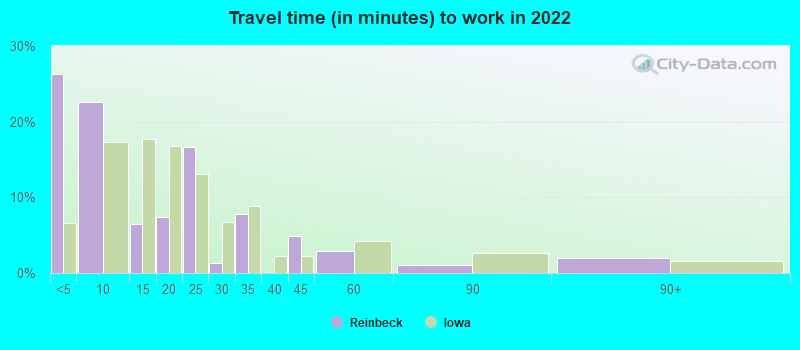
Travel time to work (commute)
- Less than 5 minutes: 180
- 5 to 9 minutes: 140
- 10 to 14 minutes: 34
- 15 to 19 minutes: 62
- 20 to 24 minutes: 55
- 25 to 29 minutes: 144
- 30 to 34 minutes: 135
- 35 to 39 minutes: 20
- 40 to 44 minutes: 9
- 45 to 59 minutes: 10
- 60 to 89 minutes: 14
- 90 or more minutes: 10
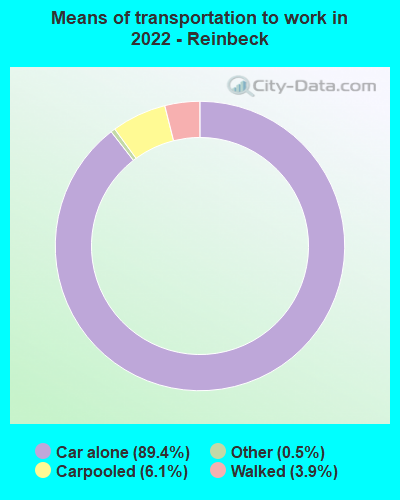
Means of transportation to work:
- Drove a car alone: 654 (83.1%)
- Carpooled: 47 (6.0%)
- Taxi: 3 (0.4%)
- Walked: 28 (3.6%)
- Worked at home: 44 (5.6%)
- Unemployment by race in 2022
- Unemployment rate for White non-Hispanic residents
- 4.0%Males
- 0.4%Females
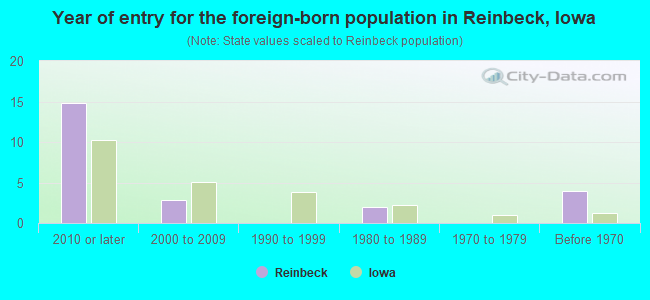
- Year of entry for the foreign-born population in Reinbeck, Iowa
- 152010 or later
- 32000 to 2009
- 01990 to 1999
- 21980 to 1989
- 01970 to 1979
- 4Before 1970
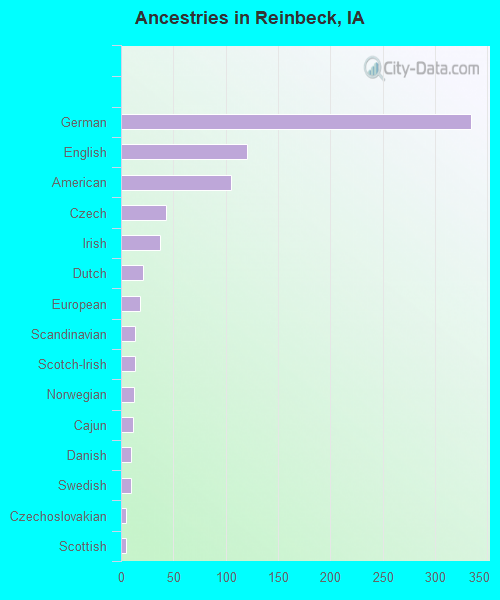
First ancestries reported:
- German: 335 (40.6%)
- English: 120 (14.6%)
- American: 105 (12.7%)
- Czech: 43 (5.2%)
- Irish: 37 (4.5%)
- Dutch: 21 (2.5%)
- European: 18 (2.2%)
- Scandinavian: 13 (1.6%)
- Scotch-Irish: 13 (1.6%)
- Norwegian: 12 (1.5%)
- Cajun: 11 (1.3%)
- Danish: 10 (1.2%)
- Swedish: 10 (1.2%)
- Czechoslovakian: 5 (0.6%)
- Scottish: 5 (0.6%)
- Canadian: 2 (0.2%)
- Bulgarian: 1 (0.1%)
Most common places of birth for foreign-born residents (%):
| Reinbeck: | 46.3% (19) |
| Iowa: | 1.4% (2,525) |
| Reinbeck: | 31.7% (13) |
| Iowa: | 3.2% (5,672) |
| Reinbeck: | 4.9% (2) |
| Iowa: | 0.2% (370) |
| Reinbeck: | 4.9% (2) |
| Iowa: | 23.3% (41,625) |
| Reinbeck: | 4.9% (2) |
| Iowa: | 1.6% (2,873) |
Place of birth for U.S.-born residents:
- This state: 1,479
- Other state: 253
- Northeast: 18
- Midwest: 136
- South: 35
- West: 63
90.3% of Reinbeck residents lived in the same house 1 years ago.
Out of people who lived in different houses, 19.7% lived in this county.
Out of people who lived in different counties, 75.4% lived in Iowa.
| Reinbeck: | 90.3% |
| State average: | 87.2% |
Education attainment for males 25 years and older:
- No schooling: 0
- Nursery to 4th grade: 0
- 5th and 6th grade: 5
- 7th and 8th grade: 2
- 9th grade: 6
- 10th grade: 0
- 11th grade: 3
- 12th grade, no diploma: 5
- High school graduate (or equivalency): 211
- Less than 1 year of college: 37
- Some college more than 1 year, no degree: 106
- Associate degree: 75
- Bachelor's degree: 109
- Master's degree: 43
- Professional school degree: 0
- Doctorate degree: 0

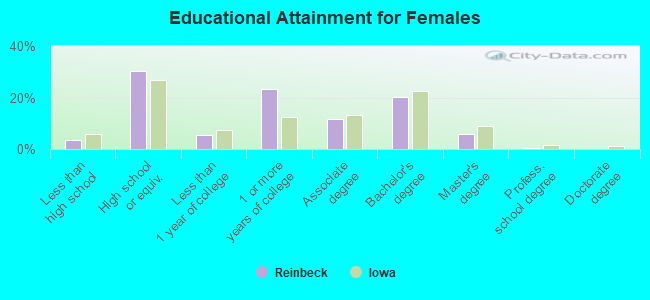
Education attainment for females 25 years and older:
- No schooling: 17
- Nursery to 4th grade: 0
- 5th and 6th grade: 0
- 7th and 8th grade: 1
- 9th grade: 0
- 10th grade: 0
- 11th grade: 4
- 12th grade, no diploma: 0
- High school graduate (or equivalency): 201
- Less than 1 year of college: 35
- Some college more than 1 year, no degree: 155
- Associate degree: 77
- Bachelor's degree: 133
- Master's degree: 38
- Professional school degree: 3
- Doctorate degree: 0
Housing units in structures:
- One, detached: 666
- One, attached: 10
- Two: 19
- 3 or 4: 84
- 5 to 9: 20
- 20 to 49: 26
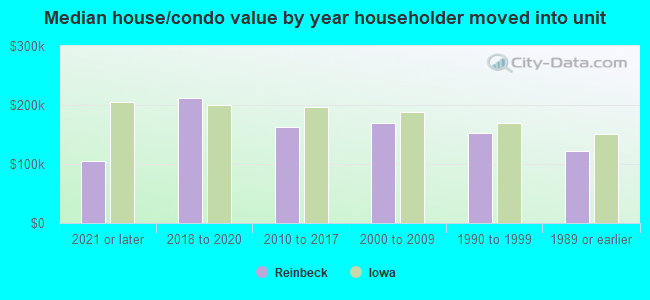
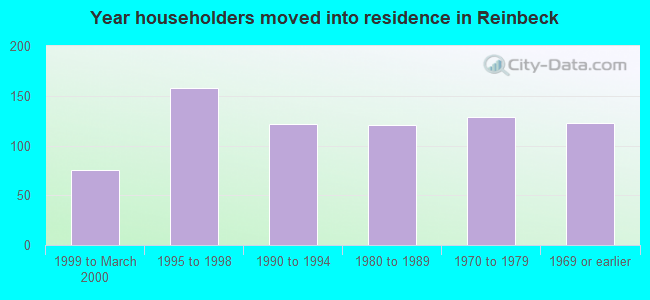
House/condo owner moved in on average 15 years ago
Renter moved in on average 3 years ago
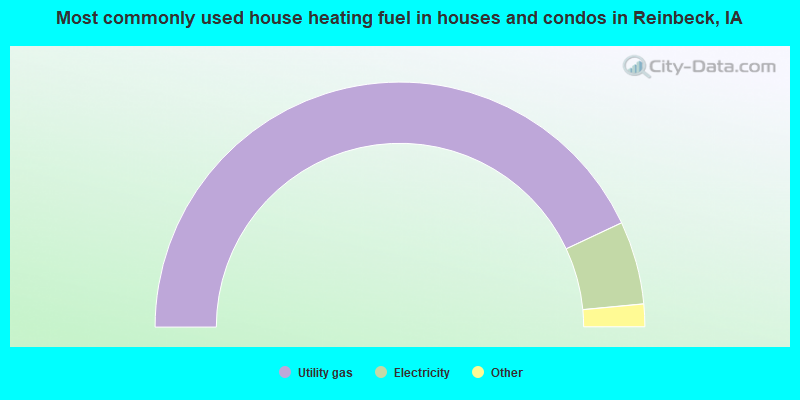
- 86.2%Utility gas
- 11.0%Electricity
- 1.5%Bottled, tank, or LP gas
- 0.8%Fuel oil, kerosene, etc.
- 0.5%Other fuel
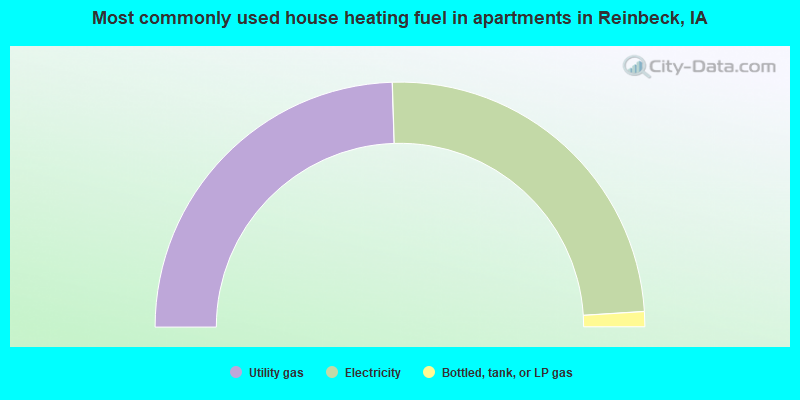
- 49.0%Utility gas
- 49.0%Electricity
- 2.0%Bottled, tank, or LP gas
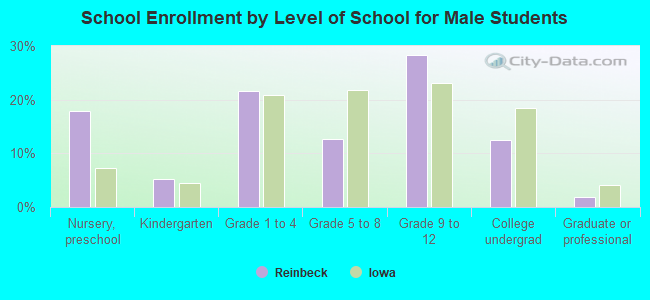
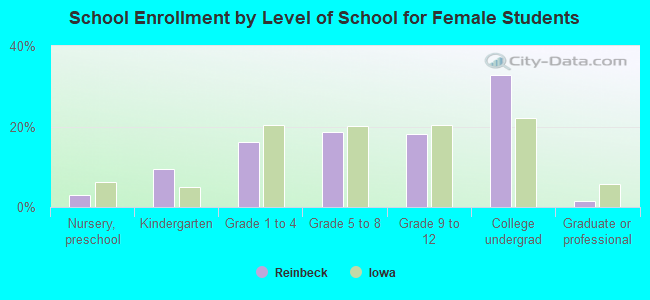
Private vs. public school enrollment:
| Here: | 2.2% |
| Iowa: | 10.6% |
| Here: | 0.0% |
| Iowa: | 7.9% |
| Here: | 12.6% |
| Iowa: | 23.9% |