Ripley, TN (Tennessee) Houses and Residents
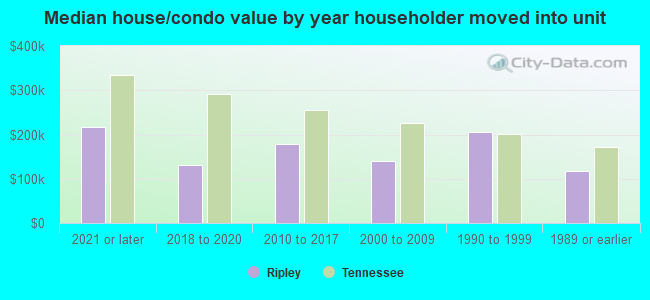
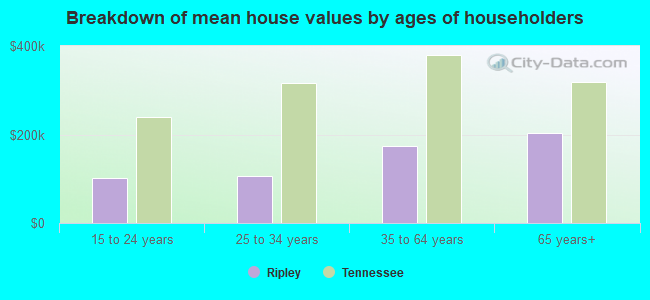
| Ripley: | $147,124 |
| Tennessee: | $284,800 |
Total population: 8,257 (Urban population: 6,364 (all inside urban clusters), Rural population: 1,444 (all nonfarm))
Houses: 3,560 (2,961 occupied: 1,362 owner occupied, 1,651 renter occupied)
| % of renters here: | 55% |
| State: | 33% |
Housing density: 278 houses/condos per square mile
Median price asked for vacant for-sale houses and condos in 2022: $1,004,862.
Median contract rent in 2022: $506 (lower quartile is $256, upper quartile is $636)
Median rent asked for vacant for-rent units in 2022: $510
Median gross rent in Ripley, TN in 2022: $720
Housing units in Ripley with a mortgage: 777 (52 second mortgage, 0 home equity loan, 44 both second mortgage and home equity loan)
Houses without a mortgage: 0
Median household income for houses/condos with a mortgage: $69,354
Median household income for apartments without a mortgage: $59,493
Median monthly housing costs: $731
Compare current foreclosures in Ripley, TN:
| Photo | Address | Area | Beds / Baths | Price | Details |
|---|---|---|---|---|---|

|
#1
S Jefferson St
Ripley, TN 38063
|
2,828 sq. feet
|
3 baths 3 beds |
show details | |

|
#2
Asbury Glimp Rd
Ripley, TN 38063
|
1,728 sq. feet
|
2 baths - beds |
show details | |

|
#3
Porters Gap Rd
Ripley, TN 38063
|
1,756 sq. feet
|
2 baths - beds |
show details | |

|
#4
Sunrise Dr
Ripley, TN 38063
|
1,153 sq. feet
|
1 baths - beds |
show details | |

|
#5
Ross Rd
Ripley, TN 38063
|
1,932 sq. feet
|
2 baths - beds |
show details | |

|
#6
Church St
Ripley, TN 38063
|
1,008 sq. feet
|
1 baths - beds |
show details | |

|
#7
Tucker Ave
Ripley, TN 38063
|
1,208 sq. feet
|
2 baths - beds |
show details | |

|
#8
Old Brownsville Rd
Ripley, TN 38063
|
1,803 sq. feet
|
1 baths - beds |
show details | |

|
#9
Carmack Rd
Ripley, TN 38063
|
712 sq. feet
|
1 baths - beds |
show details | |

|
#10
Courtney Dr
Ripley, TN 38063
|
1,160 sq. feet
|
2 baths - beds |
show details |
| Photo | Address | Area | Beds / Baths | Price | Details |
|---|---|---|---|---|---|

|
#11
Christin Dr
Ripley, TN 38063
|
1,340 sq. feet
|
2 baths - beds |
show details | |

|
#12
Edith Nankipoo Rd
Ripley, TN 38063
|
852 sq. feet
|
1 baths - beds |
show details | |

|
#13
Highway 209 N
Ripley, TN 38063
|
1,729 sq. feet
|
2 baths - beds |
show details | |

|
#14
Sherrin Dr
Ripley, TN 38063
|
1,240 sq. feet
|
1 baths - beds |
show details | |

|
#15
Silver Cv
Ripley, TN 38063
|
1,014 sq. feet
|
1 baths - beds |
show details | |

|
#16
Conner Whitefield Rd
Ripley, TN 38063
|
1,940 sq. feet
|
2 baths - beds |
show details | |

|
#17
S Washington St
Ripley, TN 38063
|
1,308 sq. feet
|
1 baths - beds |
show details | |

|
#18
Moore St
Ripley, TN 38063
|
1,275 sq. feet
|
2 baths - beds |
show details | |

|
#19
Mary Lynn Ave
Ripley, TN 38063
|
1,107 sq. feet
|
1 baths - beds |
show details | |

|
#20
Moore St
Ripley, TN 38063
|
973 sq. feet
|
1 baths - beds |
show details |
| Photo | Address | Area | Beds / Baths | Price | Details |
|---|---|---|---|---|---|

|
#21
Arp Central Rd
Ripley, TN 38063
|
1,742 sq. feet
|
1 baths - beds |
show details | |

|
#22
Belton Rd
Ripley, TN 38063
|
3,044 sq. feet
|
3 baths - beds |
show details | |

|
#23
N Alpine St
Ripley, TN 38063
|
2,094 sq. feet
|
2 baths - beds |
show details | |

|
#24
Highland St
Ripley, TN 38063
|
1,953 sq. feet
|
1 baths - beds |
show details | |

|
#25
Curve Nankipoo Rd
Ripley, TN 38063
|
1,508 sq. feet
|
3 baths - beds |
show details | |

|
#26
King St
Ripley, TN 38063
|
1,041 sq. feet
|
1 baths - beds |
show details | |

|
#27
Stardust Dr
Ripley, TN 38063
|
1,048 sq. feet
|
1 baths - beds |
show details | |

|
#28
Bald Knob Rd
Ripley, TN 38063
|
3,258 sq. feet
|
4 baths - beds |
show details | |

|
#29
Ross Rd
Ripley, TN 38063
|
1,250 sq. feet
|
2 baths - beds |
show details | |

|
#30
Old Glimp Rd
Ripley, TN 38063
|
1,216 sq. feet
|
2 baths - beds |
show details |
| Photo | Address | Area | Beds / Baths | Price | Details |
|---|---|---|---|---|---|

|
#31
Robin Dr
Ripley, TN 38063
|
1,136 sq. feet
|
1 baths - beds |
show details | |

|
#32
Old Brownsville Rd
Ripley, TN 38063
|
2,106 sq. feet
|
2 baths - beds |
show details | |

|
#33
American Way
Ripley, TN 38063
|
1,467 sq. feet
|
1 baths - beds |
show details | |

|
#34
Curve Woodville Rd
Ripley, TN 38063
|
1,370 sq. feet
|
1 baths - beds |
show details | |

|
#35
Highway 19 E
Ripley, TN 38063
|
1,239 sq. feet
|
1 baths - beds |
show details | |

|
#36
Naber St
Ripley, TN 38063
|
1,598 sq. feet
|
2 baths - beds |
show details | |

|
#37
Mary Lynn Ave
Ripley, TN 38063
|
1,266 sq. feet
|
1 baths - beds |
show details | |

|
#38
Moore St
Ripley, TN 38063
|
1,073 sq. feet
|
1 baths - beds |
show details | |

|
#39
Spivey St
Ripley, TN 38063
|
1,092 sq. feet
|
1 baths - beds |
show details | |

|
#40
Webb Ave E
Ripley, TN 38063
|
1,736 sq. feet
|
2 baths - beds |
show details |
| Photo | Address | Area | Beds / Baths | Price | Details |
|---|---|---|---|---|---|

|
#41
Conner Whitefield Rd
Ripley, TN 38063
|
1,908 sq. feet
|
1 baths - beds |
show details | |

|
#42
Durhamville Rd
Ripley, TN 38063
|
1,008 sq. feet
|
1 baths - beds |
show details | |

|
#43
Dry Hill Rd W
Ripley, TN 38063
|
- sq. feet
|
- baths - beds |
show details | |

|
#44
Robin Dr
Ripley, TN 38063
|
- sq. feet
|
- baths - beds |
show details | |

|
#45
John White Rd
Ripley, TN 38063
|
1,904 sq. feet
|
- baths - beds |
show details | |

|
#46
Sherrin Dr
Ripley, TN 38063
|
- sq. feet
|
- baths - beds |
show details | |

|
#47
Arp Central Rd
Ripley, TN 38063
|
- sq. feet
|
- baths - beds |
show details | |

|
#48
Polly Walker Rd
Ripley, TN 38063
|
- sq. feet
|
- baths - beds |
show details | |

|
#49
Kirkhill Subdivision Rd
Ripley, TN 38063
|
- sq. feet
|
- baths - beds |
show details | |

|
Check over 1 million property listings on Foreclosure.com!
|
browse all offers | |||

Latest news about housing in Ripley, TN collected exclusively by city-data.com from local newspapers, TV, and radio stations

 | Tennessee's 2020 Census results (70 replies) |
| Gaitlinburg Activity Suggestions (14 replies) |
| Traveling to Gatlinburg, where to stop? (12 replies) |
| Things I do not understand about Memphis (97 replies) |
| Looking for rental property close to ripley (0 replies) |
| Single Mom thinking of relocating Memphis Suburbs (12 replies) |
Median year apartment built: 1981
Household type by relationship:
Households: 7,937- Male householders: 970 (372 living alone), Female householders: 1,955 (538 living alone)
859 spouses (851 opposite-sex spouses), 210 unmarried partners, (203 opposite-sex unmarried partners), 2,493 children (2,278 natural, 40 adopted, 174 stepchildren), 279 grandchildren, 70 brothers or sisters, 141 parents, 0 foster children, 369 other relatives, 359 non-relatives
- In group quarters: 228
Size of family households: 805 2-persons, 490 3-persons, 201 4-persons, 213 5-persons, 153 6-persons, 16 7-or-more-persons.
Size of nonfamily households: 927 1-person, 199 2-persons, 4 3-persons.
400 married couples with children.
1,040 single-parent households (118 men, 922 women).
97.7% of residents of Ripley speak English at home.
1.6% of residents speak Spanish at home (64% speak English very well, 36% speak English not well).
0.2% of residents speak other Indo-European language at home (47% speak English well, 53% speak English not well).
Foreign born population: 55 (0.7%)
(14.5% of them are naturalized citizens)
| Here: | 6.3 |
| State: | 6.5 |
| Here: | 4.5 |
| State: | 4.4 |
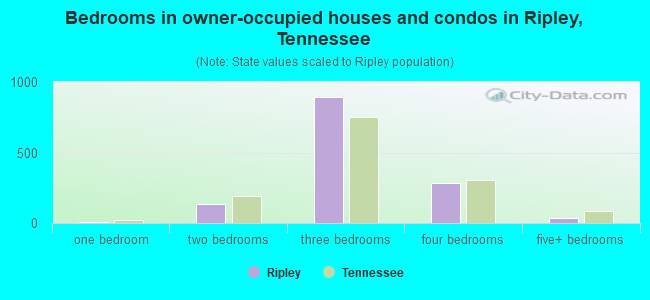
- Bedrooms in owner-occupied houses and condos in Ripley, Tennessee
- 0no bedroom
- 81 bedroom
- 1372 bedrooms
- 8923 bedrooms
- 2874 bedrooms
- 385+ bedrooms
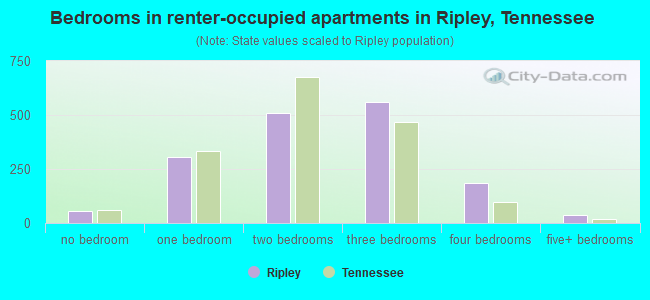
- Bedrooms in renter-occupied apartments in Ripley, Tennessee
- 55no bedroom
- 3071 bedroom
- 5112 bedrooms
- 5583 bedrooms
- 1844 bedrooms
- 375+ bedrooms
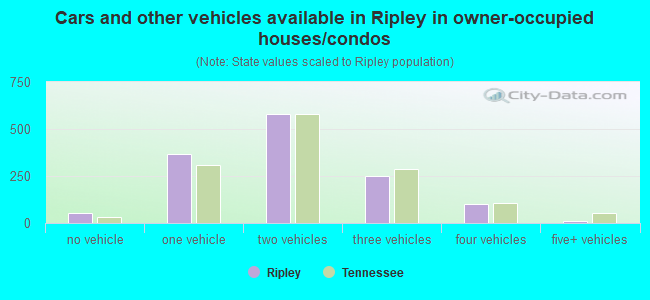
- Cars and other vehicles available in Ripley in owner-occupied houses/condos
- 54no vehicle
- 3671 vehicle
- 5812 vehicles
- 2523 vehicles
- 1014 vehicles
- 85+ vehicles
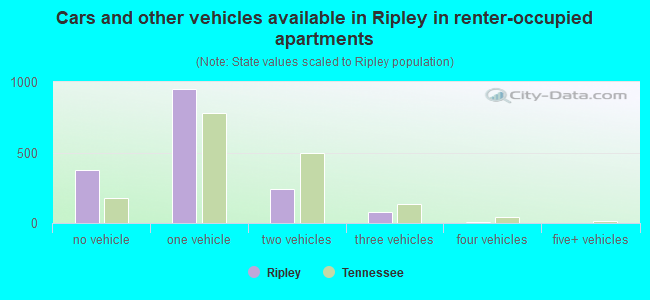
- Cars and other vehicles available in Ripley in renter-occupied apartments
- 377no vehicle
- 9481 vehicle
- 2422 vehicles
- 763 vehicles
- 84 vehicles
- 05+ vehicles
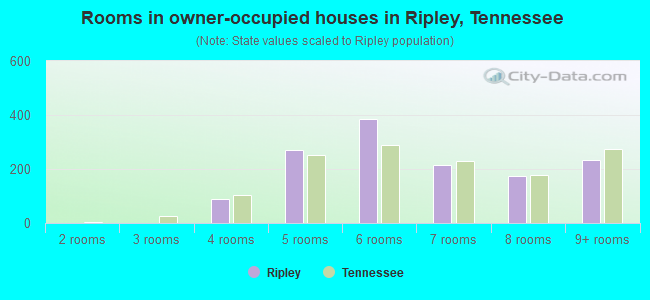
- Rooms in owner-occupied houses in Ripley, Tennessee
- 01 room
- 02 rooms
- 03 rooms
- 894 rooms
- 2705 rooms
- 3846 rooms
- 2137 rooms
- 1748 rooms
- 2339+ rooms
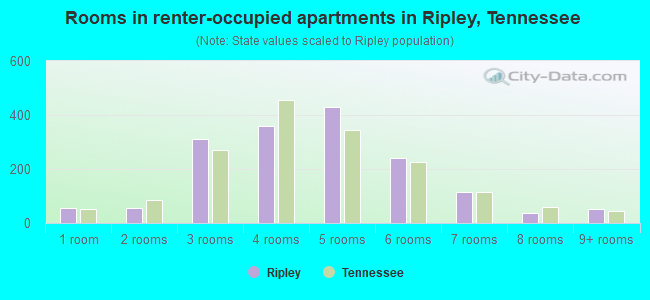
- Rooms in renter-occupied apartments in Ripley, Tennessee
- 551 room
- 562 rooms
- 3113 rooms
- 3594 rooms
- 4305 rooms
- 2406 rooms
- 1147 rooms
- 368 rooms
- 519+ rooms
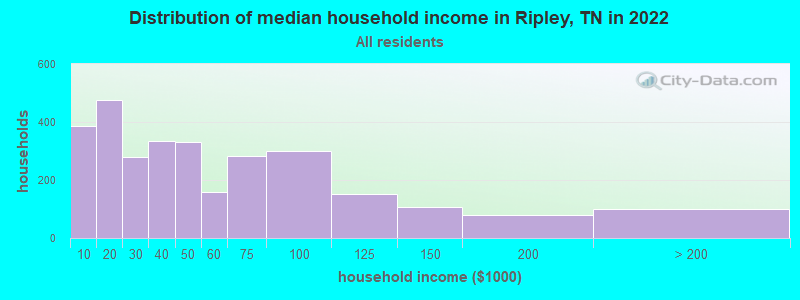
Ripley, TN household income distribution

- 386Less than $10,000
- 477$10,000 to $19,999
- 281$20,000 to $29,999
- 334$30,000 to $39,999
- 331$40,000 to $49,999
- 158$50,000 to $59,999
- 284$60,000 to $74,999
- 299$75,000 to $99,999
- 151$100,000 to $124,999
- 108$125,000 to $149,999
- 78$150,000 to $199,999
- 99$200,000 or more
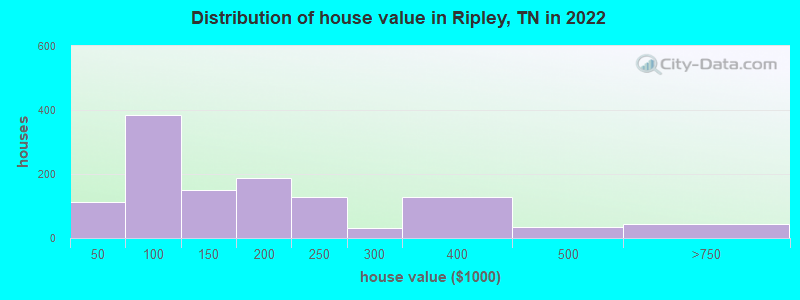
Home value of owner - occupied houses in 2022 in Ripley, TN
-
- 20Less than $10,000
- 8$10,000 to $14,999
- 10$20,000 to $24,999
- 4$25,000 to $29,999
- 20$30,000 to $34,999
- 46$40,000 to $49,999
- 36$50,000 to $59,999
- 86$60,000 to $69,999
- 85$70,000 to $79,999
- 72$80,000 to $89,999
- 57$90,000 to $99,999
- 107$100,000 to $124,999
- 40$125,000 to $149,999
- 111$150,000 to $174,999
- 77$175,000 to $199,999
- 129$200,000 to $249,999
- 30$250,000 to $299,999
- 127$300,000 to $399,999
- 34$400,000 to $499,999
- 45$500,000 to $749,999
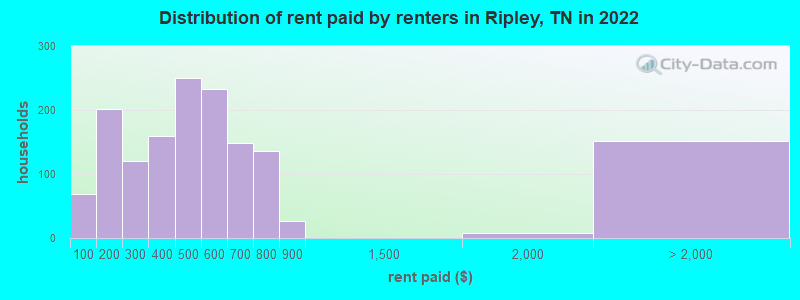
Rent paid by renters in 2022 in Ripley, TN
-
- 67Less than $100
- 151$100 to $149
- 50$150 to $199
- 109$200 to $249
- 11$250 to $299
- 85$300 to $349
- 73$350 to $399
- 98$400 to $449
- 151$450 to $499
- 123$500 to $549
- 109$550 to $599
- 71$600 to $649
- 77$650 to $699
- 102$700 to $749
- 33$750 to $799
- 27$800 to $899
- 7$1,500 to $1,999
- 152No cash rent
Percentage of workers working in this county: 64.2%
Number of people working at home: 100 (3.6% of all workers)

Travel time to work (commute)
- Less than 5 minutes: 96
- 5 to 9 minutes: 563
- 10 to 14 minutes: 478
- 15 to 19 minutes: 431
- 20 to 24 minutes: 356
- 25 to 29 minutes: 176
- 30 to 34 minutes: 202
- 35 to 39 minutes: 25
- 40 to 44 minutes: 10
- 45 to 59 minutes: 73
- 60 to 89 minutes: 94
- 90 or more minutes: 148
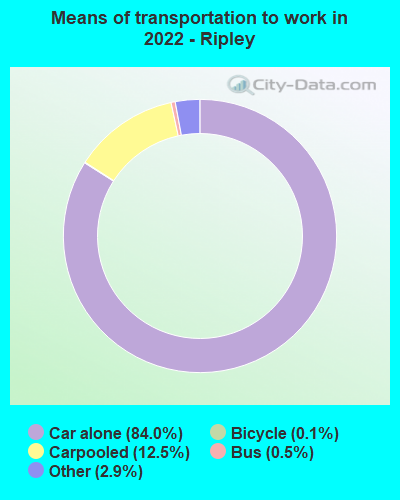
Means of transportation to work:
- Drove a car alone: 3,536 (78.7%)
- Carpooled: 558 (12.4%)
- Bus: 17 (0.4%)
- Taxi: 150 (3.3%)
- Bicycle: 6 (0.1%)
- Worked at home: 100 (2.2%)
- Unemployment by race in 2022
- Unemployment rate for White non-Hispanic residents
- 6.7%Males
- 1.6%Females
- Unemployment rate for Black residents
- 1.9%Males
- 15.0%Females
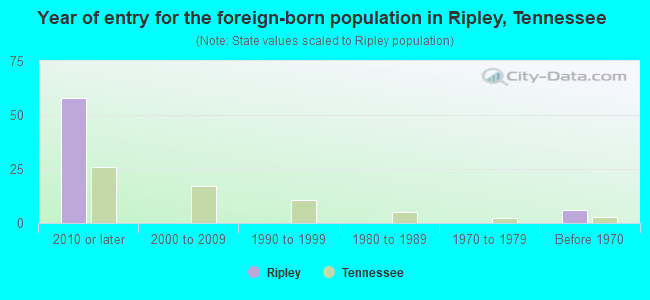
- Year of entry for the foreign-born population in Ripley, Tennessee
- 582010 or later
- 02000 to 2009
- 01990 to 1999
- 01980 to 1989
- 01970 to 1979
- 6Before 1970
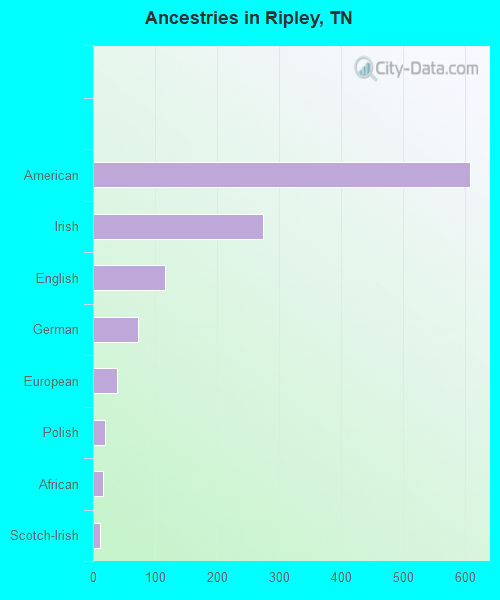
First ancestries reported:
- American: 608 (12.1%)
- Irish: 274 (5.5%)
- English: 116 (2.3%)
- German: 73 (1.5%)
- European: 39 (0.8%)
- Polish: 19 (0.4%)
- African: 16 (0.3%)
- Scotch-Irish: 12 (0.2%)
- French Canadian: 4 (0.08%)
- Czechoslovakian: 3 (0.06%)
- Italian: 2 (0.04%)
Most common places of birth for foreign-born residents (%):
| Ripley: | 63.6% (35) |
| Tennessee: | 23.0% (86,435) |
| Ripley: | 27.3% (15) |
| Tennessee: | 0.3% (1,109) |
| Ripley: | 9.1% (5) |
| Tennessee: | 2.2% (8,261) |
Place of birth for U.S.-born residents:
- This state: 6,827
- Other state: 948
- Northeast: 69
- Midwest: 380
- South: 403
- West: 87
88.7% of Ripley residents lived in the same house 1 years ago.
Out of people who lived in different houses, 37.0% lived in this county.
Out of people who lived in different counties, 76.7% lived in Tennessee.
| Ripley: | 88.7% |
| State average: | 87.0% |
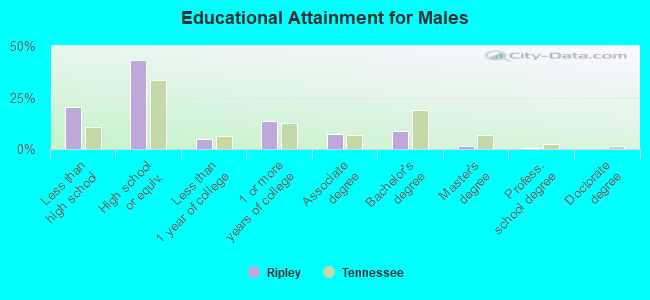
Education attainment for males 25 years and older:
- No schooling: 64
- Nursery to 4th grade: 0
- 5th and 6th grade: 0
- 7th and 8th grade: 33
- 9th grade: 59
- 10th grade: 75
- 11th grade: 148
- 12th grade, no diploma: 85
- High school graduate (or equivalency): 990
- Less than 1 year of college: 114
- Some college more than 1 year, no degree: 314
- Associate degree: 169
- Bachelor's degree: 205
- Master's degree: 28
- Professional school degree: 10
- Doctorate degree: 0
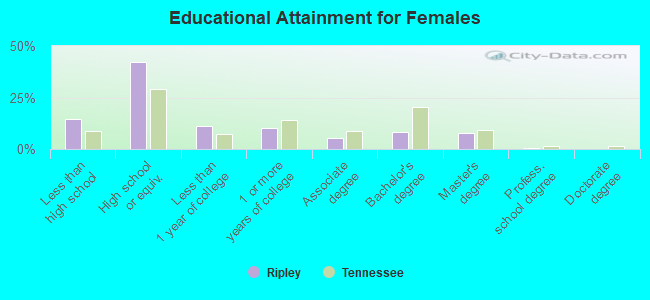
Education attainment for females 25 years and older:
- No schooling: 25
- Nursery to 4th grade: 0
- 5th and 6th grade: 5
- 7th and 8th grade: 42
- 9th grade: 66
- 10th grade: 71
- 11th grade: 53
- 12th grade, no diploma: 124
- High school graduate (or equivalency): 1,119
- Less than 1 year of college: 297
- Some college more than 1 year, no degree: 267
- Associate degree: 145
- Bachelor's degree: 219
- Master's degree: 199
- Professional school degree: 12
- Doctorate degree: 0
Housing units in structures:
- One, detached: 2,505
- One, attached: 39
- Two: 266
- 3 or 4: 254
- 5 to 9: 309
- 10 to 19: 13
- 20 to 49: 74
- 50 or more: 32
- Mobile homes: 63
Housing units lacking complete kitchen facilities in 2022: 1.7%
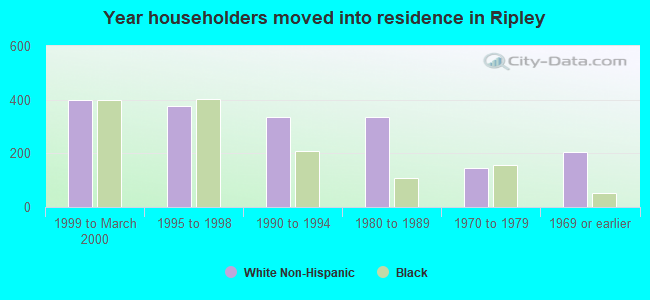
House/condo owner moved in on average 17 years ago
Renter moved in on average 4 years ago

- 59.9%Utility gas
- 39.9%Electricity
- 0.2%Bottled, tank, or LP gas
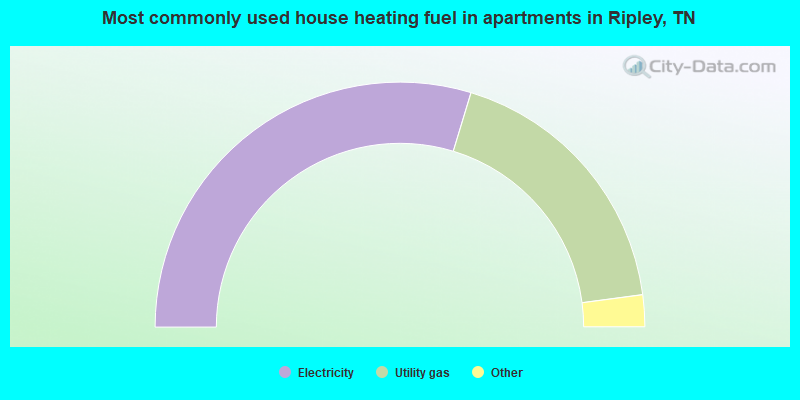
- 59.5%Electricity
- 36.5%Utility gas
- 2.5%Bottled, tank, or LP gas
- 1.6%No fuel used
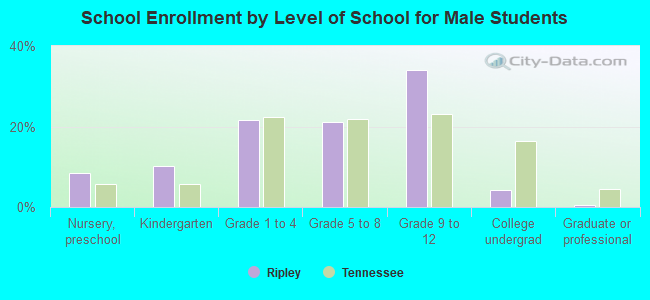
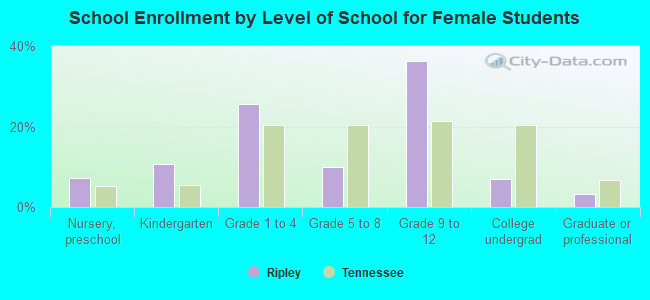
Private vs. public school enrollment:
| Here: | 5.2% |
| Tennessee: | 15.0% |
| Here: | 8.6% |
| Tennessee: | 16.2% |
| Here: | 19.4% |
| Tennessee: | 23.5% |