Rock City, IL (Illinois) Houses and Residents
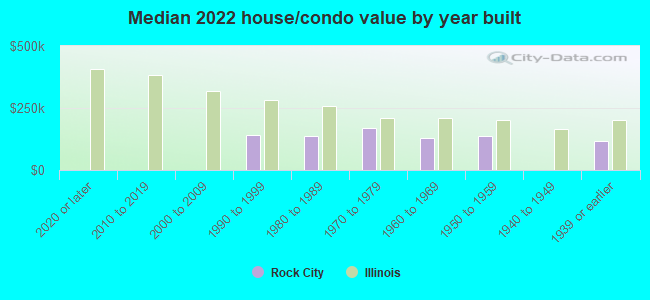
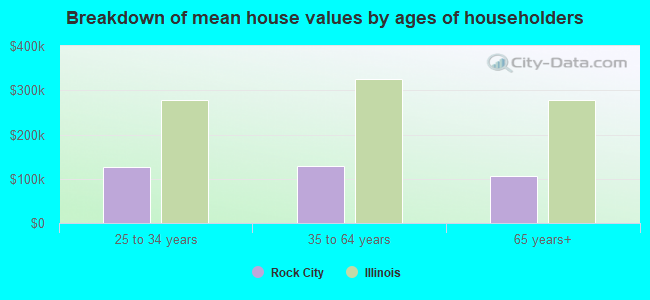
| Rock City: | $125,432 |
| Illinois: | $251,600 |
Mean price in 2022:
Detached houses: $126,755
Here: $126,755 State: $310,164
Total population: 311 (Urban population: 0, Rural population: 337 (all nonfarm))
Houses: 127 (124 occupied: 104 owner occupied, 21 renter occupied)
| % of renters here: | 17% |
| State: | 33% |
Housing density: 891 houses/condos per square mile
Median price asked for vacant for-sale houses and condos in 2022 in this county: $85,306.
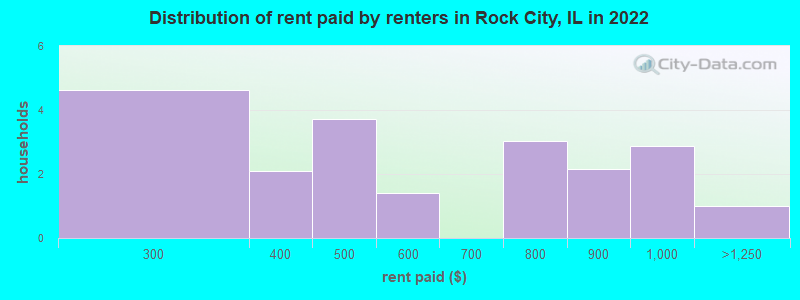
Median contract rent in 2022: $557 (lower quartile is $310, upper quartile is $836)
Median gross rent in Rock City, IL in 2022: $769
Housing units in Rock City with a mortgage: 57 (4 second mortgage, 0 home equity loan, 4 both second mortgage and home equity loan)
Houses without a mortgage: 0
Median household income for houses/condos with a mortgage: $62,676
Median household income for apartments without a mortgage: $61,439
Median monthly housing costs: $1,001
Compare current foreclosures near Rock City, IL:
| Photo | Address | Area | Beds / Baths | Price | Details |
|---|---|---|---|---|---|

|
#1
E Rock Grove Rd
Rock City, IL 61070
|
- sq. feet
|
- baths - beds |
show details | |

|
#2
N Whistler Ave
Freeport, IL 61032
|
1,056 sq. feet
|
2 baths 3 beds |
show details | |

|
#3
W 2nd Ave
Brodhead, WI 53520
|
1,052 sq. feet
|
1 baths 3 beds |
show details | |

|
#4
S Saxby Ave
Freeport, IL 61032
|
963 sq. feet
|
1 baths 3 beds |
show details | |

|
#5
W Pleasant St
Freeport, IL 61032
|
- sq. feet
|
2 baths 4 beds |
show details | |

|
#6
Airport Rd
Brodhead, WI 53520
|
- sq. feet
|
- baths - beds |
show details | |

|
#7
Springhill Dr
Winnebago, IL 61088
|
- sq. feet
|
- baths - beds |
show details | |

|
#8
W Winnifred St
Freeport, IL 61032
|
- sq. feet
|
- baths - beds |
show details | |

|
#9
N Willow Ave Apt 249
Freeport, IL 61032
|
- sq. feet
|
- baths - beds |
show details | |

|
#10
N Showers Rd
Orangeville, IL 61060
|
- sq. feet
|
- baths - beds |
show details |
| Photo | Address | Area | Beds / Baths | Price | Details |
|---|---|---|---|---|---|

|
#11
Empire Ct Apt 1
Freeport, IL 61032
|
- sq. feet
|
- baths - beds |
show details | |

|
#12
W Empire St
Freeport, IL 61032
|
- sq. feet
|
- baths - beds |
show details | |

|
#13
Harrison Rd
Rockton, IL 61072
|
- sq. feet
|
- baths - beds |
show details | |

|
#14
N Cherry Ave
Freeport, IL 61032
|
- sq. feet
|
- baths - beds |
show details | |

|
#15
21st St, Trlr 69
Brodhead, WI 53520
|
- sq. feet
|
- baths - beds |
show details | |

|
#16
19th St, Trlr 28
Brodhead, WI 53520
|
- sq. feet
|
- baths - beds |
show details | |

|
#17
Crazy Horse Ln, Lot 9
Brodhead, WI 53520
|
- sq. feet
|
- baths - beds |
show details | |

|
#18
W 21st St Lot 61
Monroe, WI 53566
|
- sq. feet
|
- baths - beds |
show details | |

|
#19
W Egan Rd
Leaf River, IL 61047
|
- sq. feet
|
- baths - beds |
show details | |

|
#20
12th Ave Apt 3
Monroe, WI 53566
|
- sq. feet
|
- baths - beds |
show details |
| Photo | Address | Area | Beds / Baths | Price | Details |
|---|---|---|---|---|---|

|
#21
W Florence Rd
Baileyville, IL 61007
|
- sq. feet
|
- baths - beds |
show details | |

|
#22
N Main St
Baileyville, IL 61007
|
- sq. feet
|
- baths - beds |
show details | |

|
#23
N Leaf River Rd Apt 1
Leaf River, IL 61047
|
- sq. feet
|
- baths - beds |
show details | |

|
#24
S Oak Ave Apt 4
Freeport, IL 61032
|
- sq. feet
|
- baths - beds |
show details | |

|
#25
N Park Blvd Apt 210
Freeport, IL 61032
|
- sq. feet
|
- baths - beds |
show details | |

|
#26
S 14th Ave
Freeport, IL 61032
|
- sq. feet
|
- baths - beds |
show details | |

|
#27
E High St # 1
Orangeville, IL 61060
|
- sq. feet
|
- baths - beds |
show details | |

|
#28
W 5th St # 182
Pecatonica, IL 61063
|
- sq. feet
|
- baths - beds |
show details | |

|
#29
High St
Pecatonica, IL 61063
|
- sq. feet
|
- baths - beds |
show details | |

|
#30
Washington St
Pecatonica, IL 61063
|
- sq. feet
|
- baths - beds |
show details |
| Photo | Address | Area | Beds / Baths | Price | Details |
|---|---|---|---|---|---|

|
#31
High St
Pecatonica, IL 61063
|
- sq. feet
|
- baths - beds |
show details | |

|
#32
W Washington St
Cedarville, IL 61013
|
- sq. feet
|
- baths - beds |
show details | |

|
#33
Best Rd
Pecatonica, IL 61063
|
- sq. feet
|
- baths - beds |
show details | |

|
#34
E 11th St
Pecatonica, IL 61063
|
- sq. feet
|
- baths - beds |
show details | |

|
#35
Theiler Rd
Juda, WI 53550
|
- sq. feet
|
- baths - beds |
show details | |

|
#36
30 1/2 Ave
Monroe, WI 53566
|
- sq. feet
|
- baths - beds |
show details | |

|
#37
17th Ave
Monroe, WI 53566
|
- sq. feet
|
- baths - beds |
show details | |

|
#38
E 4th Ave
Brodhead, WI 53520
|
- sq. feet
|
- baths - beds |
show details | |

|
#39
Lorimar Dr
Durand, IL 61024
|
- sq. feet
|
- baths - beds |
show details | |

|
#40
W 2nd Ave
Brodhead, WI 53520
|
- sq. feet
|
- baths - beds |
show details |
| Photo | Address | Area | Beds / Baths | Price | Details |
|---|---|---|---|---|---|

|
#41
W 6th Ave
Brodhead, WI 53520
|
- sq. feet
|
- baths - beds |
show details | |

|
#42
Concord Dr
Durand, IL 61024
|
- sq. feet
|
- baths - beds |
show details | |

|
#43
Lorimar Dr
Durand, IL 61024
|
- sq. feet
|
- baths - beds |
show details | |

|
#44
N Pecatonica St
Winnebago, IL 61088
|
- sq. feet
|
- baths - beds |
show details | |

|
#45
N Hulbert Rd
Winslow, IL 61089
|
- sq. feet
|
- baths - beds |
show details | |

|
#46
E Main St
Durand, IL 61024
|
- sq. feet
|
- baths - beds |
show details | |

|
#47
Knox Dr
Freeport, IL 61032
|
- sq. feet
|
- baths - beds |
show details | |

|
#48
16th Ave
Monroe, WI 53566
|
- sq. feet
|
- baths - beds |
show details | |

|
#49
23rd St
Monroe, WI 53566
|
- sq. feet
|
- baths - beds |
show details | |

|
Check over 1 million property listings on Foreclosure.com!
|
browse all offers | |||


 | Military family moving to Quadcity HELP! (4 replies) |

Median year apartment built: 1964
Household type by relationship:
Households: 333- Male householders: 45 (11 living alone), Female householders: 76 (23 living alone)
55 spouses (55 opposite-sex spouses), 10 unmarried partners, (10 opposite-sex unmarried partners), 114 children (108 natural, 0 adopted, 5 stepchildren), 6 grandchildren, 0 brothers or sisters, 0 parents, 0 foster children, 17 other relatives, 4 non-relatives
Size of family households: 41 2-persons, 16 3-persons, 19 4-persons, 4 5-persons, 5 7-or-more-persons.
Size of nonfamily households: 37 1-person, 2 2-persons.
27 married couples with children.
53 single-parent households (39 men, 14 women).
99.4% of residents of Rock City speak English at home.
| Here: | 6.6 |
| State: | 6.4 |
| Here: | 4.2 |
| State: | 4.1 |
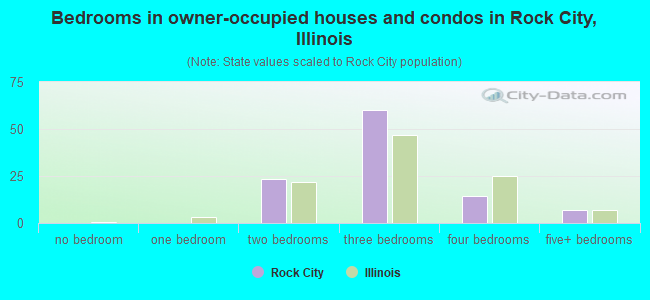
- Bedrooms in owner-occupied houses and condos in Rock City, Illinois
- 0no bedroom
- 01 bedroom
- 232 bedrooms
- 603 bedrooms
- 144 bedrooms
- 75+ bedrooms
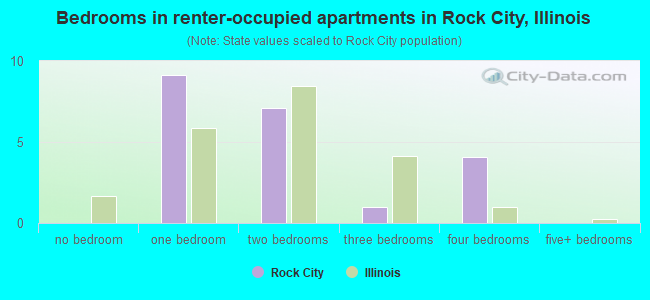
- Bedrooms in renter-occupied apartments in Rock City, Illinois
- 0no bedroom
- 91 bedroom
- 72 bedrooms
- 13 bedrooms
- 44 bedrooms
- 05+ bedrooms
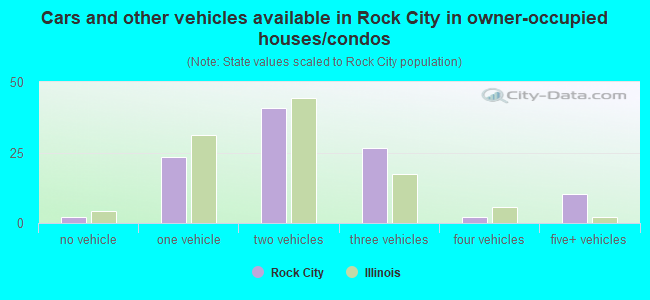
- Cars and other vehicles available in Rock City in owner-occupied houses/condos
- 2no vehicle
- 231 vehicle
- 412 vehicles
- 263 vehicles
- 24 vehicles
- 105+ vehicles
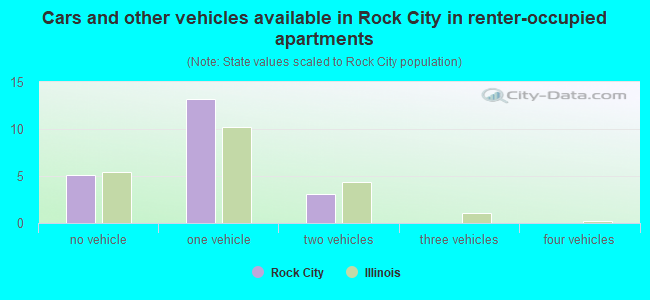
- Cars and other vehicles available in Rock City in renter-occupied apartments
- 5no vehicle
- 131 vehicle
- 32 vehicles
- 03 vehicles
- 04 vehicles
- 05+ vehicles
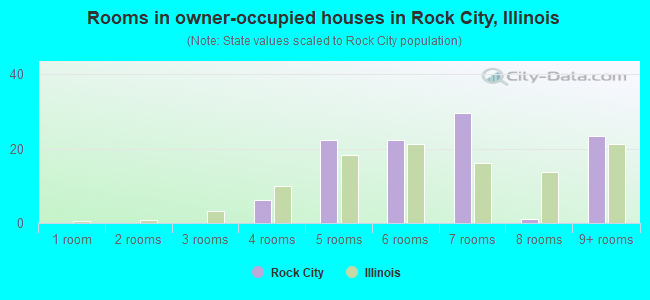
- Rooms in owner-occupied houses in Rock City, Illinois
- 01 room
- 02 rooms
- 03 rooms
- 64 rooms
- 225 rooms
- 226 rooms
- 307 rooms
- 18 rooms
- 239+ rooms
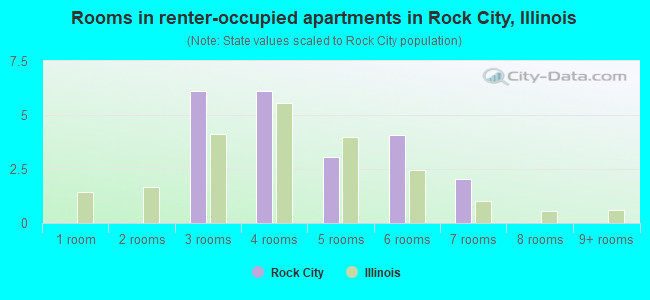
- Rooms in renter-occupied apartments in Rock City, Illinois
- 01 room
- 02 rooms
- 63 rooms
- 64 rooms
- 35 rooms
- 46 rooms
- 27 rooms
- 08 rooms
- 09+ rooms
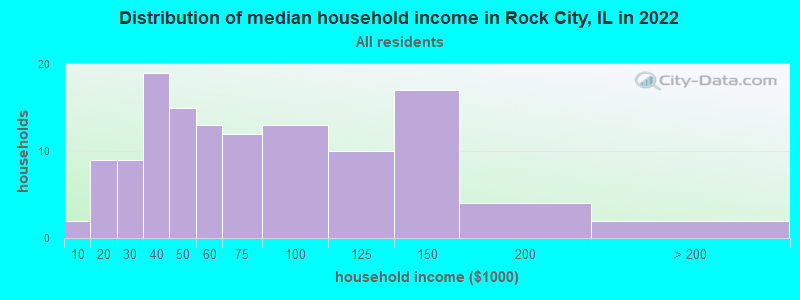
Rock City, IL household income distribution

- 2Less than $10,000
- 9$10,000 to $19,999
- 9$20,000 to $29,999
- 19$30,000 to $39,999
- 15$40,000 to $49,999
- 13$50,000 to $59,999
- 12$60,000 to $74,999
- 13$75,000 to $99,999
- 10$100,000 to $124,999
- 17$125,000 to $149,999
- 4$150,000 to $199,999
- 2$200,000 or more
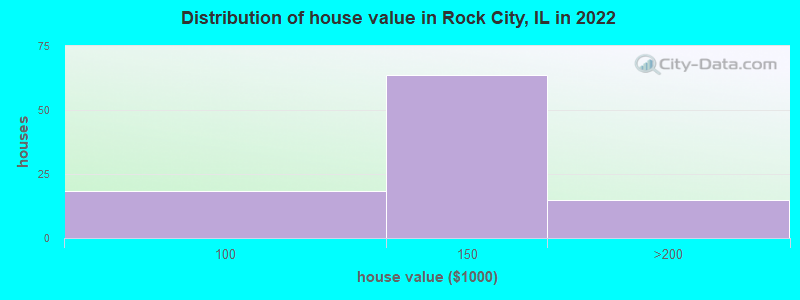
Home value of owner - occupied houses in 2022 in Rock City, IL
-
- 1$50,000 to $59,999
- 7$70,000 to $79,999
- 4$80,000 to $89,999
- 5$90,000 to $99,999
- 39$100,000 to $124,999
- 23$125,000 to $149,999
- 10$150,000 to $174,999
- 3$175,000 to $199,999
- 0$200,000 to $249,999
Rent paid by renters in 2022 in Rock City, IL
-
- 1$200 to $249
- 3$250 to $299
- 1$300 to $349
- 1$350 to $399
- 3$400 to $449
- 1$550 to $599
- 3$750 to $799
- 2$800 to $899
- 2$900 to $999
- 1$1,000 to $1,249
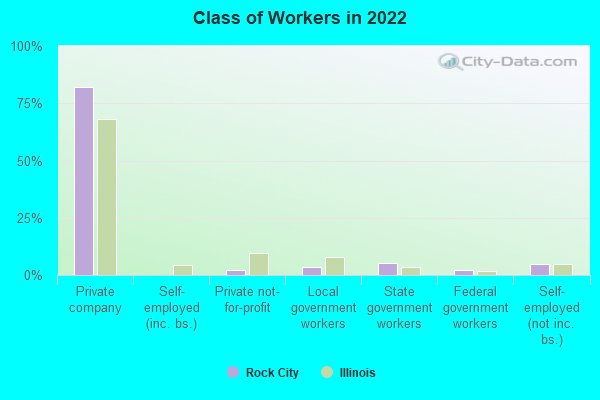
Percentage of workers working in this county: 58.6%
Number of people working at home: 22 (13.0% of all workers)
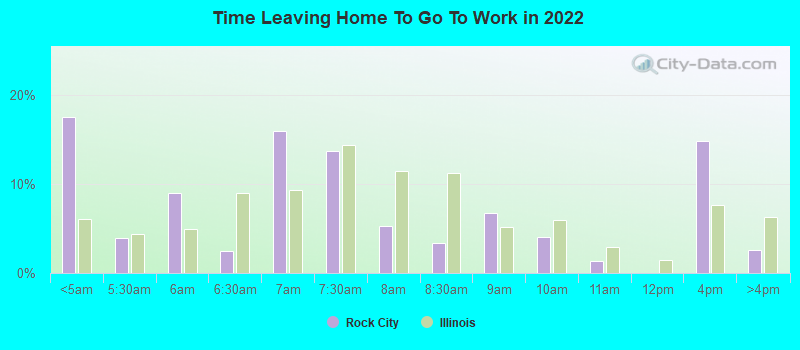
Travel time to work (commute)
- Less than 5 minutes: 10
- 5 to 9 minutes: 6
- 10 to 14 minutes: 13
- 15 to 19 minutes: 17
- 20 to 24 minutes: 21
- 25 to 29 minutes: 16
- 30 to 34 minutes: 15
- 35 to 39 minutes: 9
- 40 to 44 minutes: 2
- 45 to 59 minutes: 20
- 60 to 89 minutes: 6
- 90 or more minutes: 4
Means of transportation to work:
- Drove a car alone: 107 (74.8%)
- Carpooled: 10 (7.0%)
- Bicycle: 2 (1.4%)
- Walked: 3 (2.1%)
- Worked at home: 21 (14.7%)
- Unemployment by race in 2022
- Unemployment rate for White non-Hispanic residents
- 7.7%Males
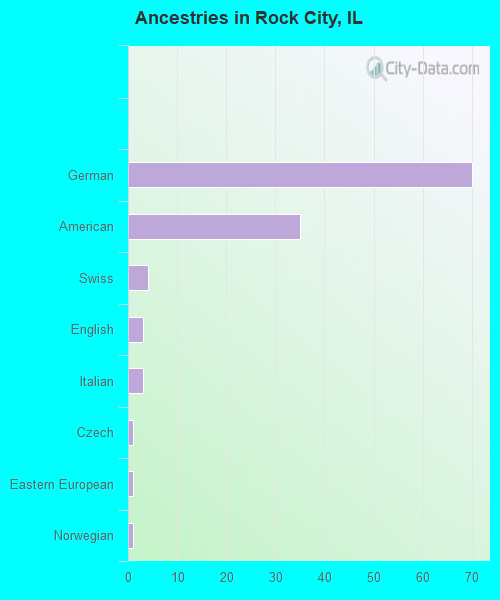
First ancestries reported:
- German: 70 (44.5%)
- American: 35 (22.3%)
- Swiss: 4 (2.5%)
- English: 3 (1.9%)
- Italian: 3 (1.9%)
- Czech: 1 (0.6%)
- Eastern European: 1 (0.6%)
- Norwegian: 1 (0.6%)
Place of birth for U.S.-born residents:
- This state: 225
- Other state: 107
- Northeast: 4
- Midwest: 86
- South: 10
- West: 7
95.5% of Rock City residents lived in the same house 1 years ago.
Out of people who lived in different houses, 40.9% lived in this county.
Out of people who lived in different counties, 25.0% lived in Illinois.
| Rock City: | 95.5% |
| State average: | 88.3% |
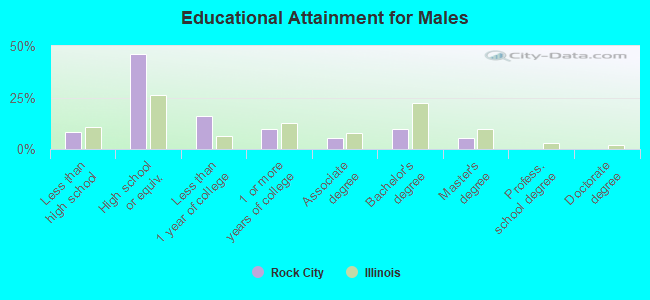
Education attainment for males 25 years and older:
- No schooling: 0
- Nursery to 4th grade: 0
- 5th and 6th grade: 0
- 7th and 8th grade: 0
- 9th grade: 3
- 10th grade: 0
- 11th grade: 0
- 12th grade, no diploma: 5
- High school graduate (or equivalency): 44
- Less than 1 year of college: 15
- Some college more than 1 year, no degree: 9
- Associate degree: 5
- Bachelor's degree: 9
- Master's degree: 5
- Professional school degree: 0
- Doctorate degree: 0
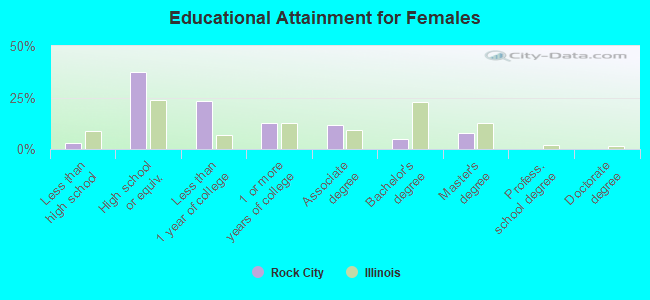
Education attainment for females 25 years and older:
- No schooling: 0
- Nursery to 4th grade: 0
- 5th and 6th grade: 0
- 7th and 8th grade: 1
- 9th grade: 0
- 10th grade: 0
- 11th grade: 2
- 12th grade, no diploma: 0
- High school graduate (or equivalency): 39
- Less than 1 year of college: 24
- Some college more than 1 year, no degree: 13
- Associate degree: 12
- Bachelor's degree: 5
- Master's degree: 8
- Professional school degree: 0
- Doctorate degree: 0


Housing units in structures:
- One, detached: 112
- Two: 1
- 3 or 4: 3
- 5 to 9: 7
- Mobile homes: 4
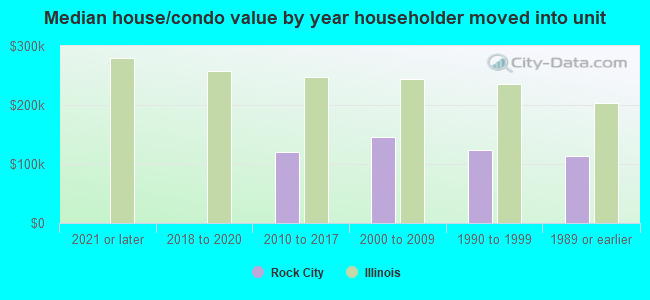
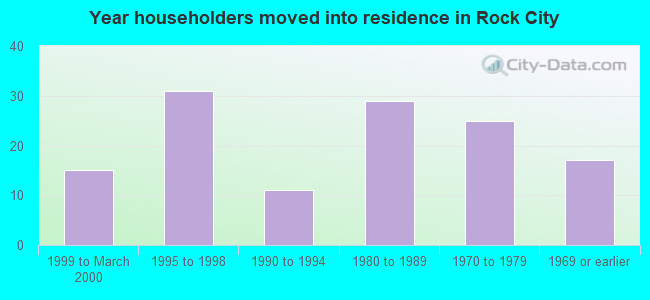
House/condo owner moved in on average 21 years ago
Renter moved in on average 3 years ago
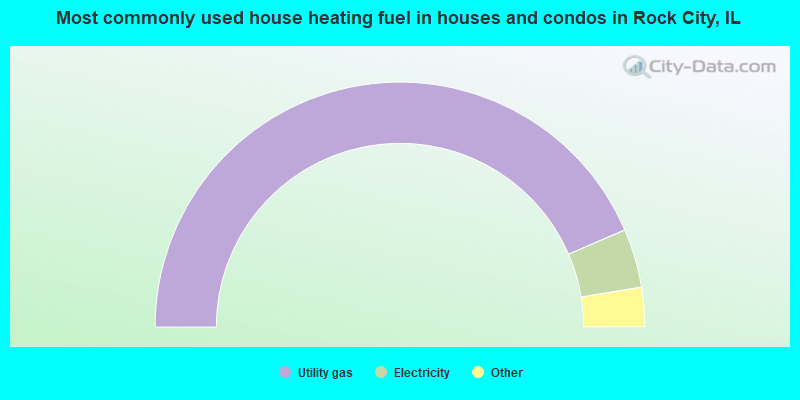
- 87.4%Utility gas
- 7.8%Electricity
- 1.9%Bottled, tank, or LP gas
- 1.9%Solar energy
- 1.0%Other fuel
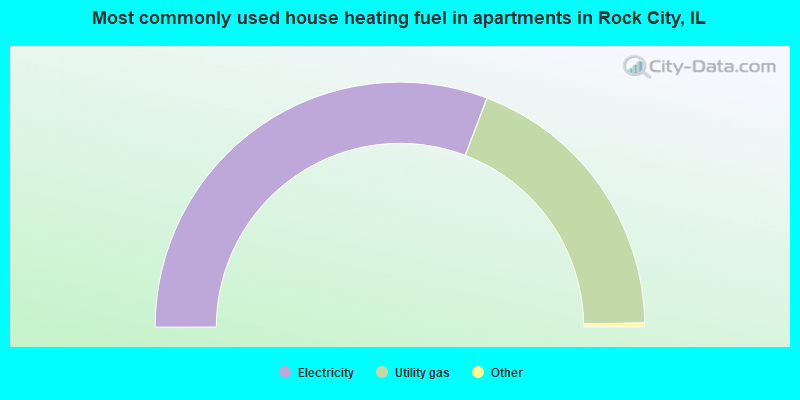
- 61.9%Electricity
- 38.1%Utility gas
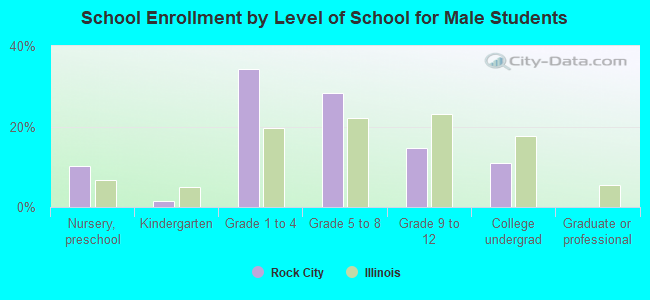
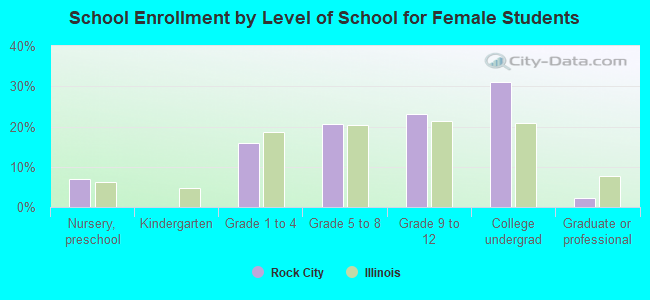
Private vs. public school enrollment:
| Here: | 0.0% |
| Illinois: | 13.3% |
| Here: | 22.2% |
| Illinois: | 9.9% |
| Here: | 26.3% |
| Illinois: | 27.4% |