Rossville, TN (Tennessee) Houses and Residents
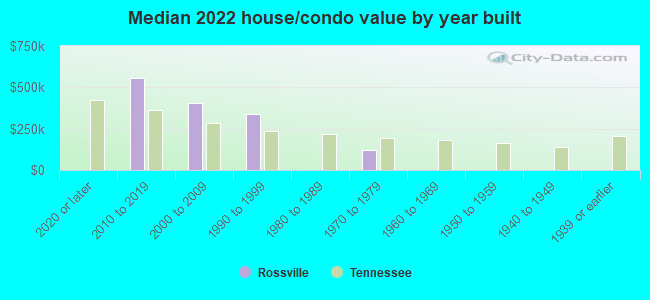
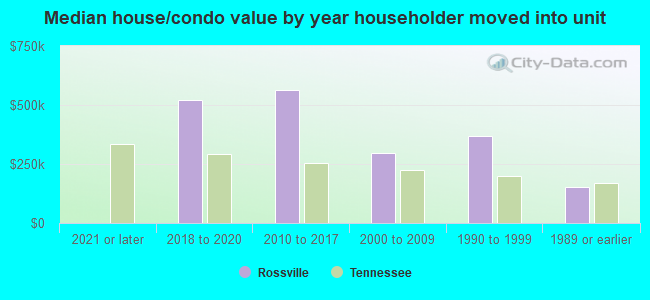
| Rossville: | $490,823 |
| Tennessee: | $284,800 |
Total population: 704 (Urban population: 0, Rural population: 397 (all nonfarm))
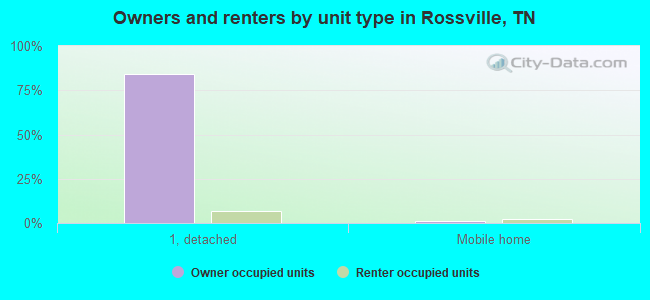
Houses: 519 (502 occupied: 438 owner occupied, 73 renter occupied)
| % of renters here: | 14% |
| State: | 33% |
Housing density: 301 houses/condos per square mile
Median price asked for vacant for-sale houses and condos in 2022: $4,212,508.
Median contract rent in 2022: $571
Median rent asked for vacant for-rent units in 2022: $819
Median gross rent in Rossville, TN in 2022: $798
Housing units in Rossville with a mortgage: 325 (13 second mortgage, 0 home equity loan, 13 both second mortgage and home equity loan)
Houses without a mortgage: 9
Median household income for houses/condos with a mortgage: $147,741
Median household income for apartments without a mortgage: $64,156
Median monthly housing costs: $1,535
Compare current foreclosures near Rossville, TN:
| Photo | Address | Area | Beds / Baths | Price | Details |
|---|---|---|---|---|---|

|
#1
Raleigh Lagrange Dr
Rossville, TN 38066
|
1,326 sq. feet
|
1 baths - beds |
show details | |

|
#2
Patterson St
Rossville, TN 38066
|
1,008 sq. feet
|
1 baths - beds |
show details | |

|
#3
Yancey Rd
Rossville, TN 38066
|
1,826 sq. feet
|
2 baths - beds |
show details | |

|
#4
Dewitt Rd
Rossville, TN 38066
|
1,025 sq. feet
|
1 baths - beds |
show details | |

|
#5
Habitat Cv
Rossville, TN 38066
|
1,040 sq. feet
|
1 baths - beds |
show details | |

|
#6
Bailey Ridge Cv
Rossville, TN 38066
|
2,276 sq. feet
|
3 baths - beds |
show details | |

|
#7
Rodeo Rd
Rossville, TN 38066
|
1,197 sq. feet
|
1 baths - beds |
show details | |

|
#8
Sunset Ridge Rd
Rossville, TN 38066
|
1,025 sq. feet
|
1 baths - beds |
show details | |

|
#9
Highway 193
Rossville, TN 38066
|
- sq. feet
|
- baths - beds |
show details | |

|
#10
Payne Rd
Rossville, TN 38066
|
- sq. feet
|
- baths - beds |
show details |
| Photo | Address | Area | Beds / Baths | Price | Details |
|---|---|---|---|---|---|

|
#11
Cotton Leaf Cv
Rossville, TN 38066
|
- sq. feet
|
- baths - beds |
show details | |

|
#12
Raleigh Lagrange Dr
Rossville, TN 38066
|
1,620 sq. feet
|
- baths - beds |
show details | |

|
#13
Ross Rd
Memphis, TN 38141
|
1,935 sq. feet
|
2 baths 3 beds |
$163,000
|
show details |

|
#14
Bending Elm Cv
Cordova, TN 38016
|
1,455 sq. feet
|
2 baths 3 beds |
show details | |

|
#15
Edney Ridge Dr
Cordova, TN 38016
|
3,435 sq. feet
|
3 baths 4 beds |
show details | |

|
#16
Beaver Run Dr
Collierville, TN 38017
|
2,764 sq. feet
|
2 baths 4 beds |
show details | |

|
#17
Brotherwood Cv
Collierville, TN 38017
|
3,241 sq. feet
|
3 baths 4 beds |
show details | |

|
#18
Cherry Spring Dr
Cordova, TN 38016
|
3,421 sq. feet
|
3 baths 5 beds |
show details | |

|
#19
Friars Pl
Cordova, TN 38016
|
2,402 sq. feet
|
2 baths 4 beds |
show details | |

|
#20
Harrell Dr
Arlington, TN 38002
|
1,425 sq. feet
|
1 baths 3 beds |
show details |
| Photo | Address | Area | Beds / Baths | Price | Details |
|---|---|---|---|---|---|

|
#21
Janie Bird Dr
Williston, TN 38076
|
1,117 sq. feet
|
1 baths 3 beds |
show details | |

|
#22
Barkley Glenn Dr
Collierville, TN 38017
|
2,854 sq. feet
|
3 baths 4 beds |
show details | |

|
#23
Carrol Ridge Ln
Cordova, TN 38016
|
2,508 sq. feet
|
2 baths 3 beds |
show details | |

|
#24
Greyhawk Cv N
Olive Branch, MS 38654
|
2,144 sq. feet
|
2 baths 3 beds |
show details | |

|
#25
S Germantown Rd
Memphis, TN 38125
|
2,033 sq. feet
|
2 baths 3 beds |
show details | |

|
#26
Tankerston Dr
Memphis, TN 38125
|
1,302 sq. feet
|
2 baths 3 beds |
show details | |

|
#27
Chimneyrock Blvd
Cordova, TN 38016
|
3,011 sq. feet
|
2 baths 4 beds |
show details | |

|
#28
Amberton Cv
Cordova, TN 38018
|
2,033 sq. feet
|
2 baths 4 beds |
show details | |

|
#29
Lloydminster Cv
Memphis, TN 38141
|
1,304 sq. feet
|
2 baths 3 beds |
show details | |

|
#30
Mabry Mill Rd
Cordova, TN 38016
|
- sq. feet
|
4 baths 5 beds |
show details |
| Photo | Address | Area | Beds / Baths | Price | Details |
|---|---|---|---|---|---|

|
#31
Michaelson Dr
Olive Branch, MS 38654
|
1,415 sq. feet
|
3 baths 5 beds |
show details | |

|
#32
Birch Glen Dr
Memphis, TN 38115
|
1,553 sq. feet
|
2 baths 3 beds |
show details | |

|
#33
Wesley Woods Cir
Cordova, TN 38018
|
2,652 sq. feet
|
2 baths 4 beds |
show details | |

|
#34
Elderberry Ln
Cordova, TN 38016
|
2,639 sq. feet
|
2 baths 3 beds |
show details | |

|
#35
Gertrude Dr
Memphis, TN 38125
|
3,207 sq. feet
|
3 baths 5 beds |
show details | |

|
#36
Hollyview Dr
Memphis, TN 38125
|
2,330 sq. feet
|
3 baths 4 beds |
show details | |

|
#37
Smith Mill Cv
Memphis, TN 38125
|
1,553 sq. feet
|
2 baths 3 beds |
show details | |

|
#38
Richwood Pl
Memphis, TN 38125
|
2,422 sq. feet
|
2 baths 4 beds |
show details | |

|
#39
Chimneyrock Blvd
Cordova, TN 38016
|
3,196 sq. feet
|
2 baths 4 beds |
show details | |

|
#40
Brent Ln
Cordova, TN 38016
|
3,565 sq. feet
|
3 baths 4 beds |
show details |
| Photo | Address | Area | Beds / Baths | Price | Details |
|---|---|---|---|---|---|

|
#41
Bevy Ridge Ln
Memphis, TN 38125
|
2,228 sq. feet
|
3 baths 4 beds |
show details | |

|
#42
Bevy Ridge Ln
Memphis, TN 38125
|
2,335 sq. feet
|
3 baths 4 beds |
show details | |

|
#43
Fairwind Cv
Memphis, TN 38125
|
2,697 sq. feet
|
2 baths 4 beds |
show details | |

|
#44
Speerberry Ln
Cordova, TN 38016
|
3,342 sq. feet
|
2 baths 4 beds |
show details | |

|
#45
Keynon Dr
Memphis, TN 38125
|
1,776 sq. feet
|
2 baths 3 beds |
show details | |

|
#46
Keynon Dr
Memphis, TN 38125
|
1,844 sq. feet
|
2 baths 3 beds |
show details | |

|
#47
Winter Harbor Ln
Memphis, TN 38125
|
2,231 sq. feet
|
3 baths 3 beds |
show details | |

|
#48
Winter Harbor Ln
Memphis, TN 38125
|
2,108 sq. feet
|
2 baths 4 beds |
show details | |

|
#49
Timber Creek Dr
Cordova, TN 38018
|
2,703 sq. feet
|
3 baths 5 beds |
show details | |

|
Check over 1 million property listings on Foreclosure.com!
|
browse all offers | |||

Latest news about housing in Rossville, TN collected exclusively by city-data.com from local newspapers, TV, and radio stations

 | Tennessee's 2020 Census results (70 replies) |
| 2018 TN Population Estimates (24 replies) |
| Does anyone remember the "Courts" apartments? (1 reply) |
| Kitchen tile and countertop stores (1 reply) |
| Nice Rural Country Places Near Memphis? (10 replies) |
| Moving to East Ridge...Teach me!!! (4 replies) |

Median year apartment built: 1981
Household type by relationship:
Households: 1,206- Male householders: 306 (61 living alone), Female householders: 190 (49 living alone)
287 spouses (287 opposite-sex spouses), 11 unmarried partners, (11 opposite-sex unmarried partners), 251 children (213 natural, 3 adopted, 34 stepchildren), 5 grandchildren, 34 brothers or sisters, 27 parents, 2 foster children, 31 other relatives, 59 non-relatives
Size of family households: 193 2-persons, 100 3-persons, 46 4-persons, 20 5-persons, 3 6-persons.
Size of nonfamily households: 112 1-person, 35 2-persons.
128 married couples with children.
20 single-parent households (4 men, 16 women).
95.0% of residents of Rossville speak English at home.
2.0% of residents speak Spanish at home (100% speak English very well).
2.8% of residents speak Asian or Pacific Island language at home (44% speak English very well, 47% speak English well, 9% speak English not well).
Foreign born population: 39 (3.2%)
(53.8% of them are naturalized citizens)
| Here: | 7.7 |
| State: | 6.5 |
| Here: | 4.1 |
| State: | 4.4 |
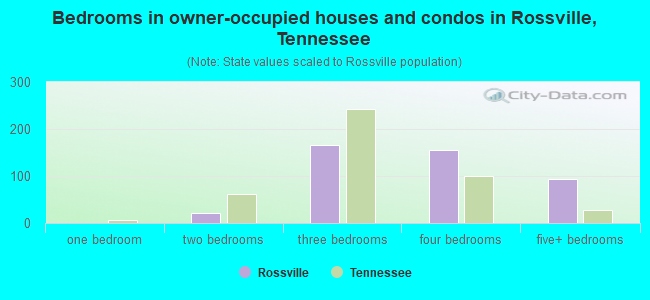
- Bedrooms in owner-occupied houses and condos in Rossville, Tennessee
- 0no bedroom
- 01 bedroom
- 212 bedrooms
- 1673 bedrooms
- 1564 bedrooms
- 945+ bedrooms
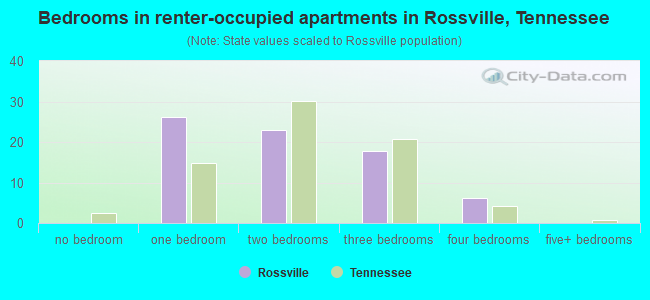
- Bedrooms in renter-occupied apartments in Rossville, Tennessee
- 0no bedroom
- 261 bedroom
- 232 bedrooms
- 183 bedrooms
- 64 bedrooms
- 05+ bedrooms
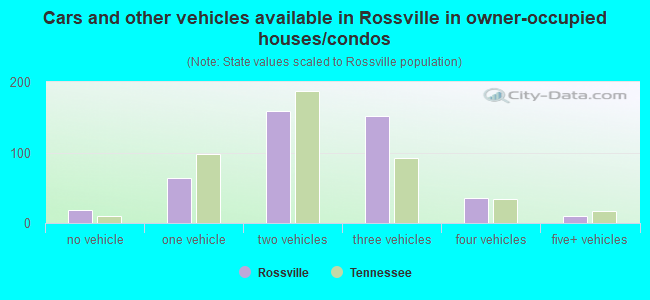
- Cars and other vehicles available in Rossville in owner-occupied houses/condos
- 18no vehicle
- 641 vehicle
- 1592 vehicles
- 1523 vehicles
- 354 vehicles
- 105+ vehicles
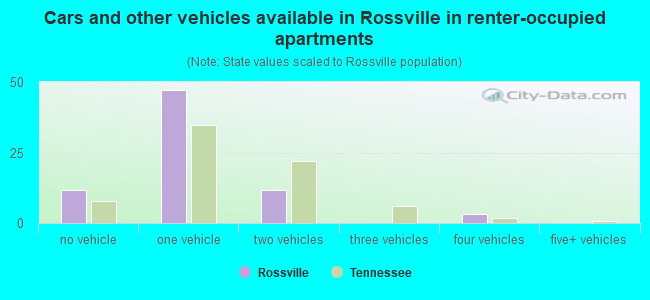
- Cars and other vehicles available in Rossville in renter-occupied apartments
- 12no vehicle
- 471 vehicle
- 122 vehicles
- 03 vehicles
- 34 vehicles
- 05+ vehicles
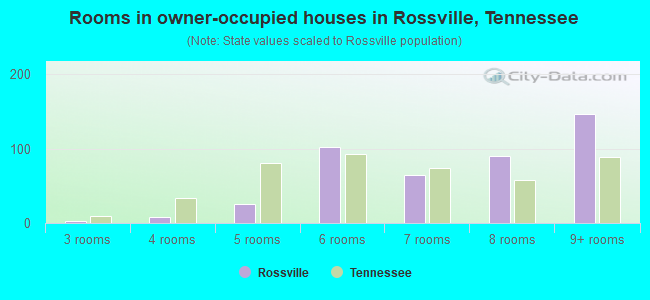
- Rooms in owner-occupied houses in Rossville, Tennessee
- 01 room
- 02 rooms
- 33 rooms
- 84 rooms
- 255 rooms
- 1026 rooms
- 647 rooms
- 908 rooms
- 1469+ rooms
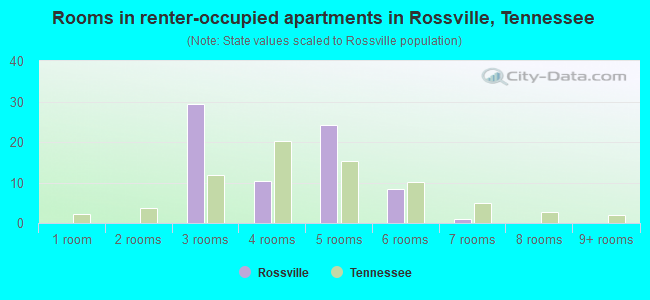
- Rooms in renter-occupied apartments in Rossville, Tennessee
- 01 room
- 02 rooms
- 293 rooms
- 104 rooms
- 245 rooms
- 86 rooms
- 17 rooms
- 08 rooms
- 09+ rooms
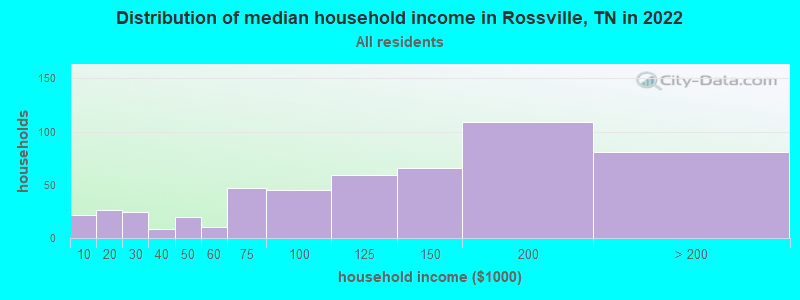
Rossville, TN household income distribution

- 22Less than $10,000
- 26$10,000 to $19,999
- 24$20,000 to $29,999
- 8$30,000 to $39,999
- 20$40,000 to $49,999
- 10$50,000 to $59,999
- 47$60,000 to $74,999
- 45$75,000 to $99,999
- 59$100,000 to $124,999
- 66$125,000 to $149,999
- 109$150,000 to $199,999
- 81$200,000 or more
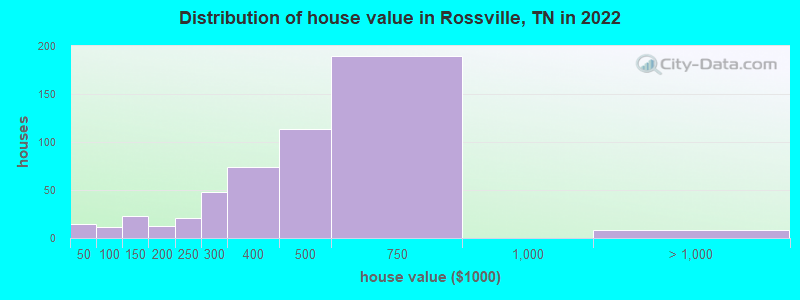
Home value of owner - occupied houses in 2022 in Rossville, TN
-
- 7Less than $10,000
- 4$15,000 to $19,999
- 2$20,000 to $24,999
- 1$40,000 to $49,999
- 3$80,000 to $89,999
- 6$90,000 to $99,999
- 12$100,000 to $124,999
- 10$125,000 to $149,999
- 2$150,000 to $174,999
- 10$175,000 to $199,999
- 21$200,000 to $249,999
- 47$250,000 to $299,999
- 74$300,000 to $399,999
- 113$400,000 to $499,999
- 190$500,000 to $749,999
- 4$1,000,000 to $1,499,999
- 3$1,500,000 to $1,999,999
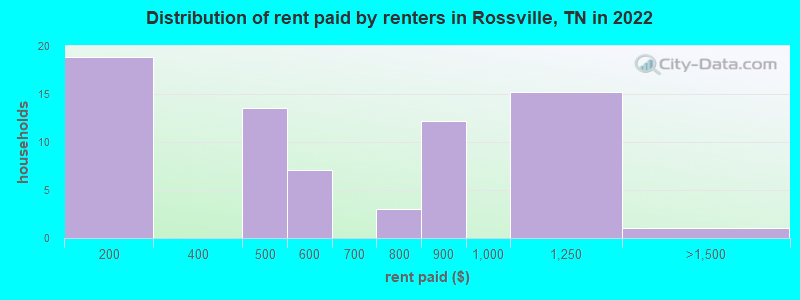
Rent paid by renters in 2022 in Rossville, TN
-
- 18$150 to $199
- 8$400 to $449
- 5$450 to $499
- 4$500 to $549
- 2$550 to $599
- 2$750 to $799
- 12$800 to $899
- 15$1,000 to $1,249
- 1$1,250 to $1,499
Percentage of workers working in this county: 22.4%
Number of people working at home: 90 (13.4% of all workers)
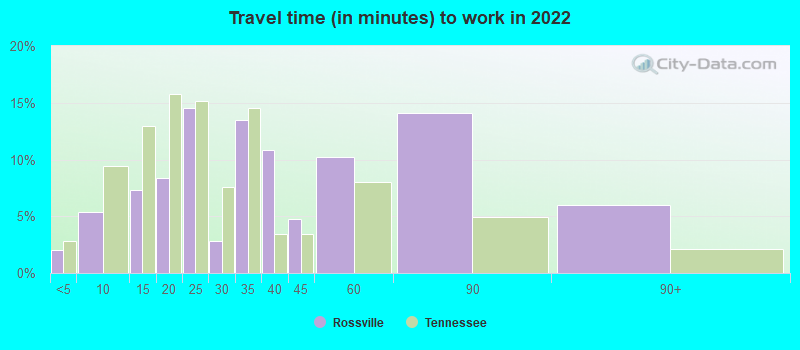
Travel time to work (commute)
- Less than 5 minutes: 13
- 5 to 9 minutes: 11
- 10 to 14 minutes: 61
- 15 to 19 minutes: 37
- 20 to 24 minutes: 79
- 25 to 29 minutes: 38
- 30 to 34 minutes: 121
- 35 to 39 minutes: 34
- 40 to 44 minutes: 74
- 45 to 59 minutes: 90
- 60 to 89 minutes: 13
- 90 or more minutes: 3
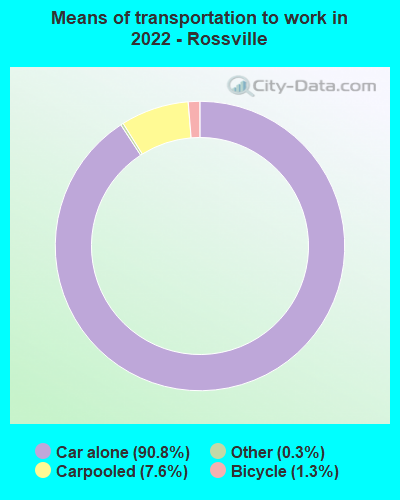
Means of transportation to work:
- Drove a car alone: 836 (80.9%)
- Carpooled: 73 (7.1%)
- Taxi: 3 (0.3%)
- Bicycle: 13 (1.3%)
- Worked at home: 90 (8.7%)
- Unemployment by race in 2022
- Unemployment rate for White non-Hispanic residents
- 1.3%Males
- 2.0%Females
- Unemployment rate for Black residents
- 18.4%Males
- 33.6%Females
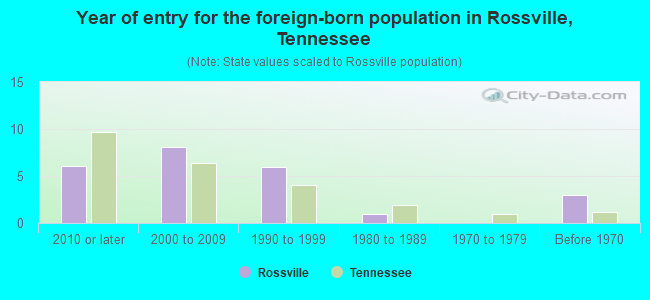
- Year of entry for the foreign-born population in Rossville, Tennessee
- 62010 or later
- 82000 to 2009
- 61990 to 1999
- 11980 to 1989
- 01970 to 1979
- 3Before 1970
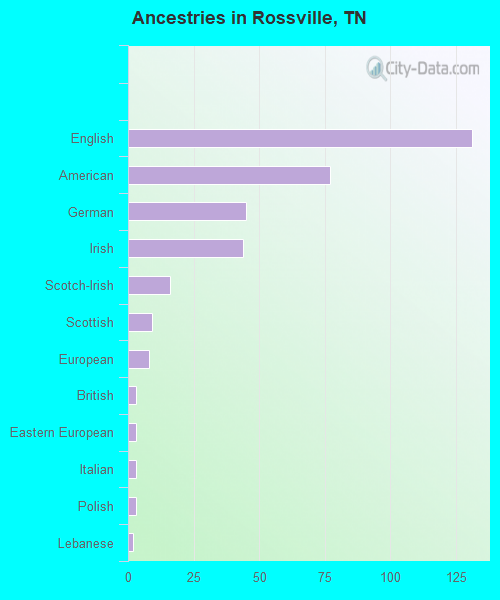
First ancestries reported:
- English: 131 (24.4%)
- American: 77 (14.3%)
- German: 45 (8.4%)
- Irish: 44 (8.2%)
- Scotch-Irish: 16 (3.0%)
- Scottish: 9 (1.7%)
- European: 8 (1.5%)
- British: 3 (0.6%)
- Eastern European: 3 (0.6%)
- Italian: 3 (0.6%)
- Polish: 3 (0.6%)
- Lebanese: 2 (0.4%)
- Portuguese: 1 (0.2%)
Most common places of birth for foreign-born residents (%):
| Rossville: | 28.2% (11) |
| Tennessee: | 0.7% (2,485) |
| Rossville: | 28.2% (11) |
| Tennessee: | 2.4% (8,894) |
| Rossville: | 17.9% (7) |
| Tennessee: | 1.6% (5,936) |
| Rossville: | 12.8% (5) |
| Tennessee: | 23.0% (86,435) |
| Rossville: | 7.7% (3) |
| Tennessee: | 2.2% (8,261) |
| Rossville: | 5.1% (2) |
| Tennessee: | 2.3% (8,490) |
| Rossville: | 5.1% (2) |
| Tennessee: | 3.3% (12,582) |
| Rossville: | 5.1% (2) |
| Tennessee: | 1.2% (4,587) |
Place of birth for U.S.-born residents:
- This state: 789
- Other state: 365
- Northeast: 57
- Midwest: 65
- South: 205
- West: 37
92.4% of Rossville residents lived in the same house 1 years ago.
Out of people who lived in different houses, 13.1% lived in this county.
Out of people who lived in different counties, 47.1% lived in Tennessee.
| Rossville: | 92.4% |
| State average: | 87.0% |
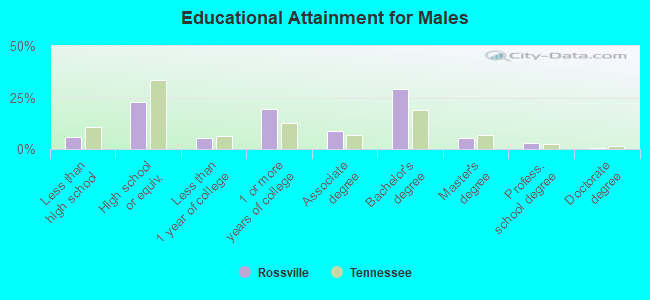
Education attainment for males 25 years and older:
- No schooling: 0
- Nursery to 4th grade: 0
- 5th and 6th grade: 0
- 7th and 8th grade: 0
- 9th grade: 3
- 10th grade: 0
- 11th grade: 0
- 12th grade, no diploma: 24
- High school graduate (or equivalency): 103
- Less than 1 year of college: 24
- Some college more than 1 year, no degree: 88
- Associate degree: 39
- Bachelor's degree: 131
- Master's degree: 23
- Professional school degree: 13
- Doctorate degree: 2
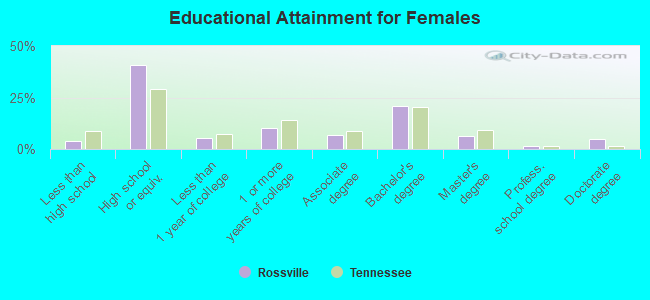
Education attainment for females 25 years and older:
- No schooling: 9
- Nursery to 4th grade: 0
- 5th and 6th grade: 0
- 7th and 8th grade: 0
- 9th grade: 0
- 10th grade: 9
- 11th grade: 0
- 12th grade, no diploma: 3
- High school graduate (or equivalency): 210
- Less than 1 year of college: 27
- Some college more than 1 year, no degree: 53
- Associate degree: 35
- Bachelor's degree: 107
- Master's degree: 32
- Professional school degree: 8
- Doctorate degree: 24


Housing units in structures:
- One, detached: 475
- 5 to 9: 13
- 10 to 19: 2
- 20 to 49: 9
- 50 or more: 1
- Mobile homes: 18
Housing units lacking complete kitchen facilities in 2022: 3.2%
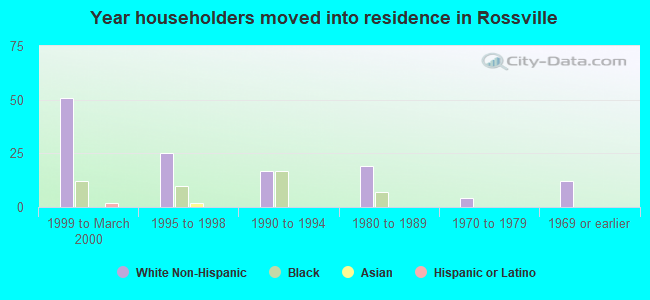
House/condo owner moved in on average 6 years ago
Renter moved in on average 6 years ago
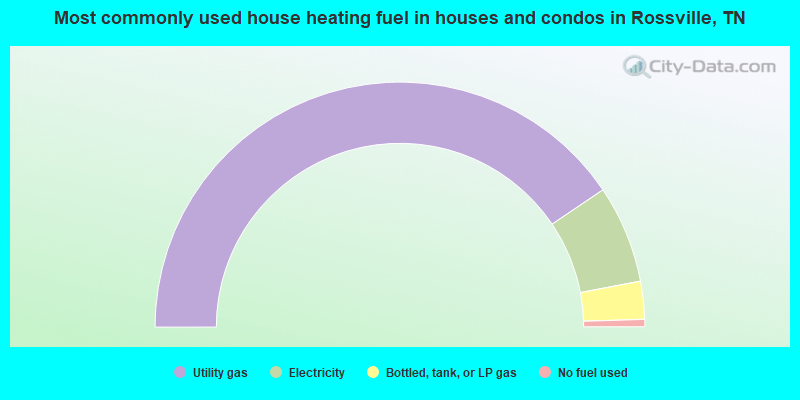
- 81.1%Utility gas
- 12.9%Electricity
- 5.0%Bottled, tank, or LP gas
- 1.0%No fuel used
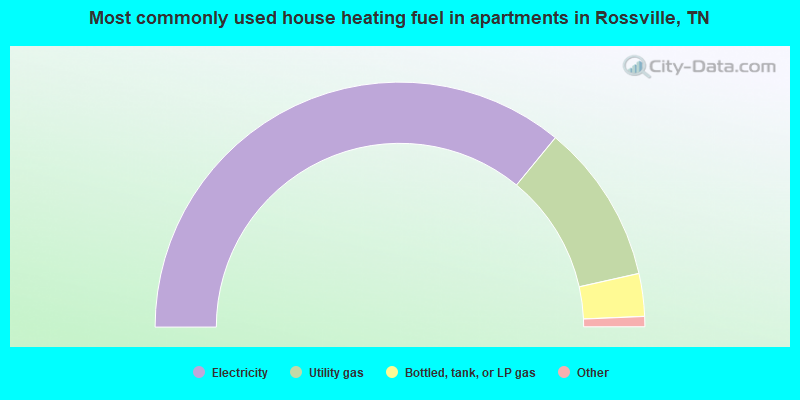
- 72.9%Electricity
- 21.4%Utility gas
- 5.7%Bottled, tank, or LP gas
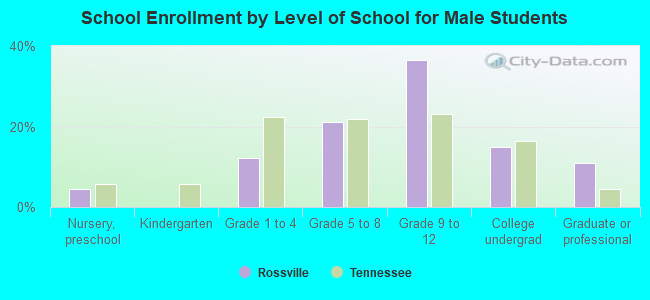
Private vs. public school enrollment:
| Here: | 44.8% |
| Tennessee: | 15.0% |
| Here: | 63.4% |
| Tennessee: | 16.2% |
| Here: | 35.1% |
| Tennessee: | 23.5% |