Salt Lick, KY (Kentucky) Houses and Residents
| Salt Lick: | $91,718 |
| Kentucky: | $196,300 |
Mean price in 2022:
Detached houses: $150,902
Here: $150,902 State: $256,452 Mobile homes: $64,559
Here: $64,559 State: $84,635
Total population: 320 (Urban population: 0, Rural population: 352 (all nonfarm))
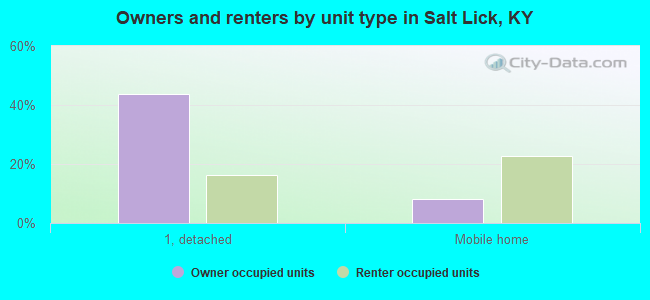
Houses: 178 (149 occupied: 84 owner occupied, 68 renter occupied)
| % of renters here: | 45% |
| State: | 31% |
Housing density: 228 houses/condos per square mile
Median price asked for vacant for-sale houses and condos in 2022 in this county: $192,244.
Median contract rent in 2022: $474 (lower quartile is $449, upper quartile is $508)
Median rent asked for vacant for-rent units in 2022: $530
Median gross rent in Salt Lick, KY in 2022: $648
Housing units in Salt Lick with a mortgage: 40 (1 second mortgage, 2 home equity loan, 0 both second mortgage and home equity loan)
Houses without a mortgage: 0
Compare current foreclosures near Salt Lick, KY:
| Photo | Address | Area | Beds / Baths | Price | Details |
|---|---|---|---|---|---|

|
#1
River Ln
Salt Lick, KY 40371
|
1,300 sq. feet
|
2 baths 3 beds |
show details | |

|
#2
S Hwy 211
Salt Lick, KY 40371
|
1,344 sq. feet
|
1 baths 4 beds |
show details | |

|
#3
Old Sand Rd
Salt Lick, KY 40371
|
1,188 sq. feet
|
2 baths 2 beds |
show details | |

|
#4
Mulberry Ln
Salt Lick, KY 40371
|
- sq. feet
|
- baths - beds |
show details | |

|
#5
Apache Park Rd
Salt Lick, KY 40371
|
2,016 sq. feet
|
- baths - beds |
show details | |

|
#6
Hawkins Branch Rd
Frenchburg, KY 40322
|
- sq. feet
|
1 baths 3 beds |
$44,900
|
show details |

|
#7
E Fork Rd
Means, KY 40346
|
1,463 sq. feet
|
1 baths 3 beds |
show details | |

|
#8
E Fork Rd
Means, KY 40346
|
- sq. feet
|
1 baths 3 beds |
show details | |

|
#9
Grab Nickell Hl
Morehead, KY 40351
|
1,680 sq. feet
|
2 baths 3 beds |
show details | |

|
#10
Foster Branch Road
Jeffersonville, KY 40337
|
- sq. feet
|
2 baths 4 beds |
show details |
| Photo | Address | Area | Beds / Baths | Price | Details |
|---|---|---|---|---|---|

|
#11
Muses Mill Rd
Wallingford, KY 41093
|
976 sq. feet
|
1 baths 2 beds |
show details | |

|
#12
Justin Dr
Morehead, KY 40351
|
972 sq. feet
|
1 baths 3 beds |
show details | |

|
#13
Maple Ln
Morehead, KY 40351
|
1,152 sq. feet
|
1 baths 2 beds |
show details | |

|
#14
Sunset Rd
Hillsboro, KY 41049
|
1,344 sq. feet
|
2 baths 3 beds |
show details | |

|
#15
Mudsock Rd
Hillsboro, KY 41049
|
2,240 sq. feet
|
- baths 4 beds |
show details | |

|
#16
Doc Mullins Rd
Frenchburg, KY 40322
|
- sq. feet
|
- baths - beds |
show details | |

|
#17
Wilder Loop Rd
Wallingford, KY 41093
|
980 sq. feet
|
- baths - beds |
show details | |

|
#18
Us Highway 460 W
Frenchburg, KY 40322
|
- sq. feet
|
- baths - beds |
show details | |

|
#19
Dewlon Ct
Means, KY 40346
|
- sq. feet
|
- baths - beds |
show details | |

|
#20
Morning View Ln
Owingsville, KY 40360
|
- sq. feet
|
- baths - beds |
show details |
| Photo | Address | Area | Beds / Baths | Price | Details |
|---|---|---|---|---|---|

|
#21
Mccausey Rdg
Frenchburg, KY 40322
|
- sq. feet
|
- baths - beds |
show details | |

|
#22
Dale Back Rd
Frenchburg, KY 40322
|
- sq. feet
|
- baths - beds |
show details | |

|
#23
Clay Lick Rd
Jeffersonville, KY 40337
|
- sq. feet
|
- baths - beds |
show details | |

|
#24
Ky Highway 1050
Jeffersonville, KY 40337
|
- sq. feet
|
- baths - beds |
show details | |

|
#25
Sunrise Ln
Denniston, KY 40316
|
- sq. feet
|
- baths - beds |
show details | |

|
#26
Pebble Creek Rd
Morehead, KY 40351
|
- sq. feet
|
- baths - beds |
show details | |

|
#27
Cave Run Hts
Wellington, KY 40387
|
- sq. feet
|
- baths - beds |
show details | |

|
#28
Martha Branch Dr
Mount Sterling, KY 40353
|
- sq. feet
|
- baths - beds |
show details | |

|
#29
Cadence Branch Dr Apt B
Mount Sterling, KY 40353
|
- sq. feet
|
- baths - beds |
show details | |

|
#30
Mccormick Rd
Mount Sterling, KY 40353
|
- sq. feet
|
- baths - beds |
show details |
| Photo | Address | Area | Beds / Baths | Price | Details |
|---|---|---|---|---|---|

|
#31
Windy Ridge Ln
Owingsville, KY 40360
|
- sq. feet
|
- baths - beds |
show details | |

|
#32
Twin Oaks Rd
Wellington, KY 40387
|
- sq. feet
|
- baths - beds |
show details | |

|
#33
Rodburn Hollow Rd
Morehead, KY 40351
|
1,728 sq. feet
|
- baths - beds |
show details | |

|
#34
Brockman Ln
Morehead, KY 40351
|
- sq. feet
|
- baths - beds |
show details | |

|
#35
Lower Licking Rd
Morehead, KY 40351
|
- sq. feet
|
- baths - beds |
show details | |

|
#36
Pendleton Branch Rd
Olympia, KY 40358
|
- sq. feet
|
- baths - beds |
show details | |

|
#37
Baseline Dr
Morehead, KY 40351
|
1,835 sq. feet
|
- baths - beds |
show details | |

|
#38
Mae Berryman Way
Owingsville, KY 40360
|
- sq. feet
|
- baths - beds |
show details | |

|
#39
Pleasant Vly
Morehead, KY 40351
|
- sq. feet
|
- baths - beds |
show details | |

|
#40
Morganview Rd
Wellington, KY 40387
|
- sq. feet
|
- baths - beds |
show details |
| Photo | Address | Area | Beds / Baths | Price | Details |
|---|---|---|---|---|---|

|
#41
Caudill Cemetery Rd
Morehead, KY 40351
|
- sq. feet
|
- baths - beds |
show details | |

|
#42
Collins Ln
Clearfield, KY 40313
|
- sq. feet
|
- baths - beds |
show details | |

|
#43
Boodry Pl Apt 304
Morehead, KY 40351
|
- sq. feet
|
- baths - beds |
show details | |

|
#44
Charlie Ingram Rd
Wellington, KY 40387
|
- sq. feet
|
- baths - beds |
show details | |

|
#45
Ridge Rd
Owingsville, KY 40360
|
- sq. feet
|
- baths - beds |
show details | |

|
#46
Tolan Rd
Frenchburg, KY 40322
|
- sq. feet
|
- baths - beds |
show details | |

|
#47
Kentucky Dr
Mount Sterling, KY 40353
|
- sq. feet
|
- baths - beds |
show details | |

|
#48
W 1st St Apt 2
Morehead, KY 40351
|
- sq. feet
|
- baths - beds |
show details | |

|
#49
Us Highway 460 E
Wellington, KY 40387
|
- sq. feet
|
- baths - beds |
show details | |

|
Check over 1 million property listings on Foreclosure.com!
|
browse all offers | |||


Median year apartment built: 1975
Household type by relationship:
Households: 376- Male householders: 78 (20 living alone), Female householders: 70 (21 living alone)
76 spouses (76 opposite-sex spouses), 18 unmarried partners, (18 opposite-sex unmarried partners), 108 children (89 natural, 1 adopted, 18 stepchildren), 13 grandchildren, 0 brothers or sisters, 7 parents, 0 foster children, 2 other relatives, 4 non-relatives
Size of family households: 40 2-persons, 17 3-persons, 22 4-persons, 21 5-persons, 3 6-persons.
Size of nonfamily households: 43 1-person, 5 2-persons.
37 married couples with children.
69 single-parent households (0 men, 69 women).
99.7% of residents of Salt Lick speak English at home.
Foreign born population: 7 (1.9%)
(57.1% of them are naturalized citizens)
| Here: | 6.2 |
| State: | 6.4 |
| Here: | 4.6 |
| State: | 4.4 |
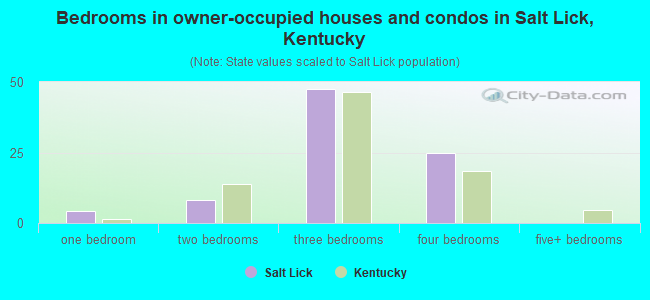
- Bedrooms in owner-occupied houses and condos in Salt Lick, Kentucky
- 0no bedroom
- 41 bedroom
- 82 bedrooms
- 483 bedrooms
- 254 bedrooms
- 05+ bedrooms
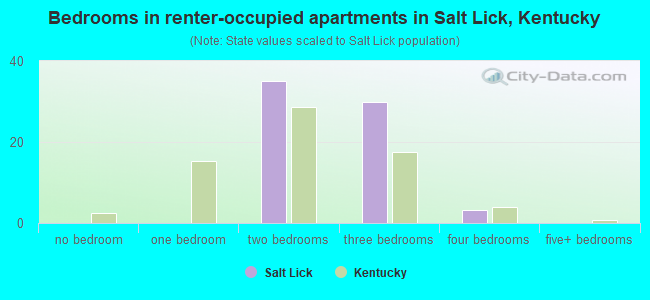
- Bedrooms in renter-occupied apartments in Salt Lick, Kentucky
- 0no bedroom
- 01 bedroom
- 352 bedrooms
- 303 bedrooms
- 34 bedrooms
- 05+ bedrooms
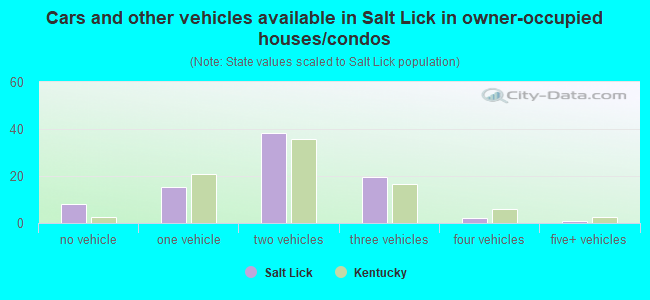
- Cars and other vehicles available in Salt Lick in owner-occupied houses/condos
- 8no vehicle
- 161 vehicle
- 382 vehicles
- 203 vehicles
- 24 vehicles
- 15+ vehicles
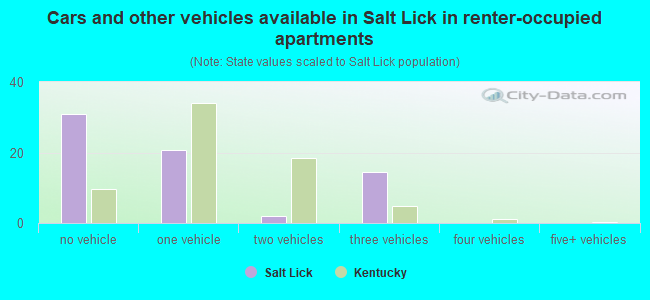
- Cars and other vehicles available in Salt Lick in renter-occupied apartments
- 31no vehicle
- 211 vehicle
- 22 vehicles
- 143 vehicles
- 04 vehicles
- 05+ vehicles
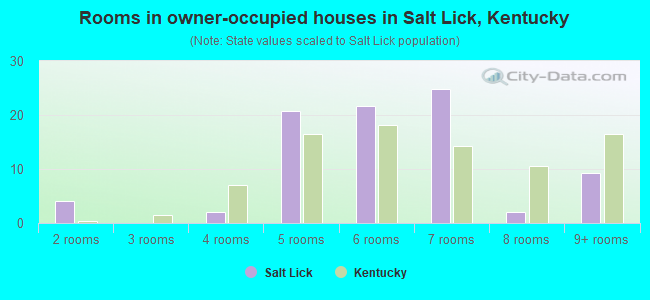
- Rooms in owner-occupied houses in Salt Lick, Kentucky
- 01 room
- 42 rooms
- 03 rooms
- 24 rooms
- 215 rooms
- 226 rooms
- 257 rooms
- 28 rooms
- 99+ rooms
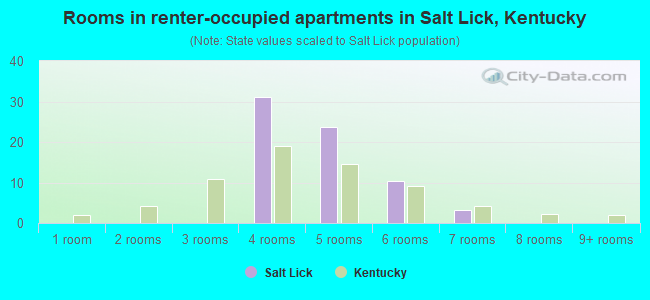
- Rooms in renter-occupied apartments in Salt Lick, Kentucky
- 01 room
- 02 rooms
- 03 rooms
- 314 rooms
- 245 rooms
- 106 rooms
- 37 rooms
- 08 rooms
- 09+ rooms
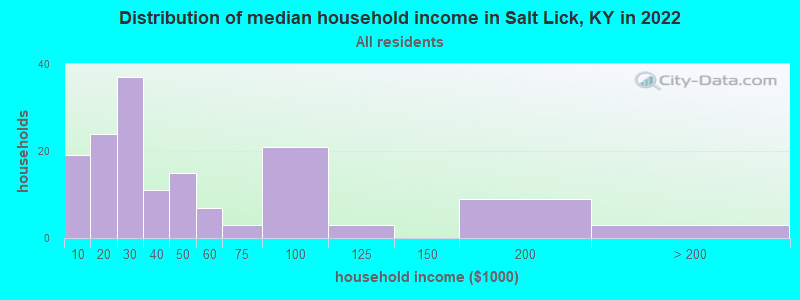
Salt Lick, KY household income distribution

- 19Less than $10,000
- 24$10,000 to $19,999
- 37$20,000 to $29,999
- 11$30,000 to $39,999
- 15$40,000 to $49,999
- 7$50,000 to $59,999
- 3$60,000 to $74,999
- 21$75,000 to $99,999
- 3$100,000 to $124,999
- 9$150,000 to $199,999
- 3$200,000 or more
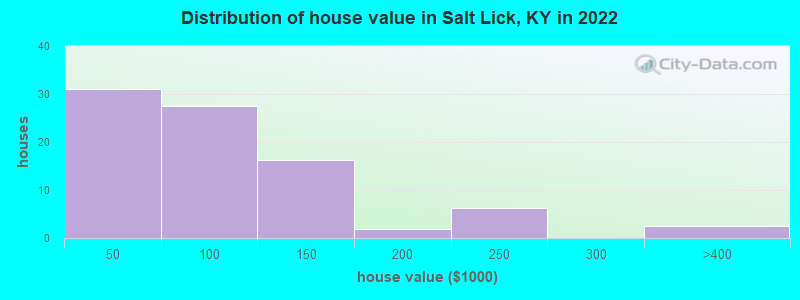
Home value of owner - occupied houses in 2022 in Salt Lick, KY
-
- 22$30,000 to $34,999
- 8$40,000 to $49,999
- 1$50,000 to $59,999
- 5$60,000 to $69,999
- 9$80,000 to $89,999
- 1$90,000 to $99,999
- 5$100,000 to $124,999
- 10$125,000 to $149,999
- 1$175,000 to $199,999
- 6$200,000 to $249,999
- 2$300,000 to $399,999
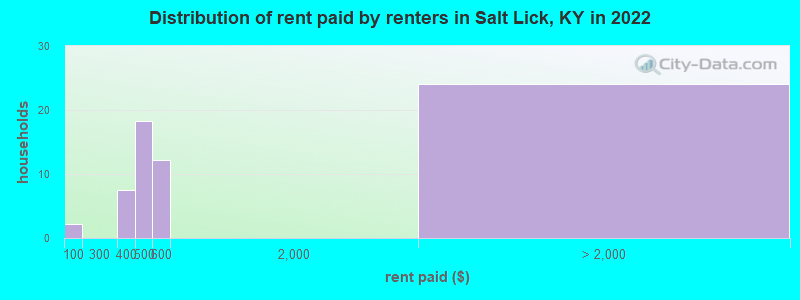
Rent paid by renters in 2022 in Salt Lick, KY
-
- 2Less than $100
- 7$350 to $399
- 18$450 to $499
- 11$500 to $549
- 0$550 to $599
- 24No cash rent
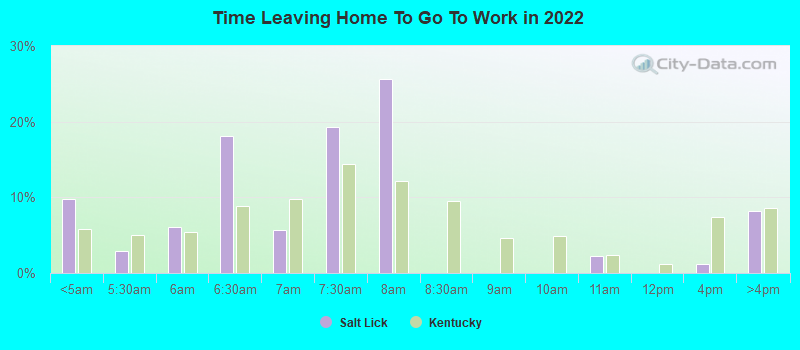
Percentage of workers working in this county: 38.5%
Number of people working at home: 14 (14.6% of all workers)
Travel time to work (commute)
- Less than 5 minutes: 8
- 5 to 9 minutes: 0
- 10 to 14 minutes: 0
- 15 to 19 minutes: 38
- 20 to 24 minutes: 6
- 25 to 29 minutes: 0
- 30 to 34 minutes: 4
- 35 to 39 minutes: 2
- 40 to 44 minutes: 0
- 45 to 59 minutes: 5
- 60 to 89 minutes: 11
- 90 or more minutes: 6
Means of transportation to work:
- Drove a car alone: 94 (80.3%)
- Carpooled: 19 (16.2%)
- Walked: 2 (1.7%)
- Other means: 2 (1.7%)
- Unemployment by race in 2022
- Unemployment rate for White non-Hispanic residents
- 19.0%Males
- 13.0%Females
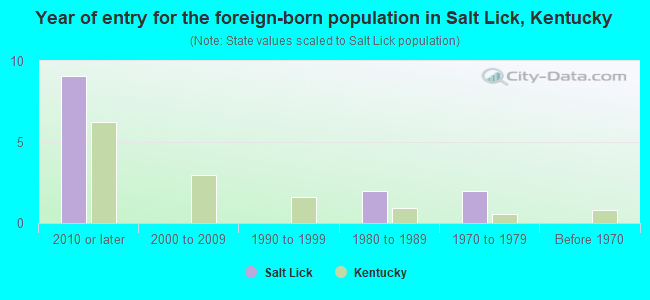
- Year of entry for the foreign-born population in Salt Lick, Kentucky
- 92010 or later
- 02000 to 2009
- 01990 to 1999
- 21980 to 1989
- 21970 to 1979
- 0Before 1970
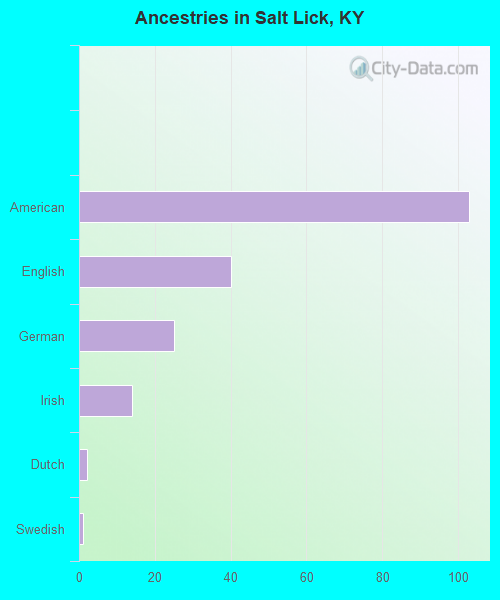
First ancestries reported:
- American: 103 (40.4%)
- English: 40 (15.7%)
- German: 25 (9.8%)
- Irish: 14 (5.5%)
- Dutch: 2 (0.8%)
- Swedish: 1 (0.4%)
Most common places of birth for foreign-born residents (%):
| Salt Lick: | 100.0% (8) |
| Kentucky: | 0.7% (1,327) |
Place of birth for U.S.-born residents:
- This state: 265
- Other state: 102
- Northeast: 9
- Midwest: 64
- South: 19
- West: 9
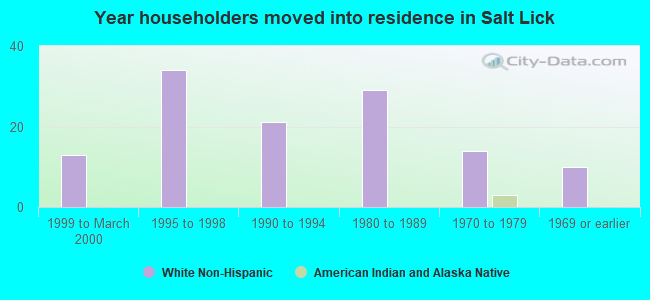
79.2% of Salt Lick residents lived in the same house 1 years ago.
Out of people who lived in different houses, 5.2% lived in this county.
Out of people who lived in different counties, 95.8% lived in Kentucky.
| Salt Lick: | 79.2% |
| State average: | 87.2% |
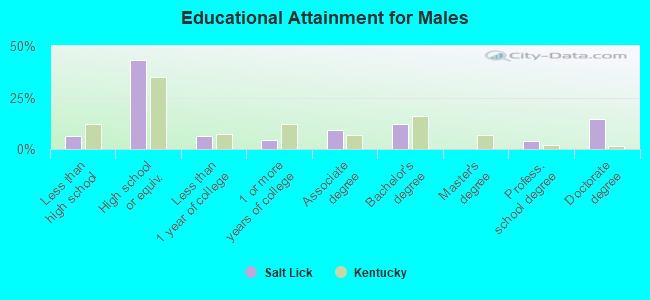
Education attainment for males 25 years and older:
- No schooling: 0
- Nursery to 4th grade: 0
- 5th and 6th grade: 0
- 7th and 8th grade: 5
- 9th grade: 2
- 10th grade: 0
- 11th grade: 0
- 12th grade, no diploma: 0
- High school graduate (or equivalency): 47
- Less than 1 year of college: 7
- Some college more than 1 year, no degree: 5
- Associate degree: 10
- Bachelor's degree: 13
- Master's degree: 0
- Professional school degree: 4
- Doctorate degree: 16
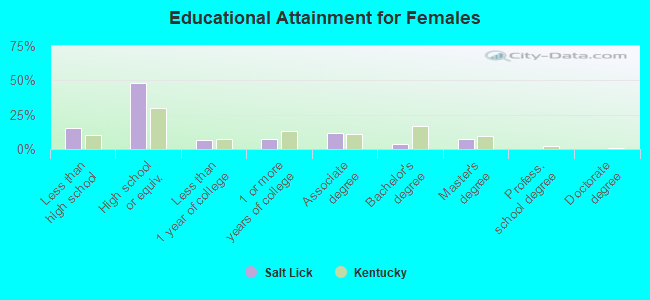
Education attainment for females 25 years and older:
- No schooling: 0
- Nursery to 4th grade: 0
- 5th and 6th grade: 0
- 7th and 8th grade: 8
- 9th grade: 0
- 10th grade: 7
- 11th grade: 0
- 12th grade, no diploma: 4
- High school graduate (or equivalency): 59
- Less than 1 year of college: 8
- Some college more than 1 year, no degree: 9
- Associate degree: 14
- Bachelor's degree: 4
- Master's degree: 9
- Professional school degree: 0
- Doctorate degree: 0


Housing units in structures:
- One, detached: 117
- 3 or 4: 4
- Mobile homes: 56
Housing units lacking complete kitchen facilities in 2022: 10.2%
House/condo owner moved in on average 8 years ago
Renter moved in on average 4 years ago
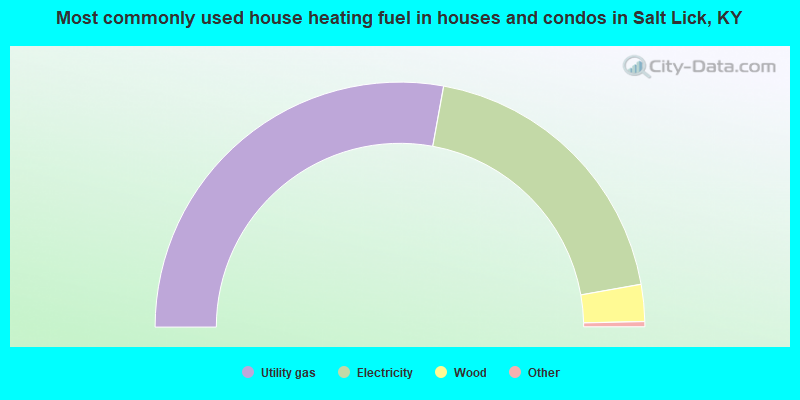
- 56.1%Utility gas
- 39.0%Electricity
- 4.9%Wood
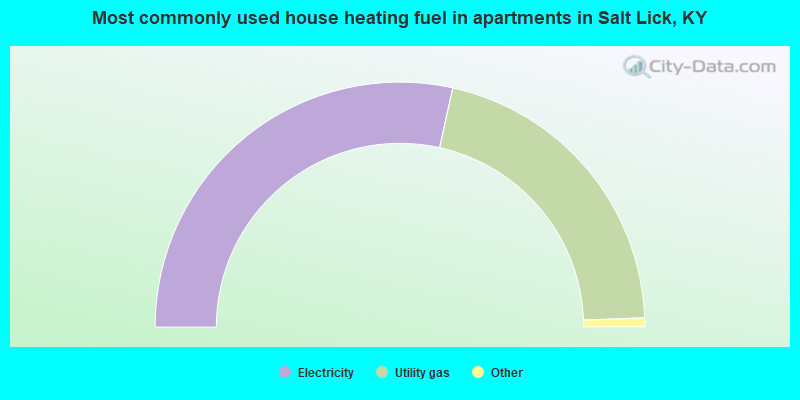
- 57.6%Electricity
- 42.4%Utility gas
Private vs. public school enrollment:
| Here: | 10.8% |
| Kentucky: | 17.2% |
| Here: | 0.0% |
| Kentucky: | 15.2% |
| Here: | 0.0% |
| Kentucky: | 19.6% |