San Carlos Park, FL (Florida) Houses and Residents
| San Carlos Park: | $331,087 |
| Florida: | $354,100 |
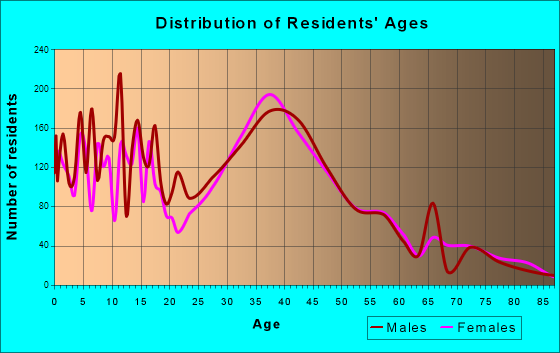
Total population: 16,824 (Urban population: 16,120, Rural population: 0)
Houses: 7,579 (6,623 occupied: 5,065 owner occupied, 1,789 renter occupied)
| % of renters here: | 26% |
| State: | 33% |
Housing density: 1,561 houses/condos per square mile
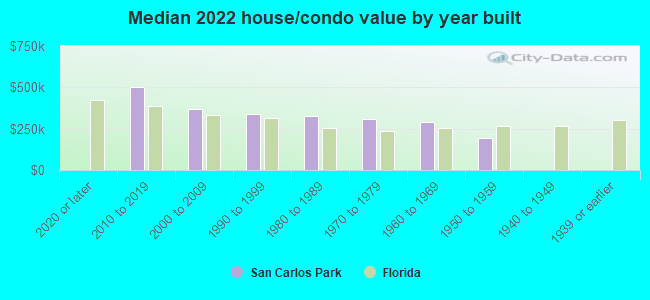
Median price asked for vacant for-sale houses and condos in 2022: $559,750.
Median contract rent in 2022: $1,535 (lower quartile is $1,207, upper quartile is over $2,000)
Median rent asked for vacant for-rent units in 2022: $1,469
Median gross rent in San Carlos Park, FL in 2022: $1,636
Housing units in San Carlos Park with a mortgage: 3,571 (202 second mortgage, 0 home equity loan, 153 both second mortgage and home equity loan)
Houses without a mortgage: 32
Median household income for houses/condos with a mortgage: $86,893
Median household income for apartments without a mortgage: $48,370
Median monthly housing costs: $1,447
Compare current foreclosures near San Carlos Park, FL:
| Photo | Address | Area | Beds / Baths | Price | Details |
|---|---|---|---|---|---|

|
#1
Morning Glory Ln
Fort Myers, FL 33913
|
2,512 sq. feet
|
2 baths 4 beds |
$545,000
|
show details |

|
#2
SW 40th Ter
Cape Coral, FL 33914
|
1,975 sq. feet
|
2 baths 3 beds |
$509,600
|
show details |

|
#3
Greendale Pl
Cape Coral, FL 33991
|
1,509 sq. feet
|
2 baths 3 beds |
$390,000
|
show details |

|
#4
Springwood Ct
Bonita Springs, FL 34135
|
1,688 sq. feet
|
2 baths 2 beds |
$479,750
|
show details |

|
#5
Brendan Preserve Ct
Bonita Springs, FL 34135
|
1,946 sq. feet
|
2 baths 4 beds |
$565,000
|
show details |

|
#6
Majestic Ave
Fort Myers, FL 33913
|
1,692 sq. feet
|
2 baths 2 beds |
$500,000
|
show details |

|
#7
Bloomfield St
Fort Myers, FL 33916
|
1,527 sq. feet
|
2 baths 2 beds |
show details | |

|
#8
Gardenside Ct
Lehigh Acres, FL 33936
|
1,176 sq. feet
|
2 baths 2 beds |
show details | |

|
#9
Dellwood Ave
Lehigh Acres, FL 33936
|
1,567 sq. feet
|
2 baths 2 beds |
show details | |

|
#10
52nd St W
Lehigh Acres, FL 33971
|
1,296 sq. feet
|
2 baths 3 beds |
show details |
| Photo | Address | Area | Beds / Baths | Price | Details |
|---|---|---|---|---|---|

|
#11
St
Cape Coral, FL 33904
|
1,302 sq. feet
|
2 baths 3 beds |
show details | |

|
#12
Ardore Ln
Estero, FL 33928
|
2,085 sq. feet
|
2 baths 3 beds |
show details | |

|
#13
Roosevelt Ave
Lehigh Acres, FL 33936
|
1,284 sq. feet
|
2 baths 2 beds |
show details | |

|
#14
3rd St W
Lehigh Acres, FL 33971
|
1,417 sq. feet
|
2 baths 2 beds |
show details | |

|
#15
Lakeland Cir
Fort Myers, FL 33913
|
2,875 sq. feet
|
3 baths 4 beds |
show details | |

|
#16
York Ter
Naples, FL 34109
|
2,070 sq. feet
|
2 baths 3 beds |
show details | |

|
#17
Ashcomb Way
Estero, FL 33928
|
2,491 sq. feet
|
3 baths 4 beds |
show details | |

|
#18
SE 15th Ter
Cape Coral, FL 33990
|
1,710 sq. feet
|
2 baths 3 beds |
show details | |

|
#19
SE 45th St
Cape Coral, FL 33904
|
1,724 sq. feet
|
2 baths 3 beds |
show details | |

|
#20
NE 19th Ave
Cape Coral, FL 33909
|
1,363 sq. feet
|
2 baths 3 beds |
show details |
| Photo | Address | Area | Beds / Baths | Price | Details |
|---|---|---|---|---|---|

|
#21
State Ave
Lehigh Acres, FL 33972
|
2,188 sq. feet
|
2 baths 4 beds |
show details | |

|
#22
SE 24th Ave
Cape Coral, FL 33990
|
2,532 sq. feet
|
4 baths 4 beds |
show details | |

|
#23
SE 20th Ct
Cape Coral, FL 33990
|
1,639 sq. feet
|
2 baths 3 beds |
show details | |

|
#24
Skyline Blvd
Cape Coral, FL 33914
|
2,334 sq. feet
|
4 baths 5 beds |
show details | |

|
#25
6th St SW
Lehigh Acres, FL 33976
|
1,408 sq. feet
|
2 baths 3 beds |
show details | |

|
#26
SE 21st Ave
Cape Coral, FL 33990
|
1,876 sq. feet
|
2 baths 3 beds |
show details | |

|
#27
SE 8th Pl
Cape Coral, FL 33990
|
1,212 sq. feet
|
2 baths 3 beds |
show details | |

|
#28
SW 7th Ave
Cape Coral, FL 33914
|
2,069 sq. feet
|
2 baths 4 beds |
show details | |

|
#29
Aviation Pkwy
Cape Coral, FL 33904
|
1,755 sq. feet
|
2 baths 3 beds |
show details | |

|
#30
SE 23rd Ter
Cape Coral, FL 33990
|
1,351 sq. feet
|
2 baths 3 beds |
show details |
| Photo | Address | Area | Beds / Baths | Price | Details |
|---|---|---|---|---|---|

|
#31
SE 29th Ter
Cape Coral, FL 33904
|
2,464 sq. feet
|
2 baths 3 beds |
show details | |

|
#32
Alabaster St
Lehigh Acres, FL 33974
|
1,804 sq. feet
|
2 baths 3 beds |
show details | |

|
#33
SE 20th Pl
Cape Coral, FL 33990
|
1,267 sq. feet
|
2 baths 3 beds |
show details | |

|
#34
13th St W
Lehigh Acres, FL 33971
|
1,993 sq. feet
|
2 baths 3 beds |
show details | |

|
#35
3rd St SW
Lehigh Acres, FL 33976
|
1,809 sq. feet
|
2 baths 4 beds |
show details | |

|
#36
SW 38th Ter
Cape Coral, FL 33914
|
2,297 sq. feet
|
2 baths 4 beds |
show details | |

|
#37
Tena Ave N
Lehigh Acres, FL 33971
|
1,671 sq. feet
|
2 baths 3 beds |
show details | |

|
#38
7th St SW
Lehigh Acres, FL 33976
|
2,001 sq. feet
|
2 baths 4 beds |
show details | |

|
#39
Sagewood Ave
Lehigh Acres, FL 33936
|
1,435 sq. feet
|
2 baths 3 beds |
show details | |

|
#40
4th St SW
Lehigh Acres, FL 33976
|
1,458 sq. feet
|
2 baths 3 beds |
show details |
| Photo | Address | Area | Beds / Baths | Price | Details |
|---|---|---|---|---|---|

|
#41
N Key Dr Apt 46
North Fort Myers, FL 33903
|
1,168 sq. feet
|
2 baths 2 beds |
show details | |

|
#42
Alcala Ave
Lehigh Acres, FL 33936
|
1,112 sq. feet
|
1 baths 2 beds |
show details | |

|
#43
25th St W
Lehigh Acres, FL 33971
|
1,144 sq. feet
|
2 baths 3 beds |
show details | |

|
#44
Inwood Ave S
Lehigh Acres, FL 33936
|
1,320 sq. feet
|
2 baths 3 beds |
show details | |

|
#45
Manatee Bay Ln
Fort Myers, FL 33905
|
1,431 sq. feet
|
2 baths 2 beds |
show details | |

|
#46
10th St W
Lehigh Acres, FL 33971
|
1,344 sq. feet
|
2 baths 3 beds |
show details | |

|
#47
SE 20th Ct
Cape Coral, FL 33990
|
1,722 sq. feet
|
2 baths 3 beds |
show details | |

|
#48
SE 25th Ter
Cape Coral, FL 33904
|
1,363 sq. feet
|
2 baths 3 beds |
show details | |

|
#49
SW 18th Ave
Cape Coral, FL 33914
|
2,092 sq. feet
|
2 baths 3 beds |
show details | |

|
Check over 1 million property listings on Foreclosure.com!
|
browse all offers | |||


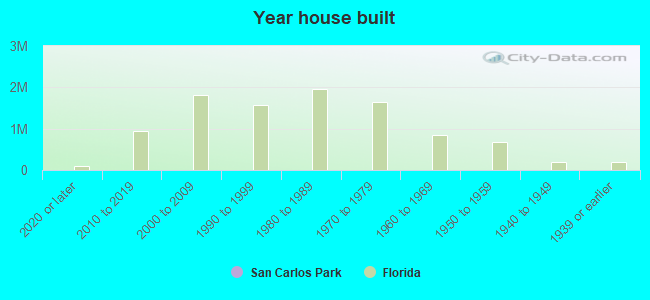
Median year apartment built: 1991
Household type by relationship:
Households: 20,098- Male householders: 2,973 (434 living alone), Female householders: 3,721 (721 living alone)
3,241 spouses (3,219 opposite-sex spouses), 749 unmarried partners, (709 opposite-sex unmarried partners), 5,936 children (5,763 natural, 148 adopted, 24 stepchildren), 124 grandchildren, 506 brothers or sisters, 994 parents, 18 foster children, 354 other relatives, 1,464 non-relatives
- In group quarters: 14
Size of family households: 2,037 2-persons, 1,257 3-persons, 1,125 4-persons, 317 5-persons, 89 6-persons, 9 7-or-more-persons.
Size of nonfamily households: 1,123 1-person, 606 2-persons, 245 3-persons, 99 4-persons.
2,629 married couples with children.
1,185 single-parent households (743 men, 442 women).
72.5% of residents of San Carlos Park speak English at home.
23.1% of residents speak Spanish at home (60% speak English very well, 21% speak English well, 11% speak English not well, 8% don't speak English at all).
1.8% of residents speak other Indo-European language at home (44% speak English very well, 50% speak English well, 6% speak English not well).
1.1% of residents speak Asian or Pacific Island language at home (74% speak English very well, 26% speak English not well).
0.7% of residents speak other language at home (100% speak English very well).
Foreign born population: 3,781 (18.8%)
(40.8% of them are naturalized citizens)
| Here: | 5.3 |
| State: | 5.9 |
| Here: | 4.6 |
| State: | 4.2 |
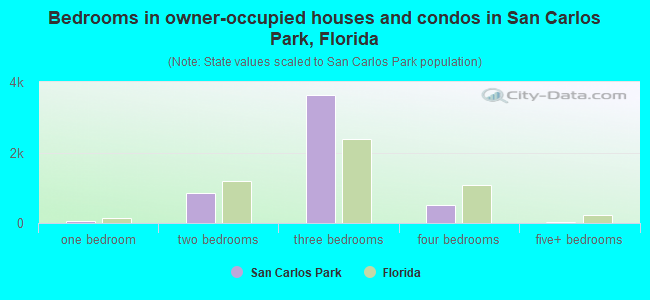
- Bedrooms in owner-occupied houses and condos in San Carlos Park, Florida
- 10no bedroom
- 511 bedroom
- 8422 bedrooms
- 3,6383 bedrooms
- 5074 bedrooms
- 175+ bedrooms
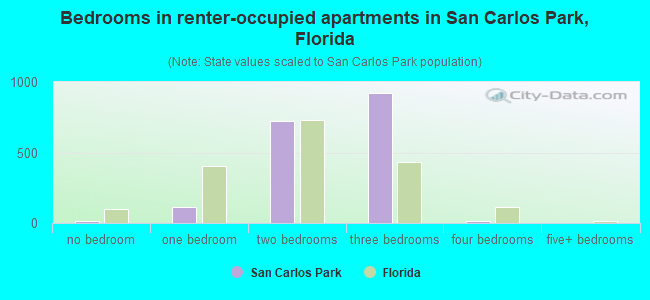
- Bedrooms in renter-occupied apartments in San Carlos Park, Florida
- 11no bedroom
- 1161 bedroom
- 7252 bedrooms
- 9223 bedrooms
- 164 bedrooms
- 05+ bedrooms
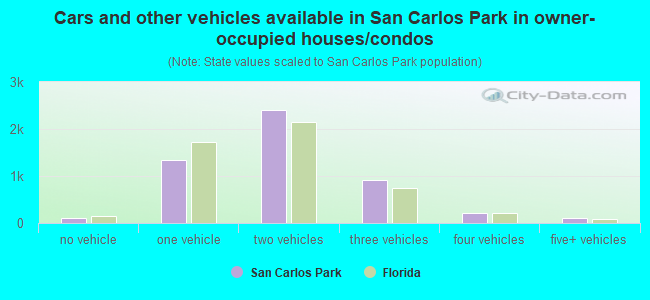
- Cars and other vehicles available in San Carlos Park in owner-occupied houses/condos
- 96no vehicle
- 1,3481 vehicle
- 2,4102 vehicles
- 9093 vehicles
- 2054 vehicles
- 985+ vehicles
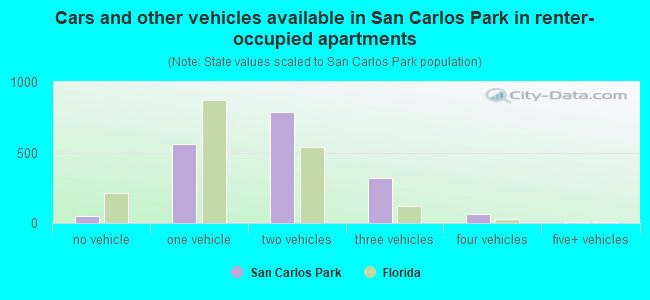
- Cars and other vehicles available in San Carlos Park in renter-occupied apartments
- 50no vehicle
- 5611 vehicle
- 7872 vehicles
- 3213 vehicles
- 614 vehicles
- 95+ vehicles
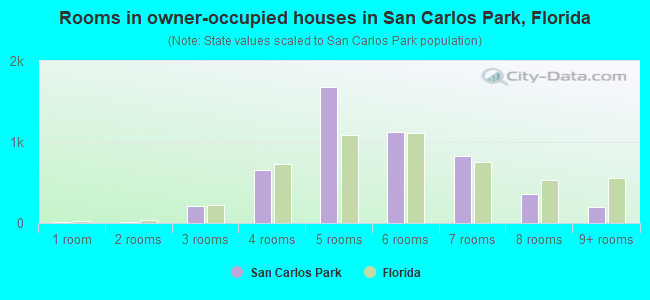
- Rooms in owner-occupied houses in San Carlos Park, Florida
- 101 room
- 162 rooms
- 2073 rooms
- 6534 rooms
- 1,6735 rooms
- 1,1276 rooms
- 8277 rooms
- 3628 rooms
- 1929+ rooms
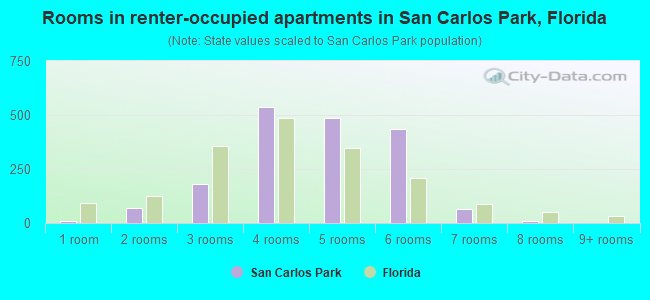
- Rooms in renter-occupied apartments in San Carlos Park, Florida
- 111 room
- 712 rooms
- 1793 rooms
- 5354 rooms
- 4875 rooms
- 4346 rooms
- 647 rooms
- 98 rooms
- 09+ rooms
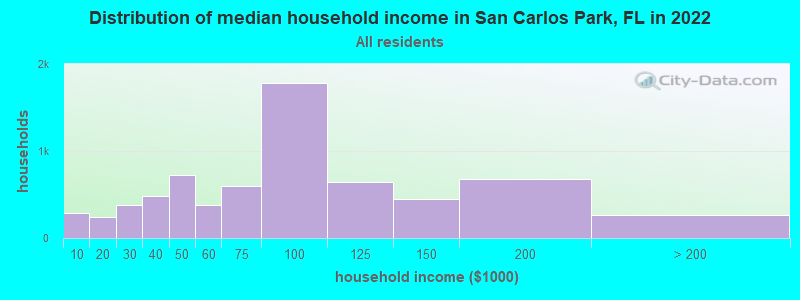
San Carlos Park, FL household income distribution

- 284Less than $10,000
- 242$10,000 to $19,999
- 384$20,000 to $29,999
- 481$30,000 to $39,999
- 722$40,000 to $49,999
- 385$50,000 to $59,999
- 598$60,000 to $74,999
- 1,778$75,000 to $99,999
- 648$100,000 to $124,999
- 454$125,000 to $149,999
- 683$150,000 to $199,999
- 266$200,000 or more
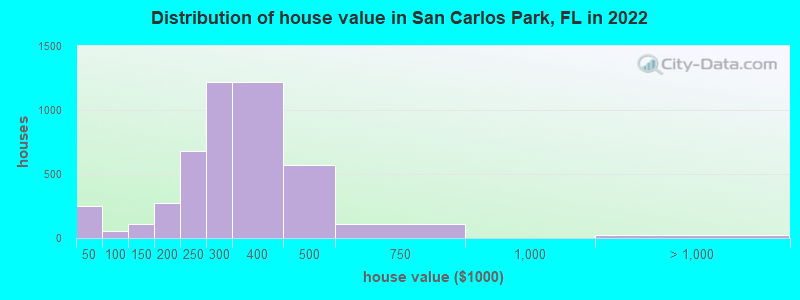
Home value of owner - occupied houses in 2022 in San Carlos Park, FL
-
- 210Less than $10,000
- 11$15,000 to $19,999
- 12$20,000 to $24,999
- 13$40,000 to $49,999
- 3$50,000 to $59,999
- 7$60,000 to $69,999
- 5$70,000 to $79,999
- 3$80,000 to $89,999
- 20$90,000 to $99,999
- 55$100,000 to $124,999
- 56$125,000 to $149,999
- 213$150,000 to $174,999
- 61$175,000 to $199,999
- 676$200,000 to $249,999
- 1,217$250,000 to $299,999
- 1,216$300,000 to $399,999
- 567$400,000 to $499,999
- 108$500,000 to $749,999
- 24$2,000,000 or more
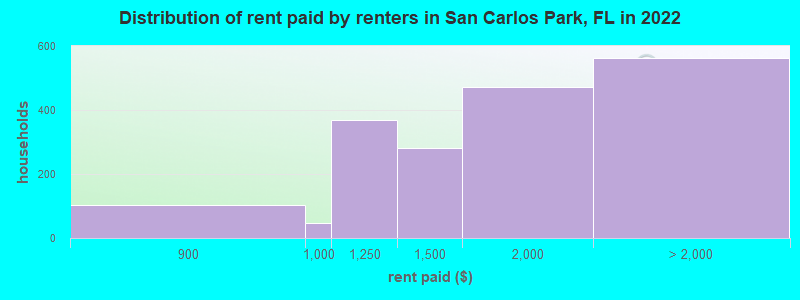
Rent paid by renters in 2022 in San Carlos Park, FL
-
- 4$550 to $599
- 2$700 to $749
- 101$800 to $899
- 45$900 to $999
- 368$1,000 to $1,249
- 280$1,250 to $1,499
- 473$1,500 to $1,999
- 540$2,000 to $2,499
- 22$2,500 to $2,999
Percentage of workers working in this county: 79.3%
Number of people working at home: 1,448 (13.1% of all workers)
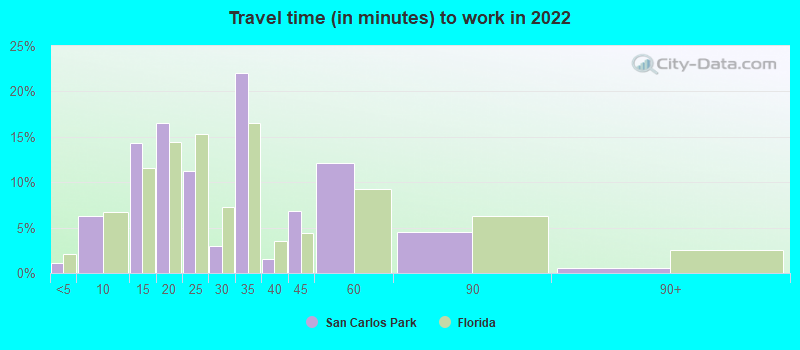
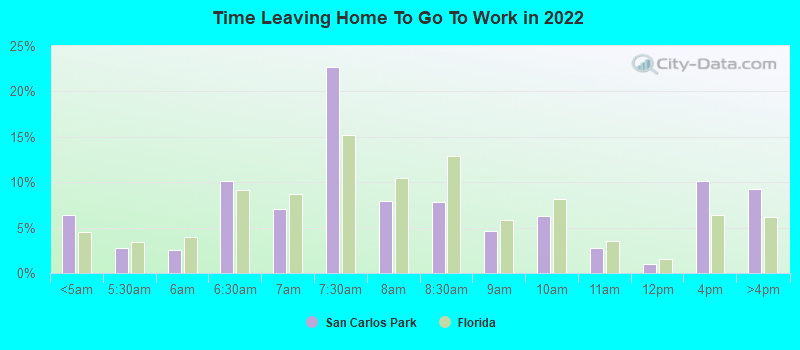
Travel time to work (commute)
- Less than 5 minutes: 54
- 5 to 9 minutes: 516
- 10 to 14 minutes: 1,279
- 15 to 19 minutes: 1,444
- 20 to 24 minutes: 1,612
- 25 to 29 minutes: 518
- 30 to 34 minutes: 1,746
- 35 to 39 minutes: 468
- 40 to 44 minutes: 258
- 45 to 59 minutes: 1,054
- 60 to 89 minutes: 196
- 90 or more minutes: 277
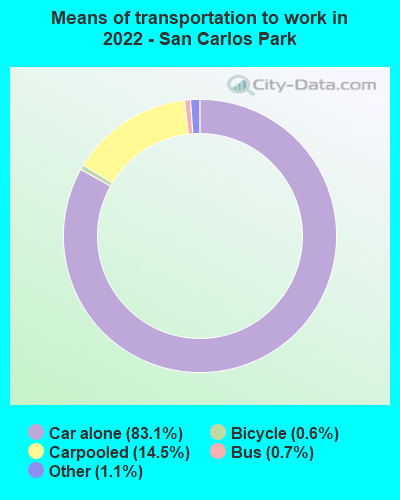
Means of transportation to work:
- Drove a car alone: 2,669 (59.1%)
- Carpooled: 569 (12.6%)
- Bus: 30 (0.7%)
- Taxi: 23 (0.5%)
- Bicycle: 11 (0.2%)
- Worked at home: 1,448 (32.1%)
- Unemployment by race in 2022
- Unemployment rate for White non-Hispanic residents
- 1.5%Males
- 3.5%Females
- Unemployment rate for two or more race residents
- 1.3%Males
- Unemployment rate for Hispanic or Latino residents
- 1.0%Males
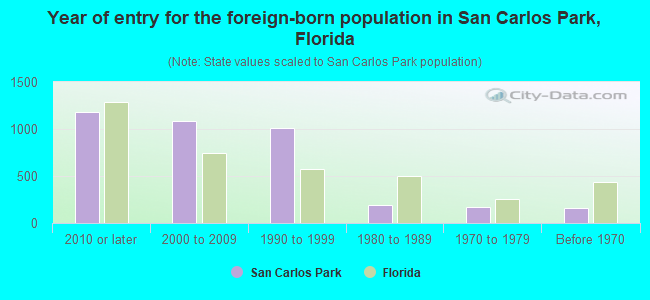
- Year of entry for the foreign-born population in San Carlos Park, Florida
- 1,1862010 or later
- 1,0832000 to 2009
- 1,0121990 to 1999
- 1901980 to 1989
- 1741970 to 1979
- 159Before 1970
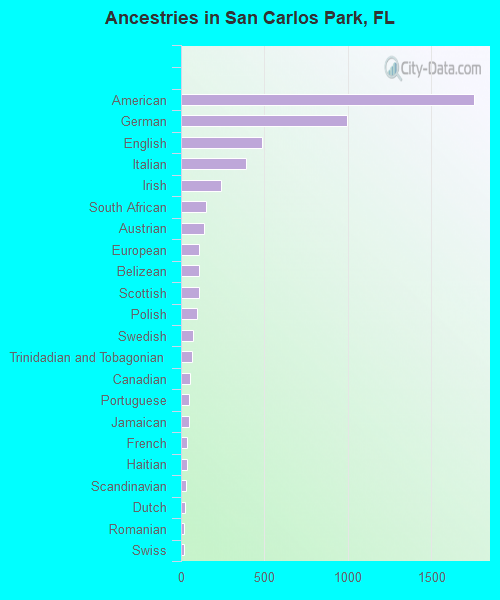
First ancestries reported:
- American: 1,757 (17.7%)
- German: 993 (10.0%)
- English: 484 (4.9%)
- Italian: 392 (3.9%)
- Irish: 237 (2.4%)
- South African: 148 (1.5%)
- Austrian: 136 (1.4%)
- European: 110 (1.1%)
- Belizean: 110 (1.1%)
- Scottish: 107 (1.1%)
- Polish: 98 (1.0%)
- Swedish: 71 (0.7%)
- Trinidadian and Tobagonian: 65 (0.7%)
- Canadian: 53 (0.5%)
- Portuguese: 47 (0.5%)
- Jamaican: 47 (0.5%)
- French: 37 (0.4%)
- Haitian: 35 (0.4%)
- Scandinavian: 30 (0.3%)
- Dutch: 23 (0.2%)
- Romanian: 17 (0.2%)
- Swiss: 16 (0.2%)
- Lithuanian: 14 (0.1%)
- Israeli: 12 (0.1%)
- Ukrainian: 12 (0.1%)
- Czech: 10 (0.1%)
- Finnish: 9 (0.09%)
- Greek: 9 (0.09%)
- Scotch-Irish: 9 (0.09%)
- African: 9 (0.09%)
- Norwegian: 8 (0.08%)
- British: 7 (0.07%)
Most common places of birth for foreign-born residents (%):
| San Carlos Park: | 30.4% (1,049) |
| Florida: | 5.6% (257,152) |
| San Carlos Park: | 10.2% (351) |
| Florida: | 6.5% (298,669) |
| San Carlos Park: | 6.1% (211) |
| Florida: | 22.0% (1,006,576) |
| San Carlos Park: | 5.6% (192) |
| Florida: | 2.1% (97,632) |
| San Carlos Park: | 4.5% (155) |
| Florida: | 1.0% (43,642) |
| San Carlos Park: | 4.4% (151) |
| Florida: | 1.3% (60,604) |
| San Carlos Park: | 3.6% (124) |
| Florida: | 5.7% (262,042) |
| San Carlos Park: | 3.6% (123) |
| Florida: | 0.4% (16,570) |
| San Carlos Park: | 3.4% (116) |
| Florida: | 0.2% (11,243) |
| San Carlos Park: | 2.9% (100) |
| Florida: | 1.2% (54,272) |
| San Carlos Park: | 2.8% (95) |
| Florida: | 0.7% (30,755) |
| San Carlos Park: | 2.5% (87) |
| Florida: | 2.1% (96,693) |
| San Carlos Park: | 2.5% (86) |
| Florida: | 0.2% (10,861) |
| San Carlos Park: | 2.5% (85) |
| Florida: | 3.0% (137,727) |
| San Carlos Park: | 2.5% (85) |
| Florida: | 1.3% (57,263) |
| San Carlos Park: | 2.1% (73) |
| Florida: | 2.4% (109,132) |
Place of birth for U.S.-born residents:
- This state: 7,175
- Other state: 8,348
- Northeast: 3,225
- Midwest: 3,039
- South: 1,377
- West: 712
89.0% of San Carlos Park residents lived in the same house 1 years ago.
Out of people who lived in different houses, 32.1% lived in this county.
Out of people who lived in different counties, 69.1% lived in Florida.
| San Carlos Park: | 89.0% |
| State average: | 86.3% |
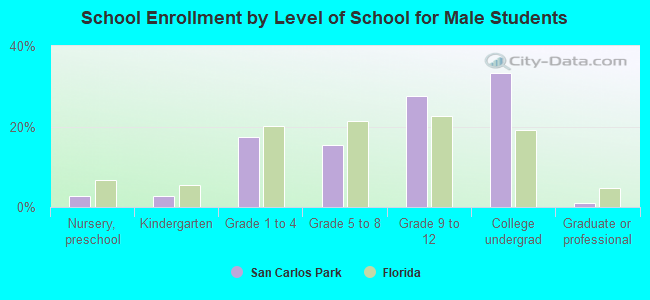
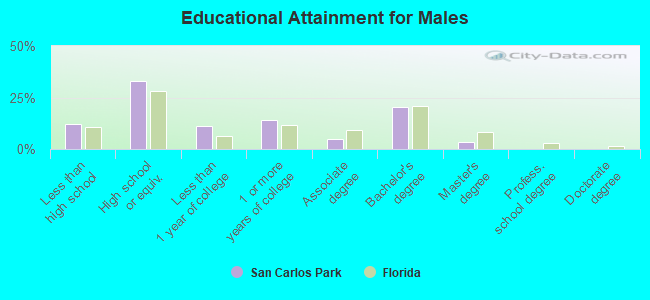
Education attainment for males 25 years and older:
- No schooling: 225
- Nursery to 4th grade: 0
- 5th and 6th grade: 29
- 7th and 8th grade: 67
- 9th grade: 10
- 10th grade: 111
- 11th grade: 254
- 12th grade, no diploma: 88
- High school graduate (or equivalency): 2,106
- Less than 1 year of college: 728
- Some college more than 1 year, no degree: 905
- Associate degree: 313
- Bachelor's degree: 1,322
- Master's degree: 231
- Professional school degree: 11
- Doctorate degree: 14
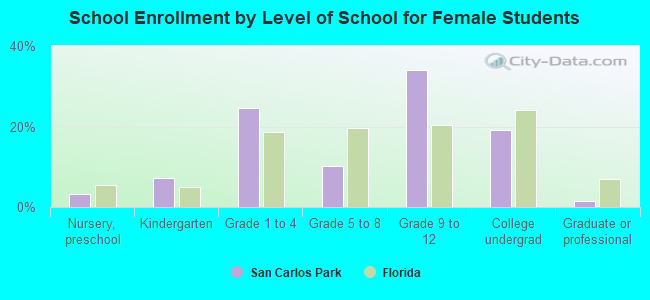
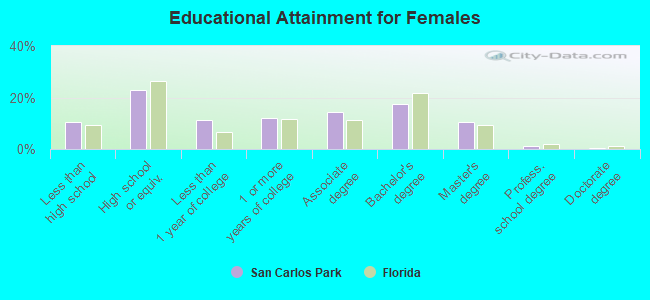
Education attainment for females 25 years and older:
- No schooling: 270
- Nursery to 4th grade: 13
- 5th and 6th grade: 87
- 7th and 8th grade: 73
- 9th grade: 25
- 10th grade: 6
- 11th grade: 78
- 12th grade, no diploma: 157
- High school graduate (or equivalency): 1,541
- Less than 1 year of college: 750
- Some college more than 1 year, no degree: 801
- Associate degree: 964
- Bachelor's degree: 1,175
- Master's degree: 695
- Professional school degree: 75
- Doctorate degree: 29
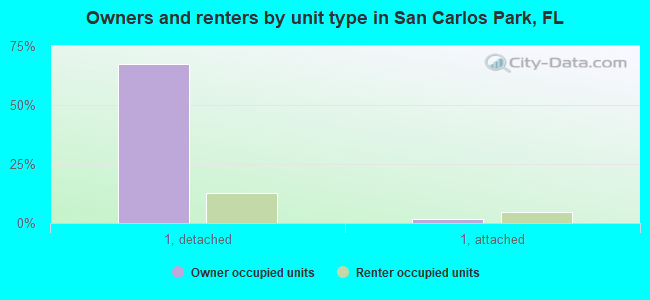
Housing units in structures:
- One, detached: 6,014
- One, attached: 402
- Two: 521
- 3 or 4: 92
- 5 to 9: 71
- 10 to 19: 71
- 20 to 49: 86
- 50 or more: 20
- Mobile homes: 300
Median worth of mobile homes: $12,896
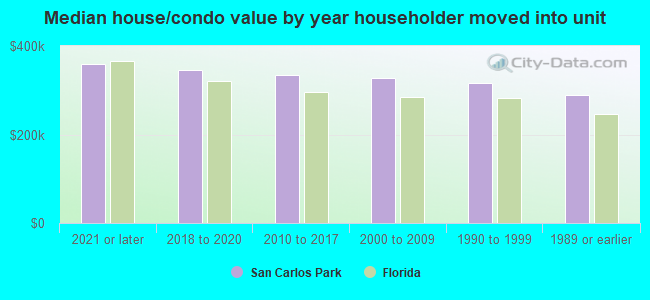
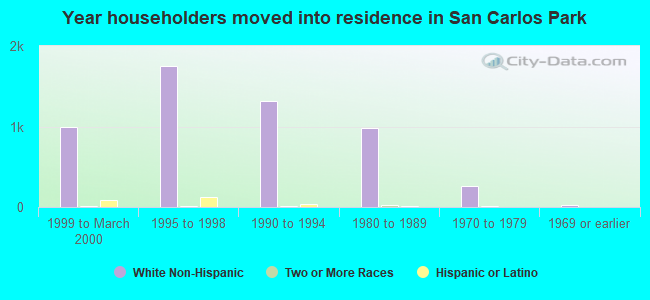
House/condo owner moved in on average 11 years ago
Renter moved in on average 3 years ago
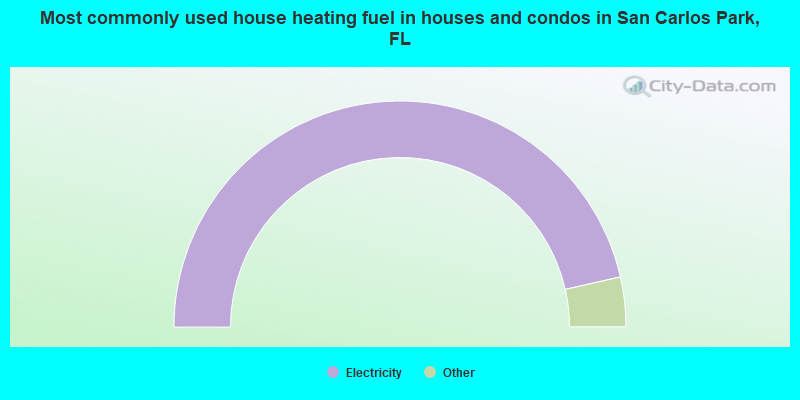
- 92.9%Electricity
- 3.1%Bottled, tank, or LP gas
- 1.7%No fuel used
- 1.3%Solar energy
- 1.0%Utility gas
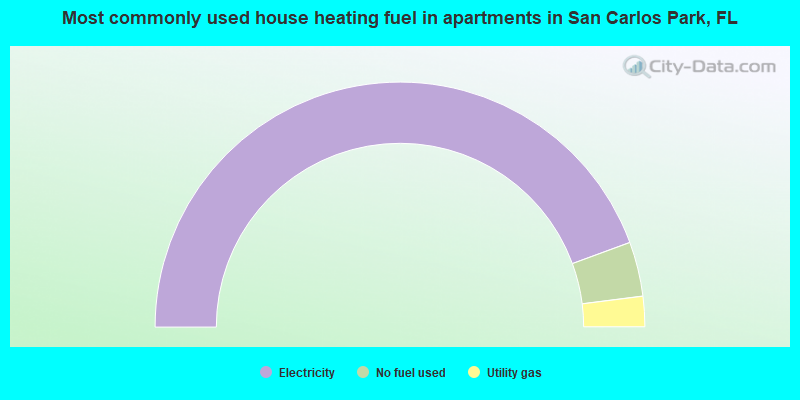
- 88.8%Electricity
- 7.2%No fuel used
- 4.0%Utility gas
Private vs. public school enrollment:
| Here: | 7.9% |
| Florida: | 15.8% |
| Here: | 5.6% |
| Florida: | 12.9% |
| Here: | 20.8% |
| Florida: | 23.6% |