San Geronimo, CA (California) Houses and Residents
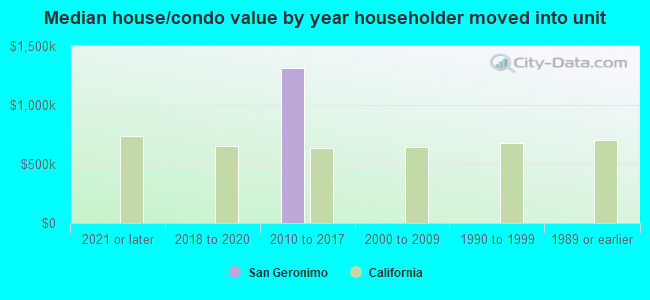
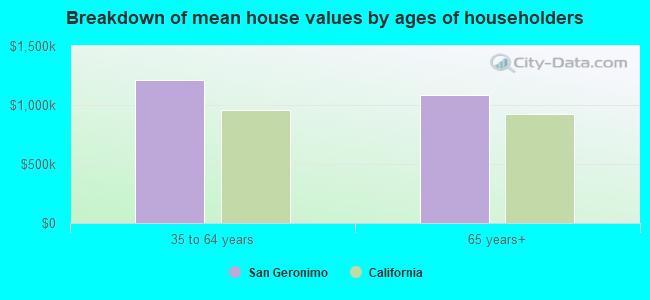
| San Geronimo: | $1,317,670 |
| California: | $715,900 |
Mean price in 2022:
Detached houses: $1,701,370
Here: $1,701,370 State: $988,808
Total population: 446 (Urban population: 0, Rural population: 386 (all nonfarm))
Houses: 141 (141 occupied: 124 owner occupied, 15 renter occupied)
| % of renters here: | 11% |
| State: | 44% |
Housing density: 93 houses/condos per square mile
Median price asked for vacant for-sale houses and condos in 2022 in this county: $3,364,178.
Median gross rent in San Geronimo, CA in 2022: $-636,643,880
Housing units in San Geronimo with a mortgage: 52 (0 second mortgage, 0 home equity loan, 0 both second mortgage and home equity loan)
Houses without a mortgage: 0
Median household income for houses/condos with a mortgage: $263,303
Median household income for apartments without a mortgage: $227,025
Median monthly housing costs: $1,223
Compare current foreclosures near San Geronimo, CA:
| Photo | Address | Area | Beds / Baths | Price | Details |
|---|---|---|---|---|---|

|
#1
Sir Francis Drake Blvd
San Geronimo, CA 94963
|
- sq. feet
|
- baths - beds |
show details | |

|
#2
2nd St
Richmond, CA 94801
|
887 sq. feet
|
1 baths 3 beds |
$364,000
|
show details |

|
#3
Petaluma Blvd S Apt 28
Petaluma, CA 94952
|
565 sq. feet
|
1 baths 1 beds |
$369,900
|
show details |

|
#4
Thorndale Dr Apt 435
San Rafael, CA 94903
|
1,096 sq. feet
|
2 baths 2 beds |
$149,900
|
show details |

|
#5
Thorndale Dr Apt 206
San Rafael, CA 94903
|
660 sq. feet
|
1 baths 1 beds |
$59,900
|
show details |

|
#6
Kelsey St
Richmond, CA 94801
|
1,080 sq. feet
|
3 baths 4 beds |
show details | |

|
#7
Ivy Lane
Woodacre, CA 94973
|
2,251 sq. feet
|
2 baths 3 beds |
show details | |

|
#8
Olima St
Sausalito, CA 94965
|
- sq. feet
|
2 baths 4 beds |
show details | |

|
#9
Orange Blossom Ln
San Rafael, CA 94903
|
1,892 sq. feet
|
2 baths 3 beds |
show details | |

|
#10
Harris Hill Dr
Novato, CA 94947
|
2,773 sq. feet
|
3 baths 4 beds |
show details |
| Photo | Address | Area | Beds / Baths | Price | Details |
|---|---|---|---|---|---|

|
#11
California Ave
Mill Valley, CA 94941
|
2,678 sq. feet
|
3 baths 3 beds |
show details | |

|
#12
3rd St
San Rafael, CA 94901
|
1,304 sq. feet
|
1 baths 2 beds |
show details | |

|
#13
Sequoia Valley Rd
Mill Valley, CA 94941
|
2,177 sq. feet
|
2 baths 3 beds |
show details | |

|
#14
Sunny Cove Dr
Novato, CA 94949
|
2,568 sq. feet
|
2 baths 4 beds |
show details | |

|
#15
Drakes Beach Rd
Inverness, CA 94937
|
1,652 sq. feet
|
2 baths 2 beds |
show details | |

|
#16
Warner Ct
San Rafael, CA 94901
|
1,664 sq. feet
|
2 baths 4 beds |
show details | |

|
#17
Montecito Rd
San Rafael, CA 94901
|
2,456 sq. feet
|
2 baths 4 beds |
show details | |

|
#18
Pizarro Ave
Novato, CA 94949
|
1,922 sq. feet
|
2 baths 3 beds |
show details | |

|
#19
San Luis Way
Novato, CA 94945
|
1,792 sq. feet
|
2 baths 3 beds |
show details | |

|
#20
Marblehead Ln
Novato, CA 94949
|
3,022 sq. feet
|
3 baths 5 beds |
show details |
| Photo | Address | Area | Beds / Baths | Price | Details |
|---|---|---|---|---|---|

|
#21
Corte De Sabla
Greenbrae, CA 94904
|
2,098 sq. feet
|
3 baths 3 beds |
show details | |

|
#22
Heather Way
Larkspur, CA 94939
|
990 sq. feet
|
1 baths 2 beds |
show details | |

|
#23
Wintergreen Ct
Novato, CA 94945
|
1,612 sq. feet
|
2 baths 3 beds |
show details | |

|
#24
Manzanita Ave
Novato, CA 94945
|
2,000 sq. feet
|
1 baths 1 beds |
show details | |

|
#25
Marina Way
San Rafael, CA 94901
|
3,872 sq. feet
|
3 baths 4 beds |
show details | |

|
#26
Balboa Ave
San Rafael, CA 94901
|
1,815 sq. feet
|
2 baths 3 beds |
show details | |

|
#27
Gloucester Cv
San Rafael, CA 94901
|
1,921 sq. feet
|
2 baths 3 beds |
show details | |

|
#28
Reid Ln
Richmond, CA 94801
|
2,055 sq. feet
|
2 baths 4 beds |
show details | |

|
#29
Birch Way
San Rafael, CA 94903
|
1,248 sq. feet
|
1 baths 3 beds |
show details | |

|
#30
California Ave
Mill Valley, CA 94941
|
2,678 sq. feet
|
3 baths 3 beds |
show details |
| Photo | Address | Area | Beds / Baths | Price | Details |
|---|---|---|---|---|---|

|
#31
Lavender Ter
Petaluma, CA 94952
|
2,618 sq. feet
|
3 baths 5 beds |
show details | |

|
#32
Glen Eagle Dr
Petaluma, CA 94952
|
6,762 sq. feet
|
3 baths 3 beds |
show details | |

|
#33
Belvedere Ave
Belvedere Tiburon, CA 94920
|
3,527 sq. feet
|
3 baths 3 beds |
show details | |

|
#34
Morgan Ave
Richmond, CA 94801
|
2,636 sq. feet
|
- baths - beds |
show details | |

|
#35
Del Oro Cir
Petaluma, CA 94954
|
1,388 sq. feet
|
2 baths 3 beds |
show details | |

|
#36
Reid Ln
Richmond, CA 94801
|
2,055 sq. feet
|
2 baths 4 beds |
show details | |

|
#37
Captain Nurse Cir
Novato, CA 94949
|
1,624 sq. feet
|
2 baths 4 beds |
show details | |

|
#38
Sunny Cove Dr
Novato, CA 94949
|
2,568 sq. feet
|
2 baths 4 beds |
show details | |

|
#39
Madrid Ct
Novato, CA 94949
|
1,588 sq. feet
|
2 baths 3 beds |
show details | |

|
#40
Patricia Way
San Rafael, CA 94903
|
2,709 sq. feet
|
2 baths 5 beds |
show details |
| Photo | Address | Area | Beds / Baths | Price | Details |
|---|---|---|---|---|---|

|
#41
Center Rd
Novato, CA 94947
|
1,318 sq. feet
|
2 baths 4 beds |
show details | |

|
#42
Wilson Ave
Novato, CA 94947
|
4,170 sq. feet
|
3 baths 5 beds |
show details | |

|
#43
El Prado Ave
San Rafael, CA 94903
|
1,397 sq. feet
|
2 baths 4 beds |
show details | |

|
#44
Madrid Ct
Novato, CA 94949
|
1,588 sq. feet
|
2 baths 3 beds |
show details | |

|
#45
Savanna Ct
Novato, CA 94947
|
3,700 sq. feet
|
3 baths 4 beds |
show details | |

|
#46
Rowland Blvd
Novato, CA 94947
|
3,732 sq. feet
|
3 baths 4 beds |
show details | |

|
#47
Birchwood Ct
San Rafael, CA 94903
|
1,894 sq. feet
|
3 baths 5 beds |
show details | |

|
#48
Manchester Ct
Novato, CA 94947
|
1,344 sq. feet
|
1 baths 3 beds |
show details | |

|
#49
Sir Francis Drake Blvd
San Anselmo, CA 94960
|
1,936 sq. feet
|
3 baths 3 beds |
show details | |

|
Check over 1 million property listings on Foreclosure.com!
|
browse all offers | |||


 | Best NorCal areas for family, criteria inside (125 replies) |
| Family move to San Fran (32 replies) |
| My family is relocating to SF area and I want to know which suburb is best for schools with quiet small town feel? (16 replies) |
| Is Marin worth it? (42 replies) |
| San Rafael Area (5 replies) |
| Is $50,000 enough to live comfortably in Novato area? (9 replies) |
Household type by relationship:
Households: 419- Male householders: 57 (24 living alone), Female householders: 81 (15 living alone)
98 spouses (98 opposite-sex spouses), 0 unmarried partners, (0 opposite-sex unmarried partners), 181 children (181 natural, 0 adopted, 0 stepchildren), 0 grandchildren, 0 brothers or sisters, 0 parents, 0 foster children, 0 other relatives, 0 non-relatives
Size of family households: 28 2-persons, 68 4-persons.
Size of nonfamily households: 43 1-person.
86 married couples with children.
0 single-parent households (0 men, 0 women).
67.2% of residents of San Geronimo speak English at home.
34.2% of residents speak other Indo-European language at home (100% speak English very well).
Foreign born population: 73 (17.4%)
(108.2% of them are naturalized citizens)
| Here: | 6.3 |
| State: | 6.0 |
| Here: | -631578946.7 |
| State: | 3.9 |
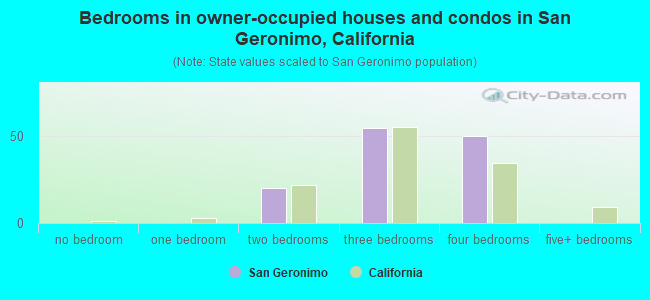
- Bedrooms in owner-occupied houses and condos in San Geronimo, California
- 0no bedroom
- 01 bedroom
- 202 bedrooms
- 553 bedrooms
- 504 bedrooms
- 05+ bedrooms
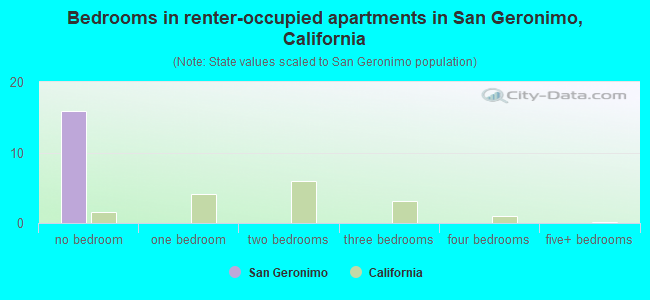
- Bedrooms in renter-occupied apartments in San Geronimo, California
- 16no bedroom
- 01 bedroom
- 02 bedrooms
- 03 bedrooms
- 04 bedrooms
- 05+ bedrooms
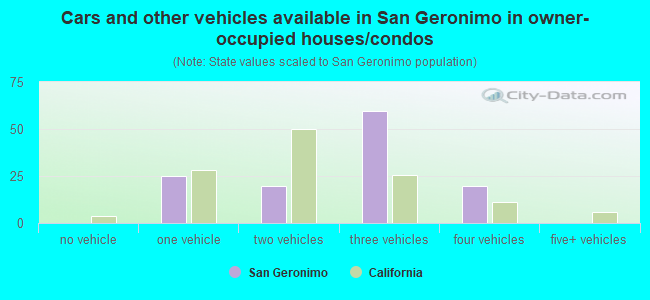
- Cars and other vehicles available in San Geronimo in owner-occupied houses/condos
- 0no vehicle
- 251 vehicle
- 202 vehicles
- 603 vehicles
- 204 vehicles
- 05+ vehicles
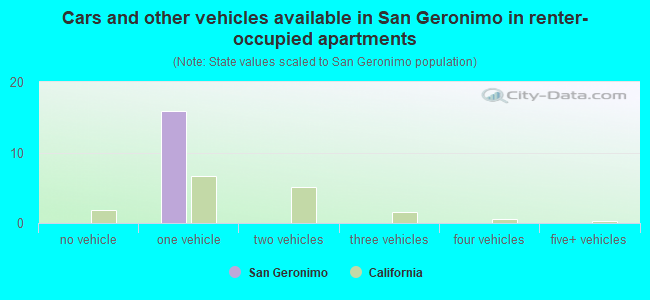
- Cars and other vehicles available in San Geronimo in renter-occupied apartments
- 0no vehicle
- 161 vehicle
- 02 vehicles
- 03 vehicles
- 04 vehicles
- 05+ vehicles
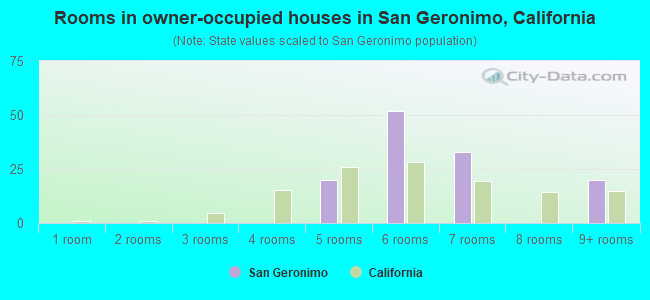
- Rooms in owner-occupied houses in San Geronimo, California
- 01 room
- 02 rooms
- 03 rooms
- 04 rooms
- 205 rooms
- 526 rooms
- 337 rooms
- 08 rooms
- 209+ rooms
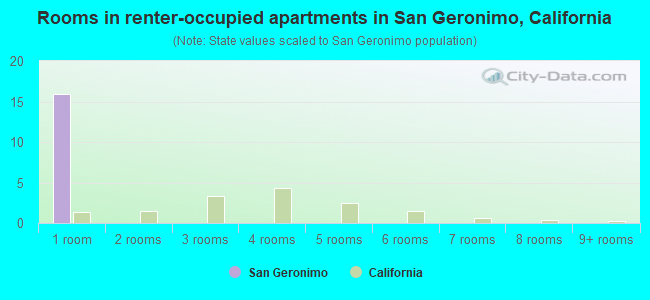
- Rooms in renter-occupied apartments in San Geronimo, California
- 161 room
- 02 rooms
- 03 rooms
- 04 rooms
- 05 rooms
- 06 rooms
- 07 rooms
- 08 rooms
- 09+ rooms
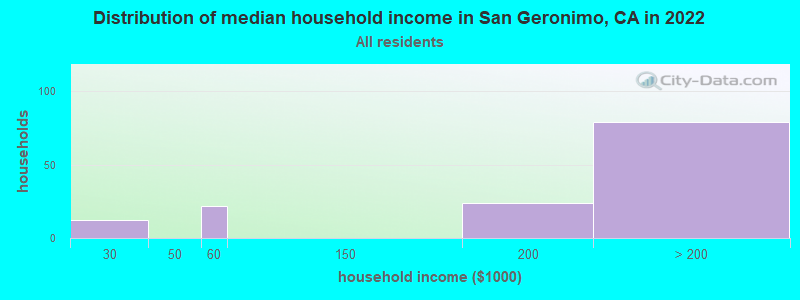
San Geronimo, CA household income distribution

- 12$20,000 to $29,999
- 22$50,000 to $59,999
- 24$150,000 to $199,999
- 79$200,000 or more
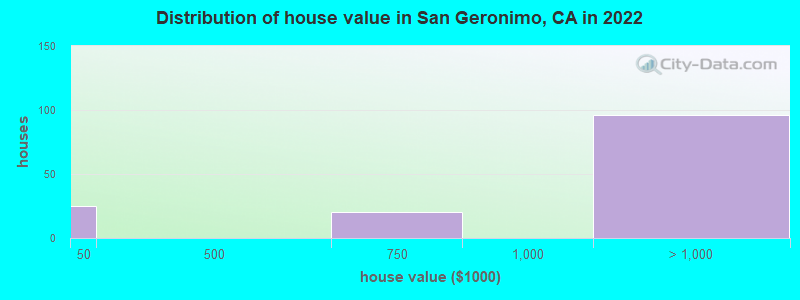
Home value of owner - occupied houses in 2022 in San Geronimo, CA
-
- 25Less than $10,000
- 20$500,000 to $749,999
- 67$1,000,000 to $1,499,999
- 28$1,500,000 to $1,999,999
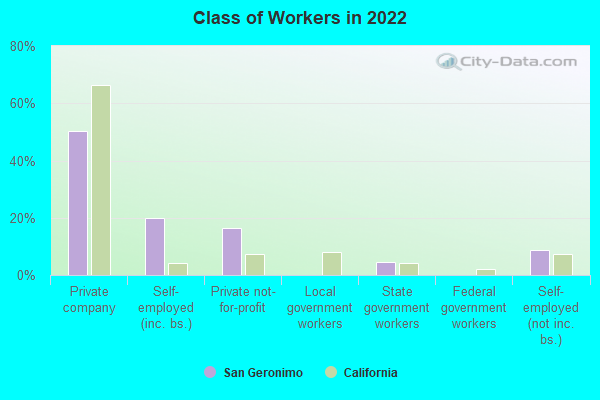
Percentage of workers working in this county: 106.8%
Number of people working at home: 61 (27.9% of all workers)
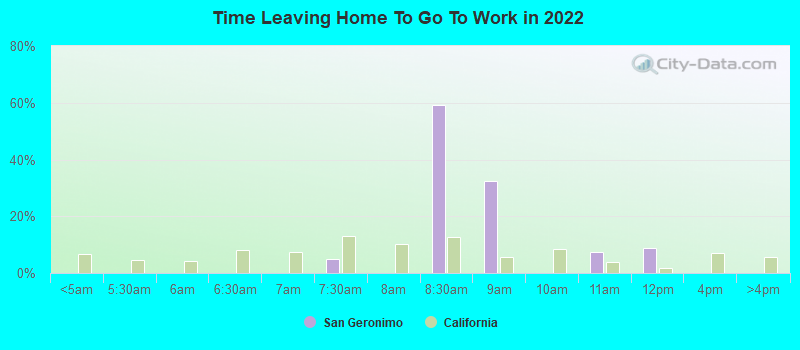
Travel time to work (commute)
- Less than 5 minutes: 0
- 5 to 9 minutes: 0
- 10 to 14 minutes: 89
- 15 to 19 minutes: 0
- 20 to 24 minutes: 7
- 25 to 29 minutes: 47
- 30 to 34 minutes: 0
- 35 to 39 minutes: 15
- 40 to 44 minutes: 0
- 45 to 59 minutes: 0
- 60 to 89 minutes: 0
- 90 or more minutes: 0
Means of transportation to work:
- Drove a car alone: 179 (73.1%)
- Carpooled: 26 (10.6%)
- Bus or trolley bus: 6 (2.4%)
- Bicycle: 22 (9.0%)
- Worked at home: 12 (4.9%)
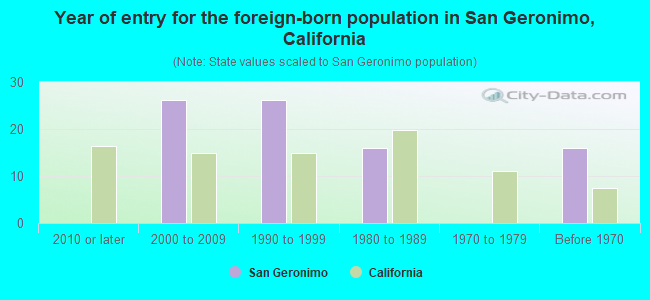
- Year of entry for the foreign-born population in San Geronimo, California
- 02010 or later
- 262000 to 2009
- 261990 to 1999
- 161980 to 1989
- 01970 to 1979
- 16Before 1970
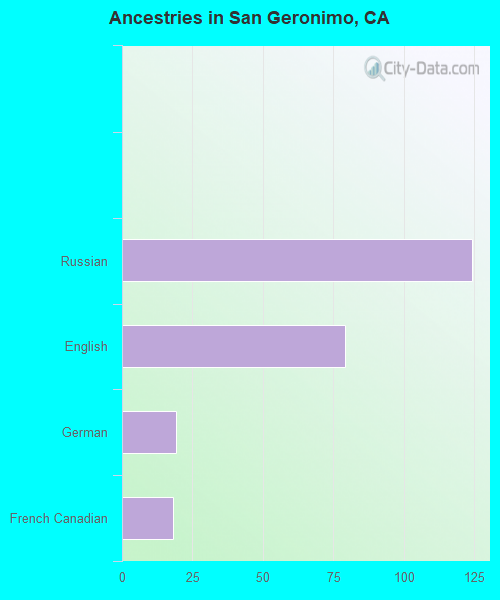
First ancestries reported:
- Russian: 124 (51.2%)
- English: 79 (32.6%)
- German: 19 (7.8%)
- French Canadian: 18 (7.4%)
Most common places of birth for foreign-born residents (%):
| San Geronimo: | 75.3% (55) |
| California: | 0.7% (71,932) |
| San Geronimo: | 24.7% (18) |
| California: | 0.7% (73,304) |
Place of birth for U.S.-born residents:
- This state: 146
- Other state: 199
- Northeast: 29
- Midwest: 38
- South: 134
- West: 0
96.9% of San Geronimo residents lived in the same house 1 years ago.
Out of people who lived in different houses, 48.3% lived in this county.
| San Geronimo: | 96.9% |
| State average: | 88.9% |
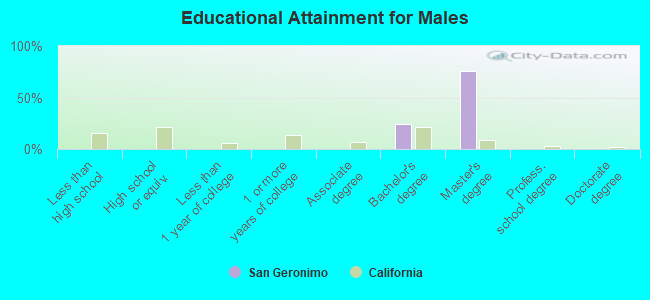
Education attainment for males 25 years and older:
- No schooling: 0
- Nursery to 4th grade: 0
- 5th and 6th grade: 0
- 7th and 8th grade: 0
- 9th grade: 0
- 10th grade: 0
- 11th grade: 0
- 12th grade, no diploma: 0
- High school graduate (or equivalency): 0
- Less than 1 year of college: 0
- Some college more than 1 year, no degree: 0
- Associate degree: 0
- Bachelor's degree: 30
- Master's degree: 93
- Professional school degree: 0
- Doctorate degree: 0
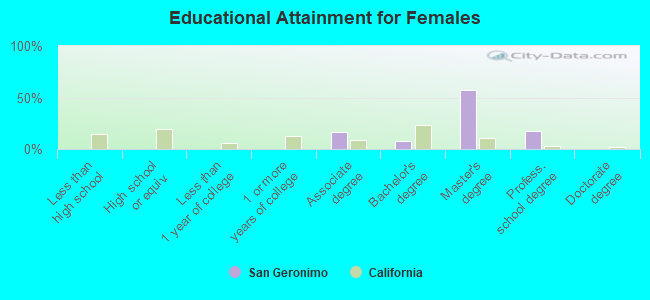
Education attainment for females 25 years and older:
- No schooling: 0
- Nursery to 4th grade: 0
- 5th and 6th grade: 0
- 7th and 8th grade: 0
- 9th grade: 0
- 10th grade: 0
- 11th grade: 0
- 12th grade, no diploma: 0
- High school graduate (or equivalency): 0
- Less than 1 year of college: 0
- Some college more than 1 year, no degree: 0
- Associate degree: 21
- Bachelor's degree: 10
- Master's degree: 71
- Professional school degree: 22
- Doctorate degree: 0
Housing units in structures:
- One, detached: 114
- One, attached: 27
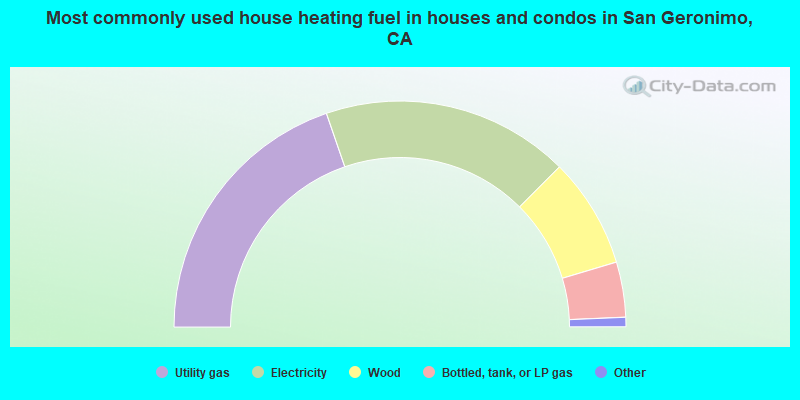
- 40.0%Utility gas
- 36.0%Electricity
- 16.0%Wood
- 8.0%Bottled, tank, or LP gas
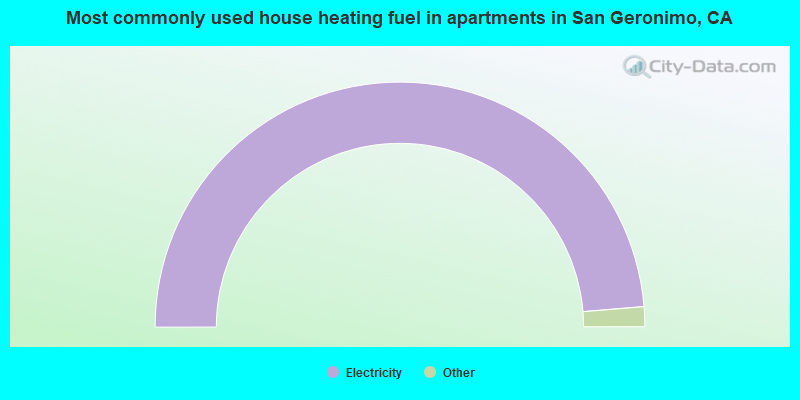
- 100.0%Electricity
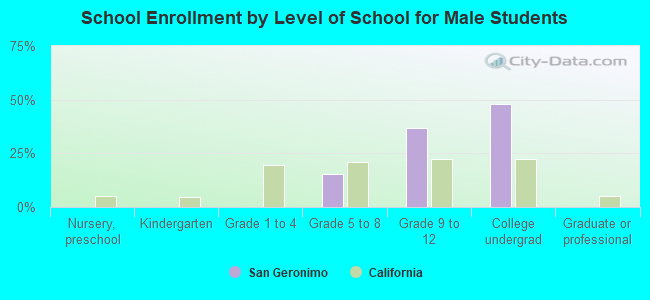
Private vs. public school enrollment:
| Here: | 0.0% |
| California: | 10.5% |
| Here: | 0.0% |
| California: | 8.5% |
| Here: | 0.0% |
| California: | 15.9% |