Housing density: 960 houses/condos per square mile
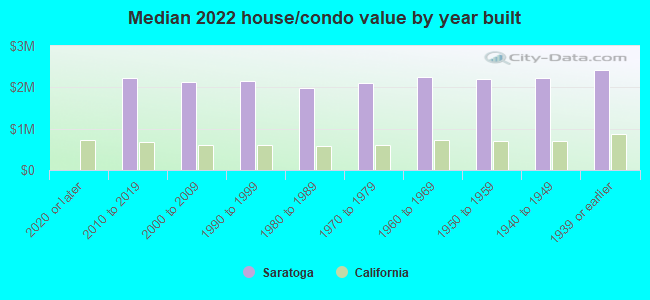
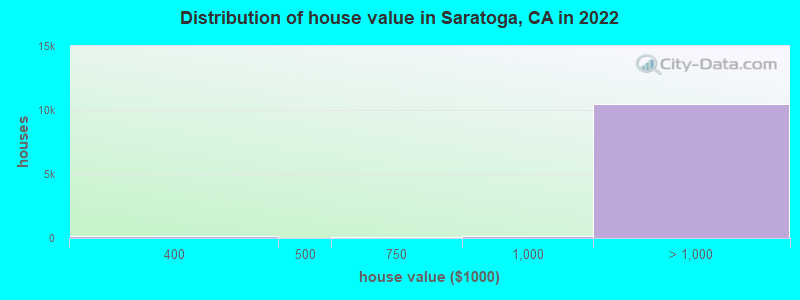
Median price asked for vacant for-sale houses and condos in 2022: $2,338,727.
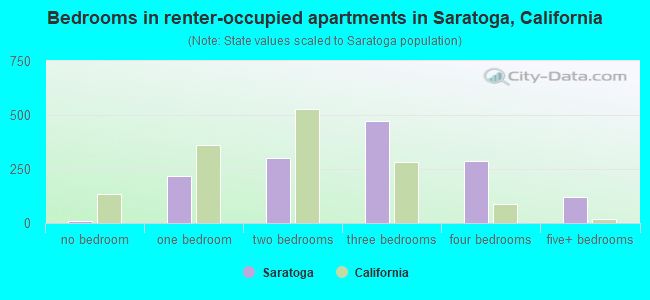
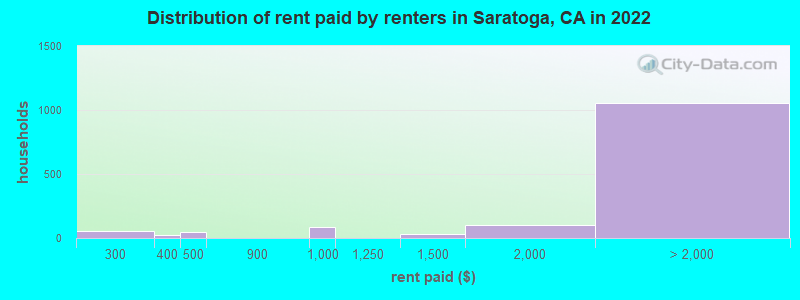
Median contract rent in 2022: over $2,000
Median rent asked for vacant for-rent units in 2022: $7,465
Median gross rent in Saratoga, CA in 2022: over $2,000
Housing units in Saratoga with a mortgage: 5,513 (765 second mortgage, 36 home equity loan, 665 both second mortgage and home equity loan) Houses without a mortgage: 96
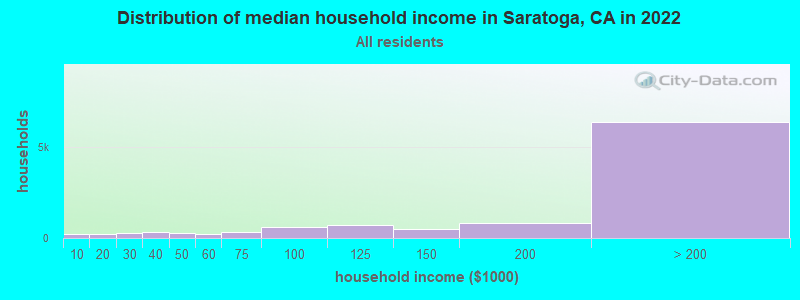
Median household income for houses/condos with a mortgage: $253,538
Median household income for apartments without a mortgage: $182,957
Size of family households: 3,847 2-persons, 2,449 3-persons, 2,027 4-persons, 567 5-persons, 125 6-persons, 77 7-or-more-persons.
Size of nonfamily households: 1,517 1-person, 194 2-persons, 82 3-persons.
5,161 married couples with children.
230 single-parent households (63 men, 167 women).
50.6% of residents of Saratoga speak English at home.
1.1% of residents speak Spanish at home (68% speak English very well, 19% speak English well, 13% speak English not well).
12.3% of residents speak other Indo-European language at home (84% speak English very well, 11% speak English well, 4% speak English not well, 1% don't speak English at all).
35.7% of residents speak Asian or Pacific Island language at home (66% speak English very well, 24% speak English well, 7% speak English not well, 3% don't speak English at all).
1.0% of residents speak other language at home (95% speak English very well, 3% speak English well, 2% speak English not well).
Foreign born population: 13,526 (45.0%)
(72.6% of them are naturalized citizens)
Percentage of workers working in this county: 91.9% Number of people working at home: 5,503 (40.8% of all workers)
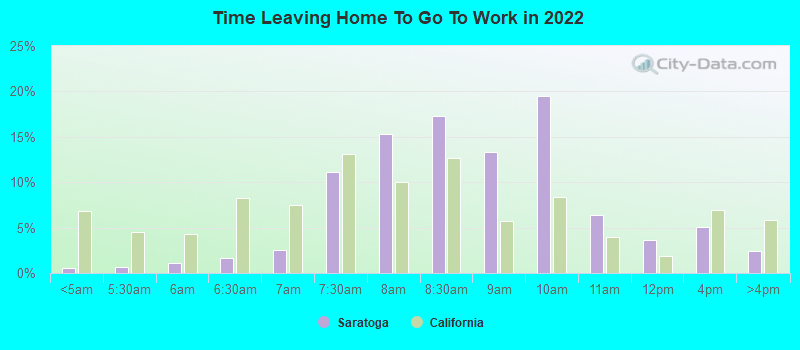
Travel time to work (commute)
Less than 5 minutes: 139
5 to 9 minutes: 418
10 to 14 minutes: 821
15 to 19 minutes: 1,216
20 to 24 minutes: 1,353
25 to 29 minutes: 798
30 to 34 minutes: 1,794
35 to 39 minutes: 250
40 to 44 minutes: 414
45 to 59 minutes: 780
60 to 89 minutes: 350
90 or more minutes: 93
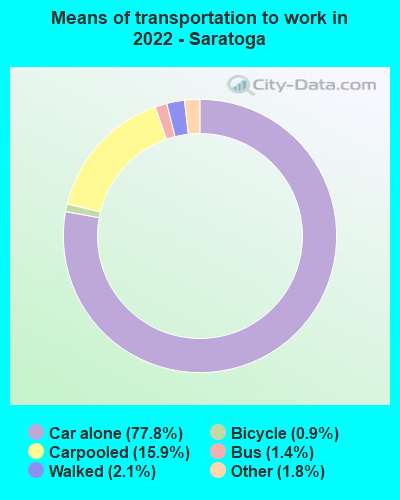
Means of transportation to work:
Drove a car alone: 4,132 (41.8%)
Carpooled: 870 (8.8%)
Bus: 54 (0.5%)
Taxi: 105 (1.1%)
Bicycle: 53 (0.5%)
Walked: 114 (1.2%)
Worked at home: 5,503 (55.7%)
Unemployment by race in 2022
Unemployment rate for White non-Hispanic residents
3.2%Males
1.3%Females
Unemployment rate for Asian residents
3.4%Males
2.7%Females
Unemployment rate for other race residents
15.9%Females
Unemployment rate for two or more race residents
7.5%Males
0.3%Females
Unemployment rate for Hispanic or Latino residents
5.7%Females
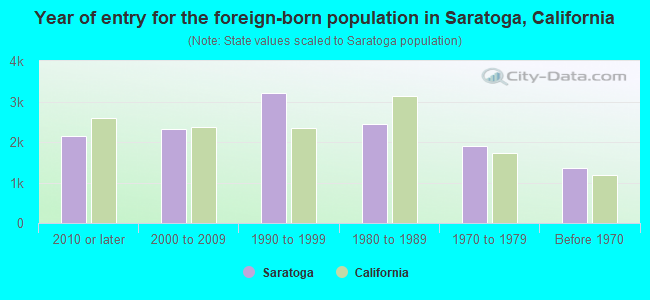
Year of entry for the foreign-born population in Saratoga, California
2,1492010 or later
2,3212000 to 2009
3,2041990 to 1999
2,4451980 to 1989
1,8961970 to 1979
1,352Before 1970
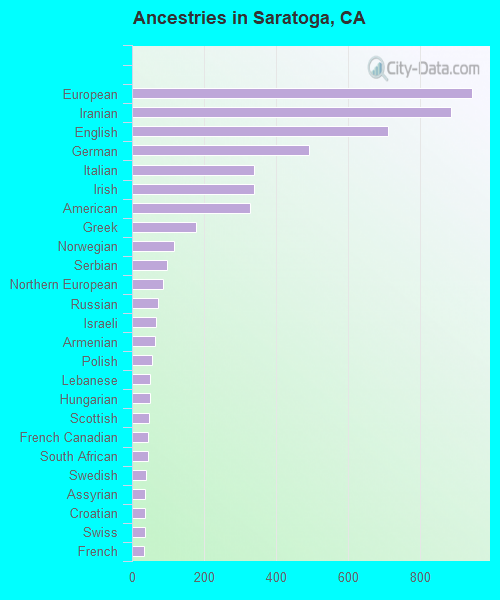
First ancestries reported:
European: 945 (4.6%)
Iranian: 887 (4.3%)
English: 711 (3.5%)
German: 492 (2.4%)
Italian: 339 (1.7%)
Irish: 338 (1.7%)
American: 329 (1.6%)
Greek: 178 (0.9%)
Norwegian: 116 (0.6%)
Serbian: 96 (0.5%)
Northern European: 86 (0.4%)
Russian: 72 (0.4%)
Israeli: 67 (0.3%)
Armenian: 64 (0.3%)
Polish: 55 (0.3%)
Lebanese: 50 (0.2%)
Hungarian: 50 (0.2%)
Scottish: 48 (0.2%)
French Canadian: 44 (0.2%)
South African: 44 (0.2%)
Swedish: 38 (0.2%)
Assyrian: 36 (0.2%)
Croatian: 35 (0.2%)
Swiss: 35 (0.2%)
French: 34 (0.2%)
Eastern European: 33 (0.2%)
Portuguese: 33 (0.2%)
Danish: 29 (0.1%)
Turkish: 29 (0.1%)
Finnish: 27 (0.1%)
Dutch: 25 (0.1%)
Brazilian: 22 (0.1%)
Ukrainian: 22 (0.1%)
Arab: 18 (0.09%)
Scandinavian: 18 (0.09%)
Romanian: 17 (0.08%)
Belgian: 9 (0.04%)
Slovak: 9 (0.04%)
Czech: 7 (0.03%)
British: 5 (0.02%)
Nigerian: 2 (0.01%)
Most common places of birth for foreign-born residents (%):
India
Saratoga:
24.1% (3,266)
California:
5.2% (539,184)
China, excluding Hong Kong and Taiwan
Saratoga:
21.8% (2,955)
California:
6.6% (684,672)
Taiwan
Saratoga:
16.1% (2,173)
California:
1.7% (176,274)
Iran
Saratoga:
6.1% (819)
California:
2.0% (206,004)
Hong Kong
Saratoga:
4.5% (607)
California:
1.0% (105,215)
Vietnam
Saratoga:
3.9% (521)
California:
4.9% (512,335)
Korea
Saratoga:
3.7% (502)
California:
3.0% (315,248)
Place of birth for U.S.-born residents:
This state: 10,776
Other state: 5,389
Northeast: 2,028
Midwest: 1,773
South: 875
West: 702
90.5% of Saratoga residents lived in the same house 1 years ago. Out of people who lived in different houses, 37.4% lived in this county. Out of people who lived in different counties, 51.8% lived in California.
Saratoga:
90.5%
State average:
88.9%
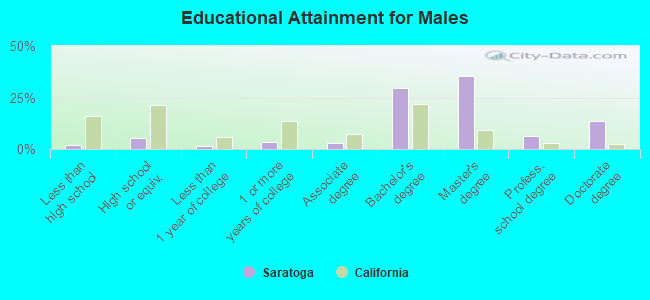
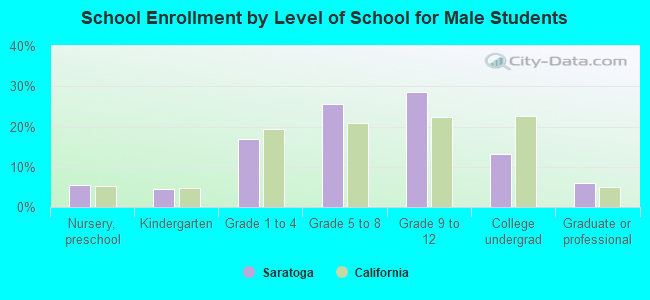
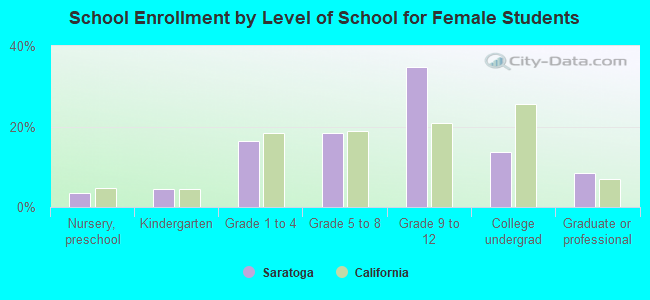
Education attainment for males 25 years and older:
No schooling: 57
Nursery to 4th grade: 0
5th and 6th grade: 118
7th and 8th grade: 0
9th grade: 9
10th grade: 1
11th grade: 7
12th grade, no diploma: 29
High school graduate (or equivalency): 588
Less than 1 year of college: 145
Some college more than 1 year, no degree: 398
Associate degree: 348
Bachelor's degree: 3,375
Master's degree: 4,054
Professional school degree: 742
Doctorate degree: 1,529
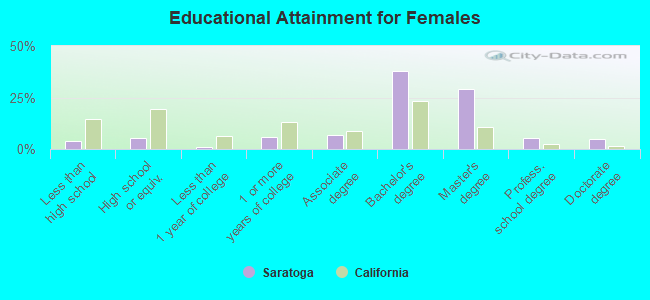
Education attainment for females 25 years and older:
No schooling: 131
Nursery to 4th grade: 68
5th and 6th grade: 42
7th and 8th grade: 4
9th grade: 31
10th grade: 37
11th grade: 23
12th grade, no diploma: 112
High school graduate (or equivalency): 639
Less than 1 year of college: 105
Some college more than 1 year, no degree: 694
Associate degree: 785
Bachelor's degree: 4,454
Master's degree: 3,452
Professional school degree: 655
Doctorate degree: 548
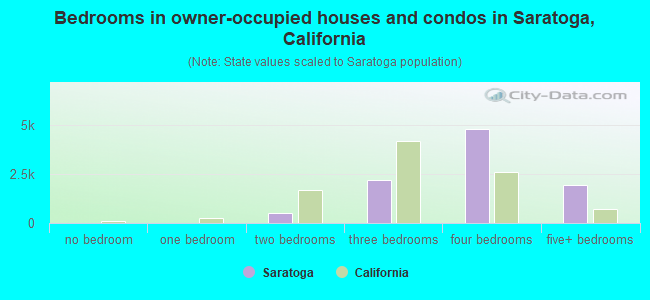
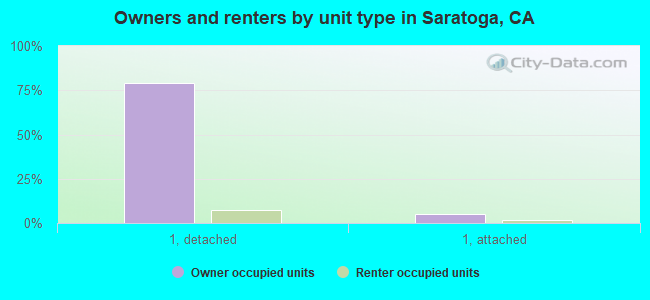
Housing units in structures:
One, detached: 9,912
One, attached: 684
Two: 29
3 or 4: 280
5 to 9: 100
10 to 19: 63
20 to 49: 238
50 or more: 226
Mobile homes: 82
Housing units lacking complete kitchen facilities in 2022: 0.5%
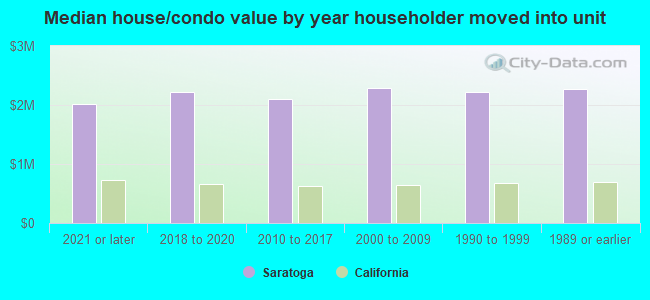
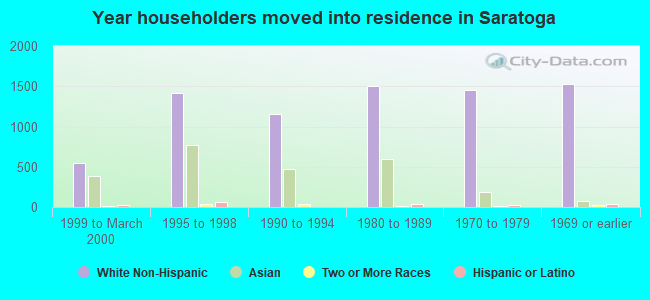
House/condo owner moved in on average 18 years ago