Sidney, KY (Kentucky) Houses and Residents
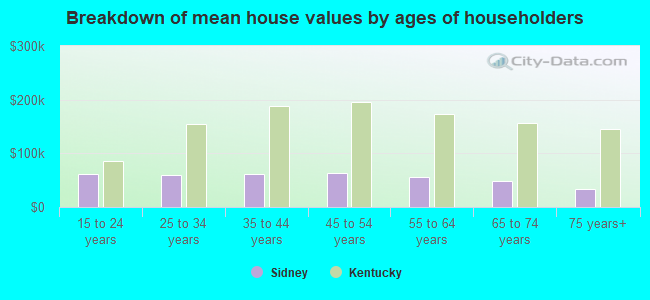
| Sidney: | $110,311 |
| Kentucky: | $196,300 |
Total population: 2,766 (Urban population: 0, Rural population: 2,892 (all nonfarm))
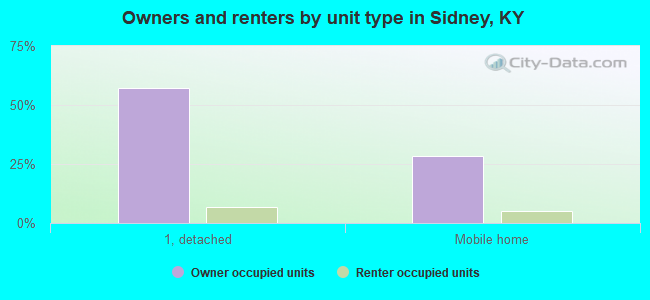
Houses: 1,249 (1,117 occupied: 971 owner occupied, 146 renter occupied)
| % of renters here: | 13% |
| State: | 31% |
Housing density: 24 houses/condos per square mile
Median price asked for vacant for-sale houses and condos in 2022 in this county: $96,528.
Median contract rent in 2022: $587 (lower quartile is $422, upper quartile is $710)
Median rent asked for vacant for-rent units in 2022: $616
Median gross rent in Sidney, KY in 2022: $920
Housing units in Sidney with a mortgage: 243 (14 second mortgage, 10 home equity loan, 0 both second mortgage and home equity loan)
Houses without a mortgage: 246


Household type by relationship:
Households: 63,924- In family households: 54,636 (13,138 male householders, 5,412 female householders)
13,943 spouses, 17,135 children (15,447 natural, 522 adopted, 1,166 stepchildren), 1,943 grandchildren, 466 brothers or sisters, 443 parents, foster children, 657 other relatives, 1,121 non-relatives
- In nonfamily households: 9,288 (3,767 male householders (3,205 living alone)), 4,411 female householders (4,077 living alone)), 1,110 nonrelatives
- In group quarters: 1,100 (725 institutionalized population)
11,571 married couples with children.
3,305 single-parent households (668 men, 2,637 women).
98.8% of residents of Sidney speak English at home.
0.6% of residents speak Spanish at home (100% speak English very well).
0.4% of residents speak other Indo-European language at home (100% speak English very well).
0.2% of residents speak Asian or Pacific Island language at home (100% speak English very well).
Foreign born population: 8 (0.3%)
(100.0% of them are naturalized citizens)
| Here: | 6.4 |
| State: | 6.4 |
| Here: | 6.2 |
| State: | 4.4 |
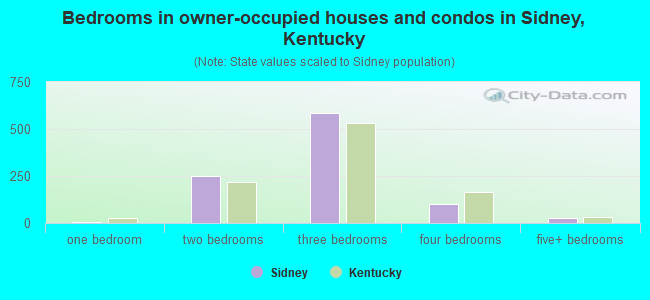
- Bedrooms in owner-occupied houses and condos in Sidney, Kentucky
- 0no bedroom
- 71 bedroom
- 2522 bedrooms
- 5853 bedrooms
- 1034 bedrooms
- 245+ bedrooms
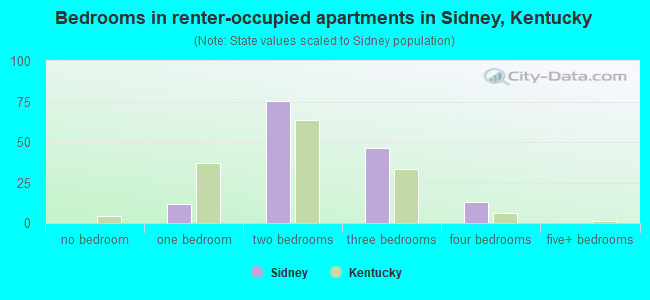
- Bedrooms in renter-occupied apartments in Sidney, Kentucky
- 0no bedroom
- 121 bedroom
- 752 bedrooms
- 463 bedrooms
- 134 bedrooms
- 05+ bedrooms
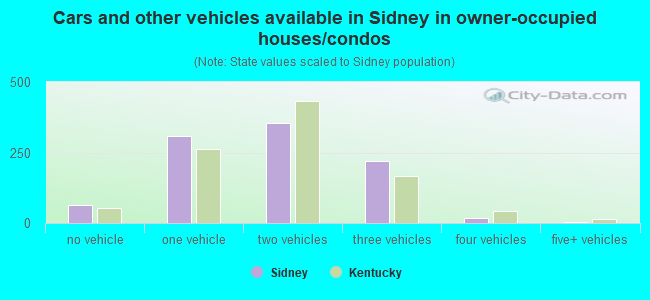
- Cars and other vehicles available in Sidney in owner-occupied houses/condos
- 65no vehicle
- 3101 vehicle
- 3552 vehicles
- 2193 vehicles
- 194 vehicles
- 35+ vehicles
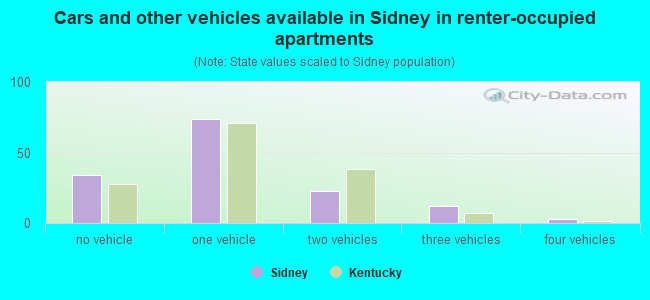
- Cars and other vehicles available in Sidney in renter-occupied apartments
- 34no vehicle
- 741 vehicle
- 232 vehicles
- 123 vehicles
- 34 vehicles
- 05+ vehicles
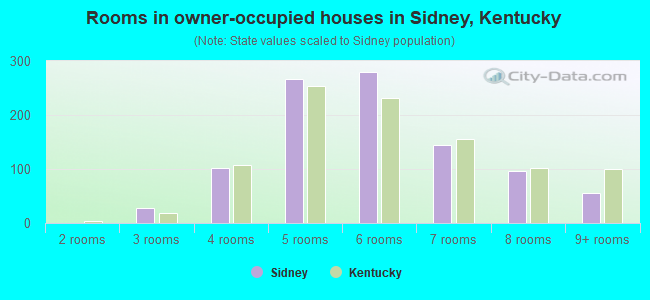
- Rooms in owner-occupied houses in Sidney, Kentucky
- 01 room
- 02 rooms
- 273 rooms
- 1014 rooms
- 2665 rooms
- 2806 rooms
- 1447 rooms
- 978 rooms
- 569+ rooms
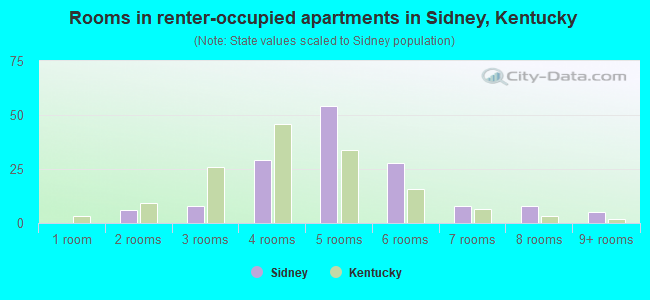
- Rooms in renter-occupied apartments in Sidney, Kentucky
- 01 room
- 62 rooms
- 83 rooms
- 294 rooms
- 545 rooms
- 286 rooms
- 87 rooms
- 88 rooms
- 59+ rooms
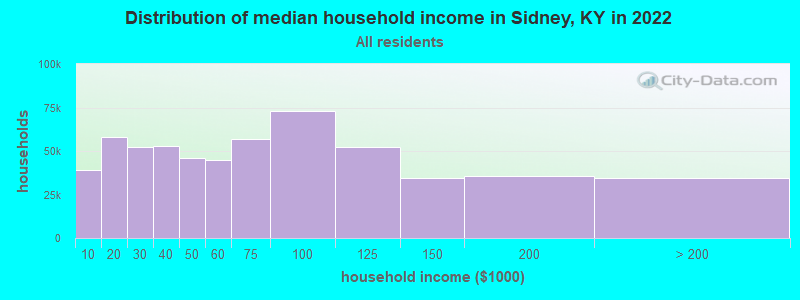
Sidney, KY household income distribution

- 34,079Less than $10,000
- 55,290$10,000 to $19,999
- 46,590$20,000 to $29,999
- 49,361$30,000 to $39,999
- 37,720$40,000 to $49,999
- 41,441$50,000 to $59,999
- 47,542$60,000 to $74,999
- 65,887$75,000 to $99,999
- 47,084$100,000 to $124,999
- 28,889$125,000 to $149,999
- 28,633$150,000 to $199,999
- 24,614$200,000 or more
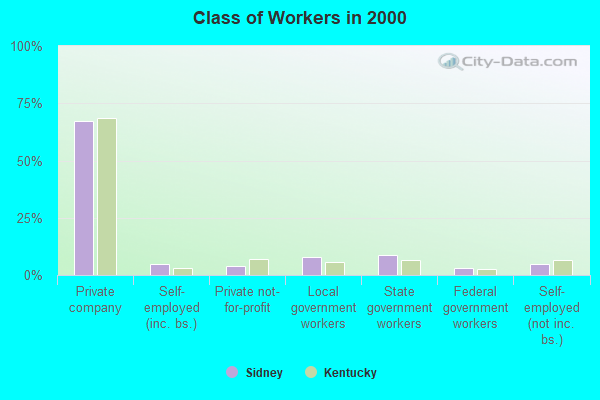
Percentage of workers working in this county: 73.5%
Number of people working at home: 75 (8.5% of all workers)
Travel time to work (commute)
- Less than 5 minutes: 23
- 5 to 9 minutes: 38
- 10 to 14 minutes: 80
- 15 to 19 minutes: 102
- 20 to 24 minutes: 179
- 25 to 29 minutes: 62
- 30 to 34 minutes: 158
- 35 to 39 minutes: 29
- 40 to 44 minutes: 26
- 45 to 59 minutes: 42
- 60 to 89 minutes: 95
- 90 or more minutes: 17
Means of transportation to work:
- Drove a car alone: 715 (84.0%)
- Carpooled: 103 (12.1%)
- Bus or trolley bus: 6 (0.7%)
- Walked: 20 (2.4%)
- Other means: 7 (0.8%)
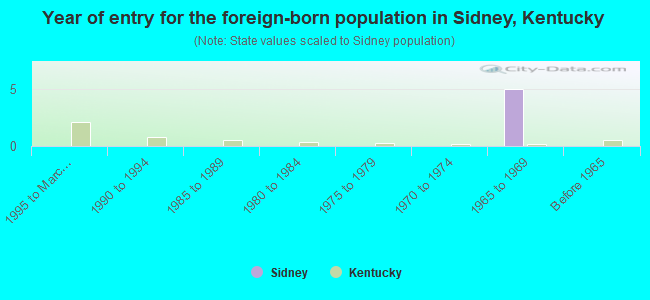
- Year of entry for the foreign-born population in Sidney, Kentucky
- 01995 to March 2000
- 01990 to 1994
- 01985 to 1989
- 01980 to 1984
- 01975 to 1979
- 01970 to 1974
- 51965 to 1969
- 0Before 1965
Most common places of birth for foreign-born residents (%):
| Sidney: | 100.0% (5) |
| Kentucky: | 3.2% (2,532) |
Place of birth for U.S.-born residents:
- This state: 2,118
- Other state: 749
- Northeast: 6
- Midwest: 75
- South: 658
- West: 10
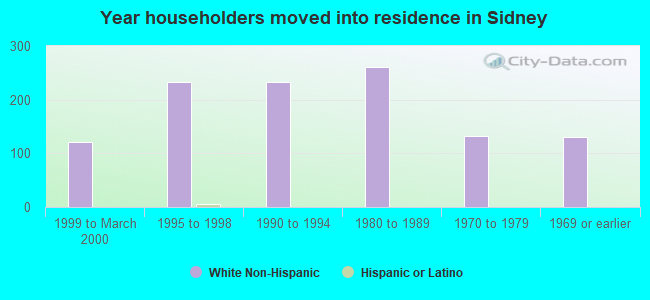
73% of Sidney residents lived in the same house 5 years ago.
Out of people who lived in different houses, 79% lived in this county.
Out of people who lived in different counties, 30% lived in Kentucky.
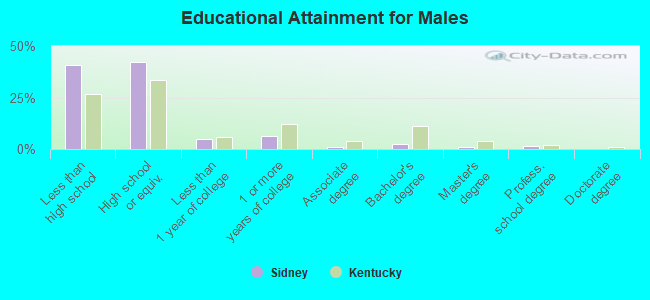
Education attainment for males 25 years and older:
- No schooling: 26
- Nursery to 4th grade: 29
- 5th and 6th grade: 38
- 7th and 8th grade: 129
- 9th grade: 47
- 10th grade: 38
- 11th grade: 44
- 12th grade, no diploma: 34
- High school graduate (or equivalency): 403
- Less than 1 year of college: 44
- Some college more than 1 year, no degree: 62
- Associate degree: 11
- Bachelor's degree: 21
- Master's degree: 7
- Professional school degree: 16
- Doctorate degree: 0
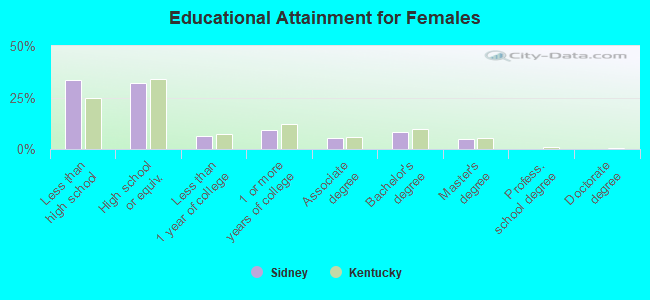
Education attainment for females 25 years and older:
- No schooling: 10
- Nursery to 4th grade: 12
- 5th and 6th grade: 20
- 7th and 8th grade: 115
- 9th grade: 48
- 10th grade: 44
- 11th grade: 40
- 12th grade, no diploma: 42
- High school graduate (or equivalency): 317
- Less than 1 year of college: 63
- Some college more than 1 year, no degree: 89
- Associate degree: 54
- Bachelor's degree: 81
- Master's degree: 47
- Professional school degree: 0
- Doctorate degree: 0


Housing units in structures:
- One, detached: 789
- One, attached: 7
- Two: 16
- 3 or 4: 16
- Mobile homes: 421
Median worth of mobile homes: $75,437
Housing units lacking complete kitchen facilities: 1.8%
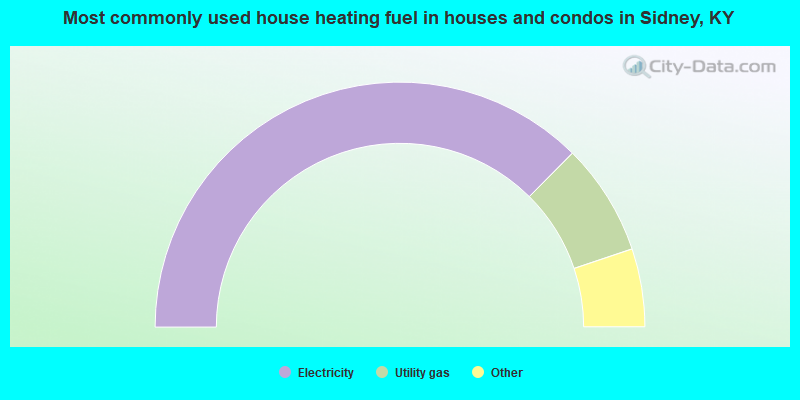
- 74.9%Electricity
- 14.8%Utility gas
- 3.3%Bottled, tank, or LP gas
- 2.9%Coal or coke
- 2.8%Fuel oil, kerosene, etc.
- 1.0%No fuel used
- 0.3%Wood
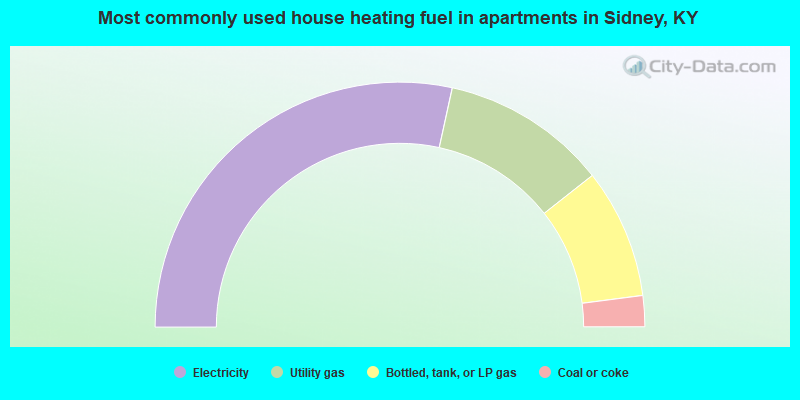
- 56.8%Electricity
- 21.9%Utility gas
- 17.1%Bottled, tank, or LP gas
- 4.1%Coal or coke
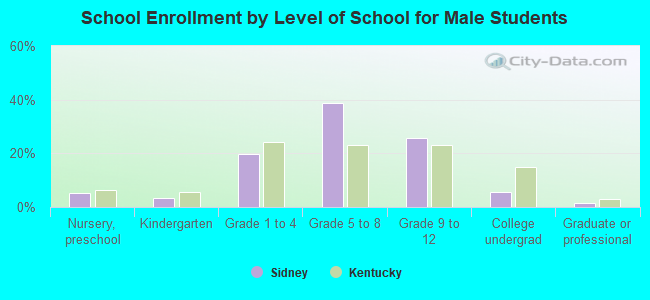
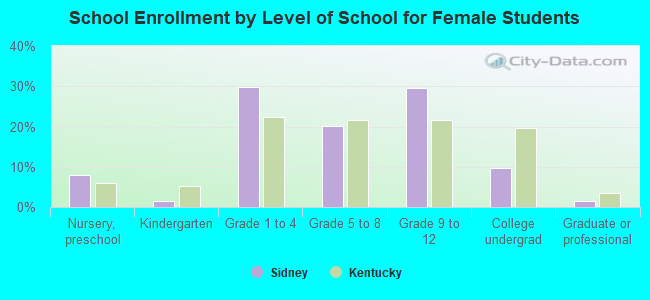
Private vs. public school enrollment:
| Here: | 6.3% |
| Kentucky: | 11.9% |
| Here: | 3.4% |
| Kentucky: | 10.6% |
| Here: | 26.0% |
| Kentucky: | 18.1% |