Slater, SC (South Carolina) Houses and Residents
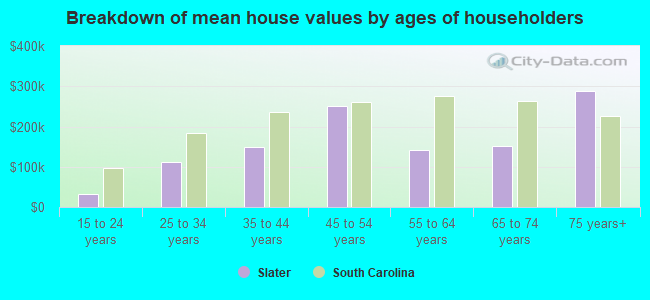
| Slater: | $194,382 |
| South Carolina: | $254,600 |
Total population: 5,804 (Urban population: 0, Rural population: 5,130 (103 farm, 5,027 nonfarm))
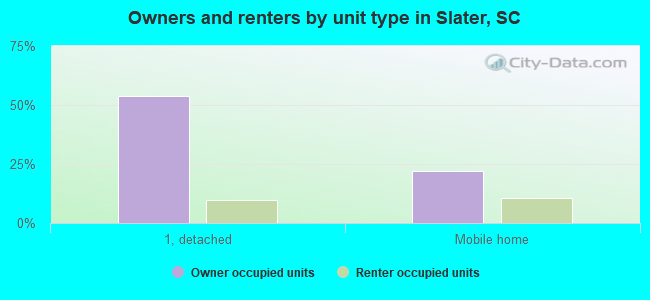
Houses: 2,525 (2,014 occupied: 1,556 owner occupied, 458 renter occupied)
| % of renters here: | 23% |
| State: | 28% |
Housing density: 29 houses/condos per square mile
Median price asked for vacant for-sale houses and condos in 2022 in this county: $549,064.
Median contract rent in 2022: $760 (lower quartile is $578, upper quartile is $1,061)
Median rent asked for vacant for-rent units in 2022: $988
Median gross rent in Slater, SC in 2022: $989
Housing units in Slater with a mortgage: 525 (75 second mortgage, 27 home equity loan, 0 both second mortgage and home equity loan)
Houses without a mortgage: 414
Compare current foreclosures near Slater, SC:
| Photo | Address | Area | Beds / Baths | Price | Details |
|---|---|---|---|---|---|

|
#1
Lindbergh St
Slater, SC 29683
|
- sq. feet
|
- baths - beds |
show details | |

|
#2
Rainbow Dr
Greenville, SC 29617
|
1,250 sq. feet
|
2 baths 3 beds |
show details | |

|
#3
Jeter Mountain Rd
Hendersonville, NC 28739
|
640 sq. feet
|
1 baths 2 beds |
show details | |

|
#4
Oakfield Ave
Easley, SC 29640
|
1,765 sq. feet
|
2 baths 3 beds |
show details | |

|
#5
Stokes St
Greenville, SC 29611
|
1,884 sq. feet
|
2 baths 3 beds |
show details | |

|
#6
Dogwood Lane Ext
Travelers Rest, SC 29690
|
2,266 sq. feet
|
2 baths 3 beds |
show details | |

|
#7
Red Valley Rd
Penrose, NC 28766
|
2,128 sq. feet
|
2 baths 4 beds |
show details | |

|
#8
Laurel Oak Ln
Pickens, SC 29671
|
1,560 sq. feet
|
2 baths 3 beds |
show details | |

|
#9
E Circle Dr
Marietta, SC 29661
|
1,271 sq. feet
|
1 baths 3 beds |
show details | |

|
#10
Coventry Ln
Greenville, SC 29609
|
1,737 sq. feet
|
1 baths 3 beds |
show details |
| Photo | Address | Area | Beds / Baths | Price | Details |
|---|---|---|---|---|---|

|
#11
Calico Ct
Taylors, SC 29687
|
2,024 sq. feet
|
2 baths 3 beds |
show details | |

|
#12
Beckenham Ln
Greenville, SC 29609
|
2,205 sq. feet
|
2 baths 3 beds |
show details | |

|
#13
Oak Hill Dr
Greenville, SC 29617
|
972 sq. feet
|
2 baths 2 beds |
show details | |

|
#14
S Franklin Rd
Greenville, SC 29609
|
842 sq. feet
|
1 baths 2 beds |
show details | |

|
#15
Hart Cut Rd
Marietta, SC 29661
|
1,518 sq. feet
|
1 baths 3 beds |
show details | |

|
#16
Cherrylane Dr
Greenville, SC 29617
|
1,316 sq. feet
|
2 baths 3 beds |
show details | |

|
#17
Aladdin St
Greenville, SC 29609
|
792 sq. feet
|
1 baths 2 beds |
show details | |

|
#18
Vale St
Greenville, SC 29617
|
1,450 sq. feet
|
1 baths 3 beds |
show details | |

|
#19
Cedar Rock Church Rd
Easley, SC 29640
|
1,402 sq. feet
|
2 baths 3 beds |
show details | |

|
#20
Gardenia Dr
Greenville, SC 29617
|
1,192 sq. feet
|
1 baths 3 beds |
show details |
| Photo | Address | Area | Beds / Baths | Price | Details |
|---|---|---|---|---|---|

|
#21
Upper Lake Dr
Easley, SC 29640
|
2,143 sq. feet
|
2 baths 3 beds |
show details | |

|
#22
Robertson Rd
Taylors, SC 29687
|
2,468 sq. feet
|
2 baths 3 beds |
show details | |

|
#23
Gardenia Dr
Greenville, SC 29617
|
1,402 sq. feet
|
2 baths 3 beds |
show details | |

|
#24
Lily St
Greenville, SC 29617
|
1,512 sq. feet
|
1 baths 3 beds |
show details | |

|
#25
State Park Rd
Greenville, SC 29609
|
2,106 sq. feet
|
2 baths 3 beds |
show details | |

|
#26
Kavanagh Ct
Greenville, SC 29611
|
1,510 sq. feet
|
2 baths 3 beds |
show details | |

|
#27
Apa Way
Greenville, SC 29611
|
1,320 sq. feet
|
2 baths 3 beds |
show details | |

|
#28
Apa Way
Greenville, SC 29611
|
1,320 sq. feet
|
2 baths 3 beds |
show details | |

|
#29
Green Fern Dr
Greenville, SC 29611
|
2,116 sq. feet
|
2 baths 3 beds |
show details | |

|
#30
Callahan Ave
Greenville, SC 29617
|
1,114 sq. feet
|
1 baths 3 beds |
show details |
| Photo | Address | Area | Beds / Baths | Price | Details |
|---|---|---|---|---|---|

|
#31
Parkdale Dr
Greenville, SC 29611
|
1,299 sq. feet
|
2 baths 3 beds |
show details | |

|
#32
Crest Way
Easley, SC 29640
|
1,595 sq. feet
|
2 baths 4 beds |
show details | |

|
#33
Emile St
Greenville, SC 29617
|
1,204 sq. feet
|
1 baths 2 beds |
show details | |

|
#34
Edwards Lake Rd
Greer, SC 29651
|
1,245 sq. feet
|
1 baths 2 beds |
show details | |

|
#35
W Lee Rd
Taylors, SC 29687
|
1,199 sq. feet
|
2 baths 3 beds |
show details | |

|
#36
Lost Valley Rd
Pickens, SC 29671
|
960 sq. feet
|
1 baths 2 beds |
show details | |

|
#37
Cardinal Woods Way
Easley, SC 29642
|
1,505 sq. feet
|
2 baths 3 beds |
show details | |

|
#38
Watson Ave
Greenville, SC 29601
|
1,575 sq. feet
|
2 baths 3 beds |
show details | |

|
#39
Valerie Dr
Greenville, SC 29615
|
2,613 sq. feet
|
3 baths 3 beds |
show details | |

|
#40
Longmeadow Rd
Taylors, SC 29687
|
2,352 sq. feet
|
2 baths 3 beds |
show details |
| Photo | Address | Area | Beds / Baths | Price | Details |
|---|---|---|---|---|---|

|
#41
Ledbetter St
Greenville, SC 29611
|
840 sq. feet
|
1 baths 2 beds |
show details | |

|
#42
Wilbur St
Easley, SC 29640
|
1,536 sq. feet
|
1 baths 3 beds |
show details | |

|
#43
Central Ave
Greenville, SC 29601
|
2,397 sq. feet
|
2 baths 3 beds |
show details | |

|
#44
Lincoln Rd
Taylors, SC 29687
|
1,568 sq. feet
|
1 baths 2 beds |
show details | |

|
#45
Lued Robinson Ct
Greenville, SC 29611
|
1,322 sq. feet
|
2 baths 3 beds |
show details | |

|
#46
W Earle St
Greenville, SC 29609
|
2,878 sq. feet
|
1 baths 4 beds |
show details | |

|
#47
Evergreen Cv
Pisgah Forest, NC 28768
|
1,652 sq. feet
|
2 baths 3 beds |
show details | |

|
#48
Robin Hood Rd
Taylors, SC 29687
|
884 sq. feet
|
1 baths 2 beds |
show details | |

|
#49
3rd St
Greenville, SC 29611
|
1,372 sq. feet
|
3 baths 5 beds |
show details | |

|
Check over 1 million property listings on Foreclosure.com!
|
browse all offers | |||

Household type by relationship:
Households: 439,371- In family households: 370,404 (81,926 male householders, 37,436 female householders)
87,697 spouses, 128,518 children (119,167 natural, 3,386 adopted, 5,965 stepchildren), 10,085 grandchildren, 4,288 brothers or sisters, 3,470 parents, foster children, 5,622 other relatives, 9,122 non-relatives
- In nonfamily households: 68,967 (25,968 male householders (20,551 living alone)), 31,201 female householders (27,151 living alone)), 11,798 nonrelatives
- In group quarters: 11,854 (4,047 institutionalized population)
62,276 married couples with children.
21,838 single-parent households (3,915 men, 17,923 women).
93.3% of residents of Slater speak English at home.
5.1% of residents speak Spanish at home (34% speak English very well, 13% speak English well, 19% speak English not well, 33% don't speak English at all).
1.4% of residents speak other Indo-European language at home (78% speak English very well, 10% speak English well, 12% speak English not well).
0.2% of residents speak Asian or Pacific Island language at home (100% speak English very well).
Foreign born population: 467 (6.3%)
(28.7% of them are naturalized citizens)
| Here: | 5.7 |
| State: | 6.4 |
| Here: | 4.3 |
| State: | 4.5 |
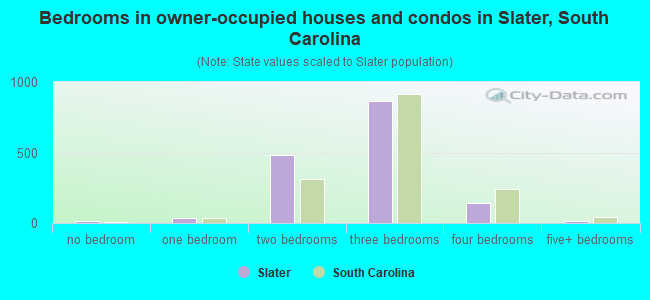
- Bedrooms in owner-occupied houses and condos in Slater, South Carolina
- 17no bedroom
- 351 bedroom
- 4822 bedrooms
- 8623 bedrooms
- 1434 bedrooms
- 175+ bedrooms
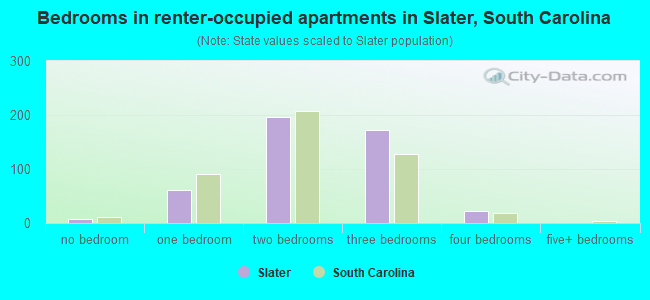
- Bedrooms in renter-occupied apartments in Slater, South Carolina
- 7no bedroom
- 611 bedroom
- 1962 bedrooms
- 1723 bedrooms
- 224 bedrooms
- 05+ bedrooms
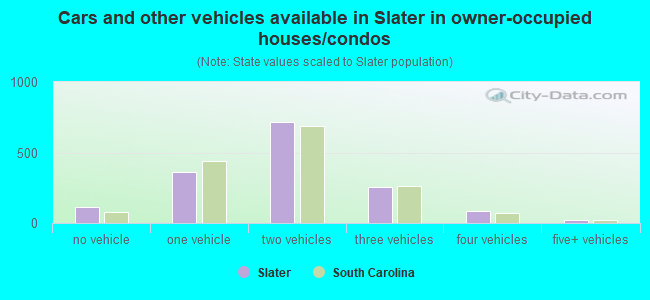
- Cars and other vehicles available in Slater in owner-occupied houses/condos
- 114no vehicle
- 3611 vehicle
- 7172 vehicles
- 2563 vehicles
- 854 vehicles
- 235+ vehicles
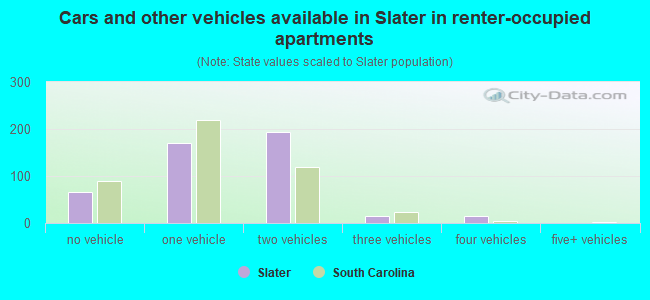
- Cars and other vehicles available in Slater in renter-occupied apartments
- 65no vehicle
- 1711 vehicle
- 1932 vehicles
- 143 vehicles
- 154 vehicles
- 05+ vehicles
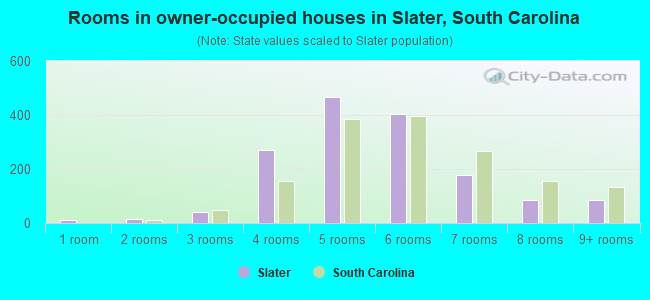
- Rooms in owner-occupied houses in Slater, South Carolina
- 101 room
- 132 rooms
- 423 rooms
- 2704 rooms
- 4675 rooms
- 4056 rooms
- 1787 rooms
- 878 rooms
- 849+ rooms
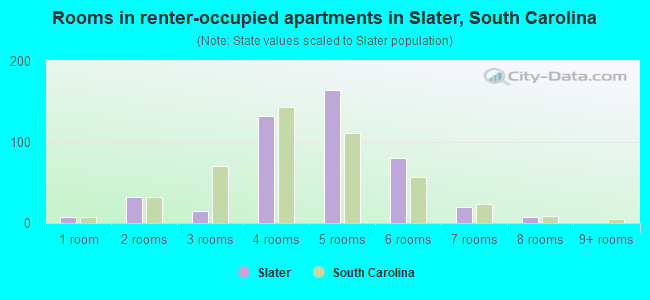
- Rooms in renter-occupied apartments in Slater, South Carolina
- 71 room
- 322 rooms
- 153 rooms
- 1324 rooms
- 1645 rooms
- 806 rooms
- 207 rooms
- 88 rooms
- 09+ rooms
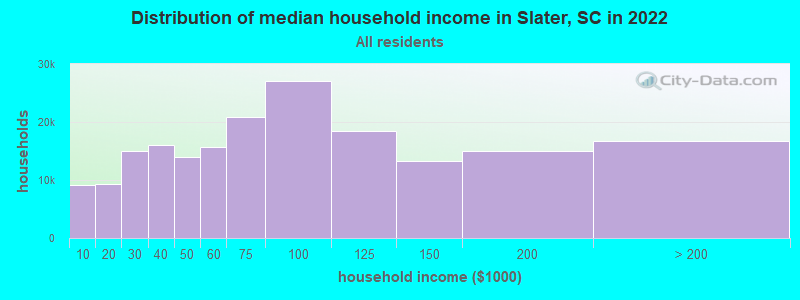
Slater, SC household income distribution

- 9,219Less than $10,000
- 9,226$10,000 to $19,999
- 14,962$20,000 to $29,999
- 16,012$30,000 to $39,999
- 13,962$40,000 to $49,999
- 15,708$50,000 to $59,999
- 20,806$60,000 to $74,999
- 27,098$75,000 to $99,999
- 18,451$100,000 to $124,999
- 13,264$125,000 to $149,999
- 15,016$150,000 to $199,999
- 16,689$200,000 or more
Percentage of workers working in this county: 86.2%
Number of people working at home: 475 (13.6% of all workers)
Travel time to work (commute)
- Less than 5 minutes: 89
- 5 to 9 minutes: 234
- 10 to 14 minutes: 215
- 15 to 19 minutes: 271
- 20 to 24 minutes: 302
- 25 to 29 minutes: 100
- 30 to 34 minutes: 416
- 35 to 39 minutes: 98
- 40 to 44 minutes: 93
- 45 to 59 minutes: 367
- 60 to 89 minutes: 174
- 90 or more minutes: 44
Means of transportation to work:
- Drove a car alone: 1,914 (78.6%)
- Carpooled: 341 (14.0%)
- Bus or trolley bus: 28 (1.2%)
- Taxi: 5 (0.2%)
- Walked: 57 (2.3%)
- Other means: 58 (2.4%)
- Worked at home: 31 (1.3%)
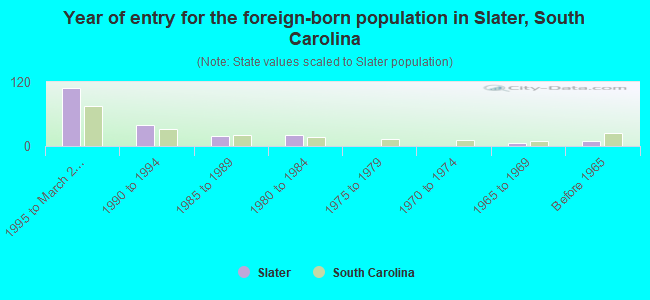
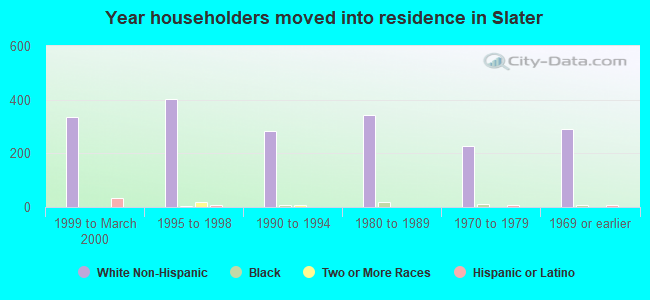
- Year of entry for the foreign-born population in Slater, South Carolina
- 1081995 to March 2000
- 391990 to 1994
- 181985 to 1989
- 211980 to 1984
- 01975 to 1979
- 01970 to 1974
- 61965 to 1969
- 9Before 1965
Most common places of birth for foreign-born residents (%):
| Slater: | 74.1% (149) |
| South Carolina: | 27.3% (31,719) |
| Slater: | 10.0% (20) |
| South Carolina: | 2.9% (3,394) |
| Slater: | 7.0% (14) |
| South Carolina: | 0.5% (628) |
| Slater: | 5.0% (10) |
| South Carolina: | 1.3% (1,563) |
| Slater: | 4.0% (8) |
| South Carolina: | 4.4% (5,108) |
Place of birth for U.S.-born residents:
- This state: 3,609
- Other state: 1,311
- Northeast: 145
- Midwest: 220
- South: 882
- West: 64
66% of Slater residents lived in the same house 5 years ago.
Out of people who lived in different houses, 73% lived in this county.
Out of people who lived in different counties, 31% lived in South Carolina.
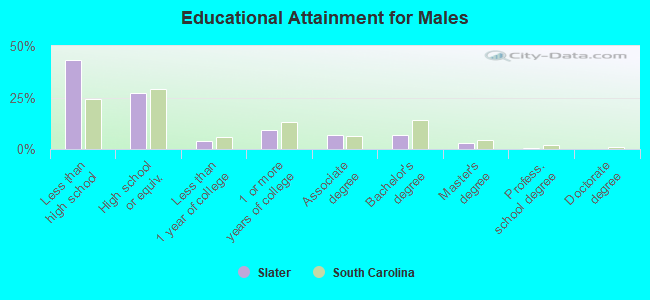
Education attainment for males 25 years and older:
- No schooling: 61
- Nursery to 4th grade: 44
- 5th and 6th grade: 65
- 7th and 8th grade: 179
- 9th grade: 80
- 10th grade: 163
- 11th grade: 81
- 12th grade, no diploma: 54
- High school graduate (or equivalency): 461
- Less than 1 year of college: 66
- Some college more than 1 year, no degree: 152
- Associate degree: 117
- Bachelor's degree: 115
- Master's degree: 46
- Professional school degree: 5
- Doctorate degree: 0
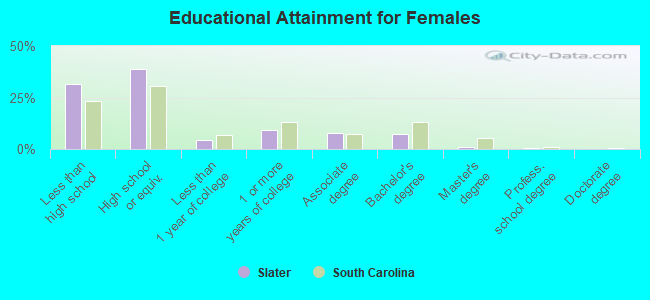
Education attainment for females 25 years and older:
- No schooling: 34
- Nursery to 4th grade: 34
- 5th and 6th grade: 79
- 7th and 8th grade: 115
- 9th grade: 61
- 10th grade: 84
- 11th grade: 105
- 12th grade, no diploma: 49
- High school graduate (or equivalency): 691
- Less than 1 year of college: 77
- Some college more than 1 year, no degree: 164
- Associate degree: 136
- Bachelor's degree: 126
- Master's degree: 18
- Professional school degree: 8
- Doctorate degree: 0


Housing units in structures:
- One, detached: 1,667
- One, attached: 28
- Two: 42
- 3 or 4: 21
- Mobile homes: 767
Median worth of mobile homes: $82,231
Housing units lacking complete kitchen facilities: 1.4%
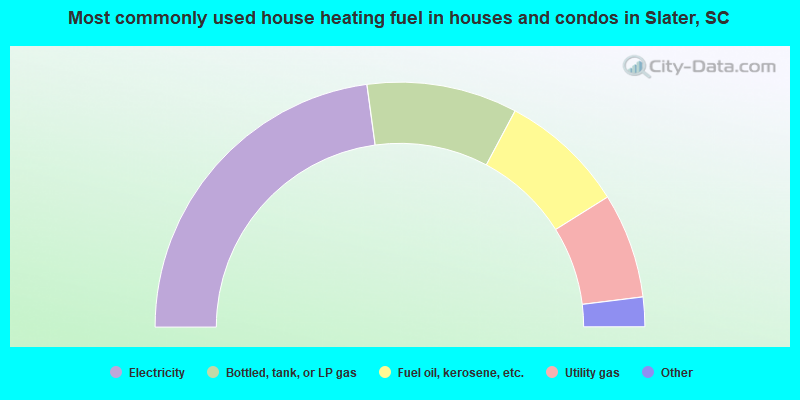
- 45.7%Electricity
- 19.9%Bottled, tank, or LP gas
- 16.6%Fuel oil, kerosene, etc.
- 13.9%Utility gas
- 3.5%Wood
- 0.4%No fuel used
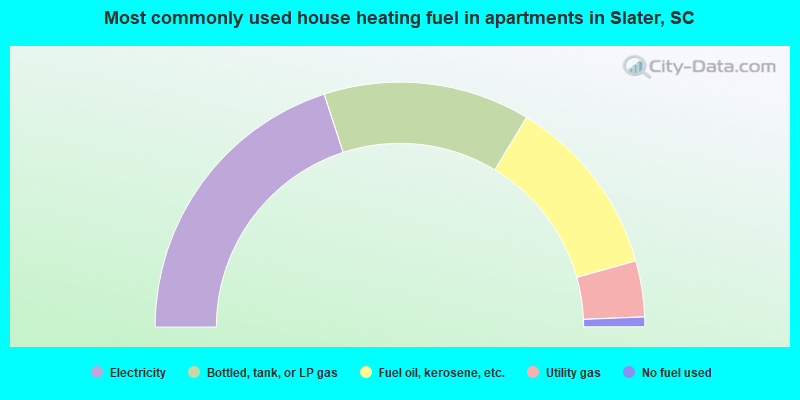
- 40.0%Electricity
- 27.3%Bottled, tank, or LP gas
- 24.0%Fuel oil, kerosene, etc.
- 7.4%Utility gas
- 1.3%No fuel used
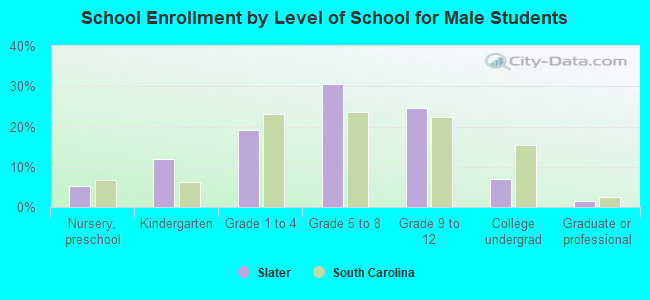
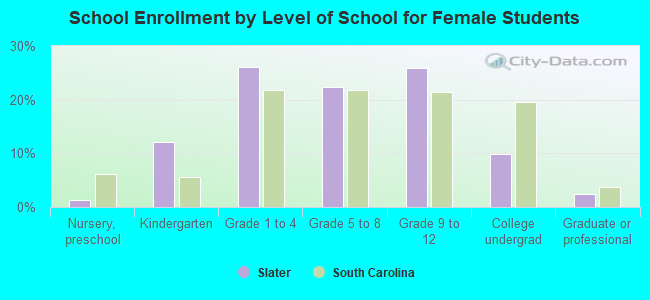
Private vs. public school enrollment:
| Here: | 5.3% |
| South Carolina: | 9.2% |
| Here: | 4.8% |
| South Carolina: | 8.1% |
| Here: | 13.2% |
| South Carolina: | 20.3% |