Smithfield, NC (North Carolina) Houses and Residents
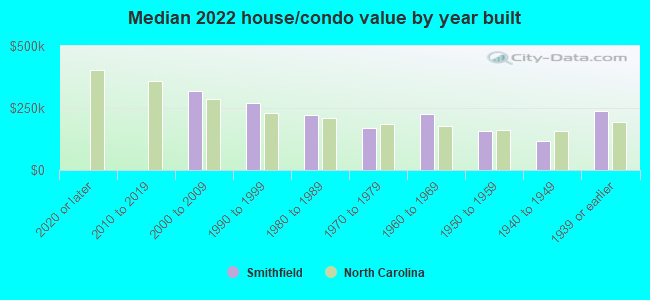
| Smithfield: | $231,825 |
| North Carolina: | $280,600 |
Total population: 11,735 (Urban population: 11,041 (all inside urban clusters), Rural population: 377 (all nonfarm))
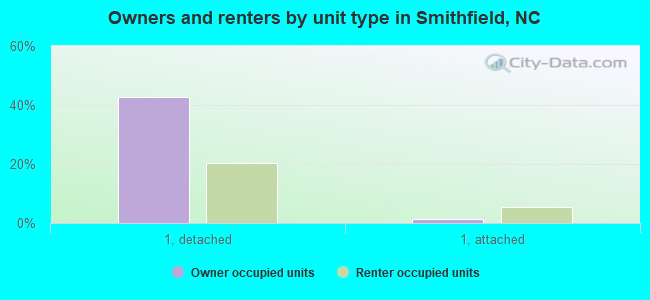
Houses: 5,700 (4,872 occupied: 2,403 owner occupied, 2,492 renter occupied)
| % of renters here: | 51% |
| State: | 33% |
Housing density: 499 houses/condos per square mile
Median price asked for vacant for-sale houses and condos in 2022: $188,202.
Median contract rent in 2022: $581 (lower quartile is $343, upper quartile is $929)
Median rent asked for vacant for-rent units in 2022: $320
Median gross rent in Smithfield, NC in 2022: $665
Housing units in Smithfield with a mortgage: 1,643 (81 second mortgage, 13 home equity loan, 72 both second mortgage and home equity loan)
Houses without a mortgage: 11
Median household income for houses/condos with a mortgage: $74,552
Median household income for apartments without a mortgage: $62,609
Median monthly housing costs: $888
Compare current foreclosures in Smithfield, NC:
| Photo | Address | Area | Beds / Baths | Price | Details |
|---|---|---|---|---|---|

|
#1
Eli Olive Rd
Smithfield, NC 27577
|
1,991 sq. feet
|
2 baths 3 beds |
show details | |

|
#2
Watersedge Ln
Smithfield, NC 27577
|
1,662 sq. feet
|
2 baths 3 beds |
show details | |

|
#3
Riverdale Cir
Smithfield, NC 27577
|
1,212 sq. feet
|
2 baths 3 beds |
show details | |

|
#4
Ogburn Rd
Smithfield, NC 27577
|
1,456 sq. feet
|
2 baths 3 beds |
show details | |

|
#5
S 1st St
Smithfield, NC 27577
|
2,024 sq. feet
|
2 baths 3 beds |
show details | |

|
#6
White Oak Dr
Smithfield, NC 27577
|
1,502 sq. feet
|
2 baths 3 beds |
show details | |

|
#7
S 1st St
Smithfield, NC 27577
|
1,291 sq. feet
|
1 baths 3 beds |
show details | |

|
#8
Whitley Dr
Smithfield, NC 27577
|
1,565 sq. feet
|
1 baths 3 beds |
show details | |

|
#9
Millard Dr
Smithfield, NC 27577
|
2,050 sq. feet
|
2 baths 3 beds |
show details | |

|
#10
Hancock St
Smithfield, NC 27577
|
1,805 sq. feet
|
2 baths 3 beds |
show details |
| Photo | Address | Area | Beds / Baths | Price | Details |
|---|---|---|---|---|---|

|
#11
Clear Water Dr
Smithfield, NC 27577
|
1,292 sq. feet
|
2 baths 3 beds |
show details | |

|
#12
Fuller St
Smithfield, NC 27577
|
1,056 sq. feet
|
1 baths 3 beds |
show details | |

|
#13
Runneymede Pl
Smithfield, NC 27577
|
1,272 sq. feet
|
2 baths 3 beds |
show details | |

|
#14
S Crescent Dr
Smithfield, NC 27577
|
1,040 sq. feet
|
1 baths 3 beds |
show details | |

|
#15
Nc Highway 210
Smithfield, NC 27577
|
800 sq. feet
|
2 baths 4 beds |
show details | |

|
#16
Nc Highway 210
Smithfield, NC 27577
|
1,368 sq. feet
|
2 baths 3 beds |
show details | |

|
#17
Brogden Rd
Smithfield, NC 27577
|
2,304 sq. feet
|
2 baths 4 beds |
show details | |

|
#18
Wildwood Ln
Smithfield, NC 27577
|
1,026 sq. feet
|
2 baths 3 beds |
show details | |

|
#19
N Lakeside Dr
Smithfield, NC 27577
|
1,763 sq. feet
|
2 baths 3 beds |
show details | |

|
#20
Brookside Dr
Smithfield, NC 27577
|
1,699 sq. feet
|
2 baths 3 beds |
show details |
| Photo | Address | Area | Beds / Baths | Price | Details |
|---|---|---|---|---|---|

|
#21
Stevens Chapel Rd
Smithfield, NC 27577
|
2,128 sq. feet
|
2 baths 4 beds |
show details | |

|
#22
Hunter Landing Dr
Smithfield, NC 27577
|
- sq. feet
|
- baths - beds |
show details | |

|
#23
Bakers Chapel Rd
Smithfield, NC 27577
|
- sq. feet
|
- baths - beds |
show details | |

|
#24
Wilsons Mills Rd
Smithfield, NC 27577
|
- sq. feet
|
- baths - beds |
show details | |

|
#25
Mccullers St
Smithfield, NC 27577
|
- sq. feet
|
- baths - beds |
show details | |

|
#26
E Church St
Smithfield, NC 27577
|
- sq. feet
|
- baths - beds |
show details | |

|
#27
Cleveland Rd
Smithfield, NC 27577
|
- sq. feet
|
- baths - beds |
show details | |

|
#28
Jade St
Smithfield, NC 27577
|
- sq. feet
|
- baths - beds |
show details | |

|
#29
Snowy Orchid Ln
Smithfield, NC 27577
|
- sq. feet
|
- baths - beds |
show details | |

|
#30
S 3rd St Apt 217
Smithfield, NC 27577
|
- sq. feet
|
- baths - beds |
show details |
| Photo | Address | Area | Beds / Baths | Price | Details |
|---|---|---|---|---|---|

|
#31
Long Grass Dr
Smithfield, NC 27577
|
- sq. feet
|
- baths - beds |
show details | |

|
#32
Hickory Nut Dr
Smithfield, NC 27577
|
- sq. feet
|
- baths - beds |
show details | |

|
#33
Kay Dr
Smithfield, NC 27577
|
- sq. feet
|
- baths - beds |
show details | |

|
#34
Smith Rd
Smithfield, NC 27577
|
- sq. feet
|
- baths - beds |
show details | |

|
Check over 1 million property listings on Foreclosure.com!
|
browse all offers | |||

Latest news about housing in Smithfield, NC collected exclusively by city-data.com from local newspapers, TV, and radio stations

 | Just b/c I heart these kinda topics… Has Clayton become the flagship town in Johnston County, overtaking Smithfield?! (13 replies) |
| Smithfield, NC Area (18 replies) |
| Smithfield, NC (17 replies) |
| Rental apartments in the Willow Spring area? (3 replies) |
| Any decent subsidized housing for low-income seniors in the area? (4 replies) |
| Reasonably priced suburbs of Raleigh/Durham? (23 replies) |

Median year apartment built: 1981
Household type by relationship:
Households: 12,355- Male householders: 2,309 (989 living alone), Female householders: 2,539 (987 living alone)
1,614 spouses (1,614 opposite-sex spouses), 393 unmarried partners, (369 opposite-sex unmarried partners), 3,409 children (3,105 natural, 109 adopted, 195 stepchildren), 323 grandchildren, 87 brothers or sisters, 126 parents, 0 foster children, 173 other relatives, 677 non-relatives
- In group quarters: 699
Size of family households: 1,360 2-persons, 465 3-persons, 433 4-persons, 322 5-persons, 28 6-persons, 133 7-or-more-persons.
Size of nonfamily households: 1,719 1-person, 219 2-persons, 23 3-persons.
1,135 married couples with children.
1,426 single-parent households (518 men, 908 women).
84.3% of residents of Smithfield speak English at home.
15.1% of residents speak Spanish at home (61% speak English very well, 7% speak English well, 16% speak English not well, 16% don't speak English at all).
0.5% of residents speak Asian or Pacific Island language at home (18% speak English very well, 20% speak English well, 63% speak English not well).
Foreign born population: 1,222 (9.9%)
(32.6% of them are naturalized citizens)
| Here: | 6.7 |
| State: | 6.4 |
| Here: | 4.4 |
| State: | 4.4 |
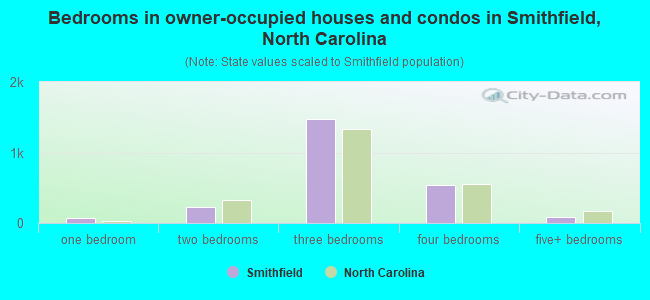
- Bedrooms in owner-occupied houses and condos in Smithfield, North Carolina
- 6no bedroom
- 771 bedroom
- 2202 bedrooms
- 1,4813 bedrooms
- 5404 bedrooms
- 795+ bedrooms
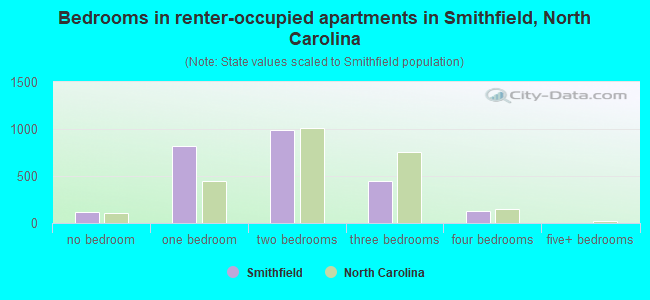
- Bedrooms in renter-occupied apartments in Smithfield, North Carolina
- 120no bedroom
- 8141 bedroom
- 9912 bedrooms
- 4423 bedrooms
- 1264 bedrooms
- 05+ bedrooms
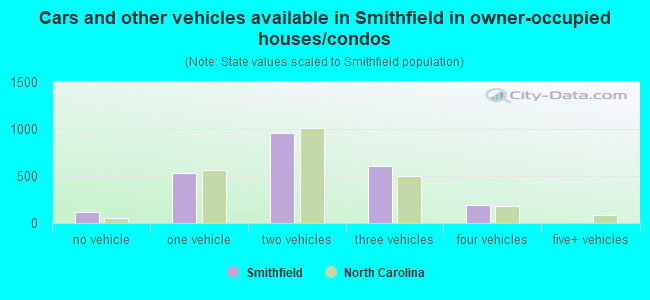
- Cars and other vehicles available in Smithfield in owner-occupied houses/condos
- 113no vehicle
- 5331 vehicle
- 9562 vehicles
- 6083 vehicles
- 1944 vehicles
- 05+ vehicles
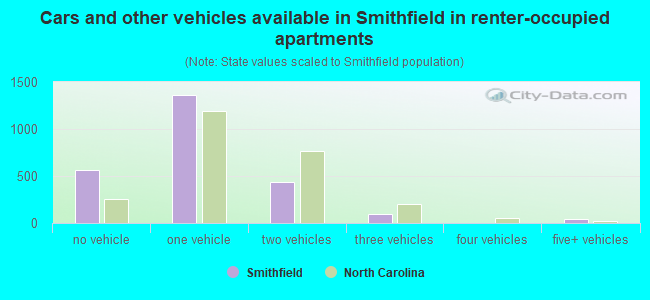
- Cars and other vehicles available in Smithfield in renter-occupied apartments
- 566no vehicle
- 1,3621 vehicle
- 4322 vehicles
- 933 vehicles
- 04 vehicles
- 395+ vehicles
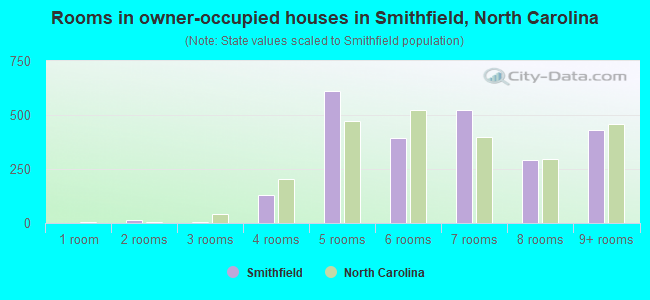
- Rooms in owner-occupied houses in Smithfield, North Carolina
- 01 room
- 162 rooms
- 63 rooms
- 1294 rooms
- 6105 rooms
- 3936 rooms
- 5247 rooms
- 2938 rooms
- 4329+ rooms
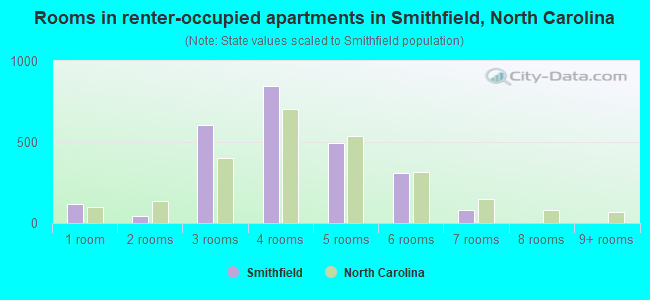
- Rooms in renter-occupied apartments in Smithfield, North Carolina
- 1201 room
- 422 rooms
- 6033 rooms
- 8454 rooms
- 4955 rooms
- 3076 rooms
- 807 rooms
- 08 rooms
- 09+ rooms
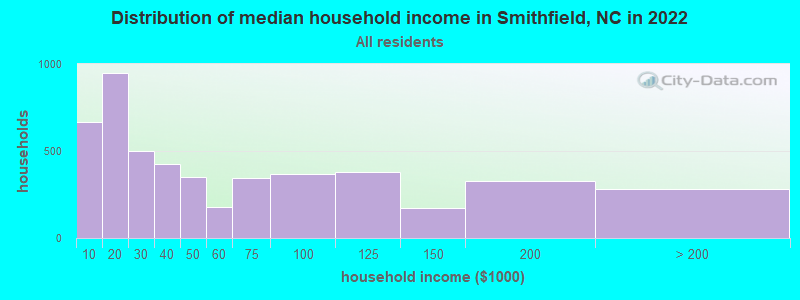
Smithfield, NC household income distribution

- 666Less than $10,000
- 947$10,000 to $19,999
- 501$20,000 to $29,999
- 426$30,000 to $39,999
- 352$40,000 to $49,999
- 176$50,000 to $59,999
- 343$60,000 to $74,999
- 367$75,000 to $99,999
- 380$100,000 to $124,999
- 172$125,000 to $149,999
- 327$150,000 to $199,999
- 282$200,000 or more
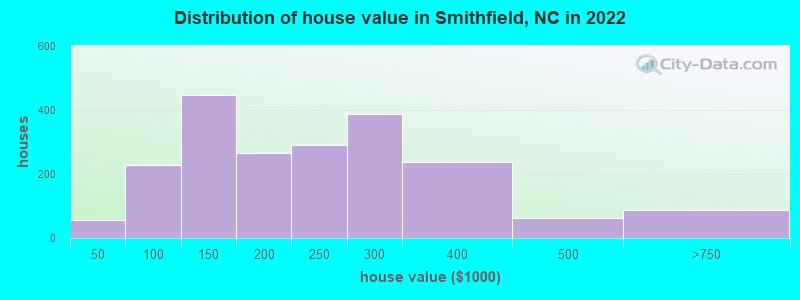
Home value of owner - occupied houses in 2022 in Smithfield, NC
-
- 19Less than $10,000
- 16$15,000 to $19,999
- 20$25,000 to $29,999
- 24$50,000 to $59,999
- 50$60,000 to $69,999
- 20$70,000 to $79,999
- 92$80,000 to $89,999
- 42$90,000 to $99,999
- 331$100,000 to $124,999
- 114$125,000 to $149,999
- 130$150,000 to $174,999
- 134$175,000 to $199,999
- 290$200,000 to $249,999
- 387$250,000 to $299,999
- 238$300,000 to $399,999
- 63$400,000 to $499,999
- 86$500,000 to $749,999
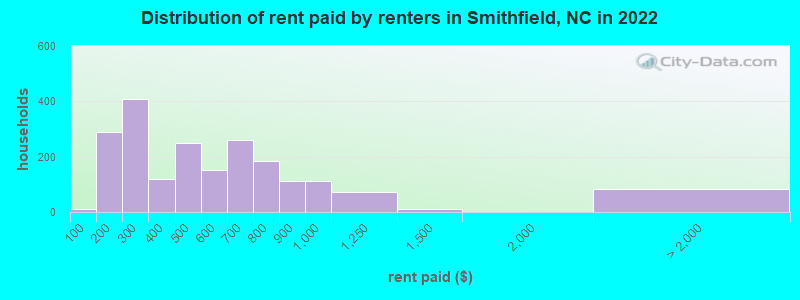
Rent paid by renters in 2022 in Smithfield, NC
-
- 10Less than $100
- 18$100 to $149
- 270$150 to $199
- 281$200 to $249
- 125$250 to $299
- 43$300 to $349
- 75$350 to $399
- 83$400 to $449
- 164$450 to $499
- 82$500 to $549
- 69$550 to $599
- 97$600 to $649
- 164$650 to $699
- 35$700 to $749
- 150$750 to $799
- 110$800 to $899
- 113$900 to $999
- 73$1,000 to $1,249
- 11$1,250 to $1,499
- 8$2,000 to $2,499
- 73No cash rent
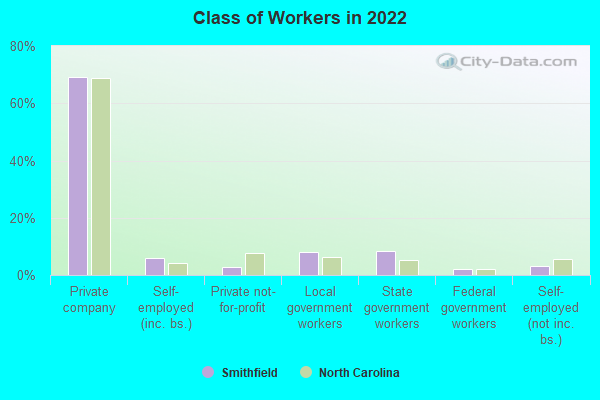
Percentage of workers working in this county: 68.4%
Number of people working at home: 260 (6.0% of all workers)
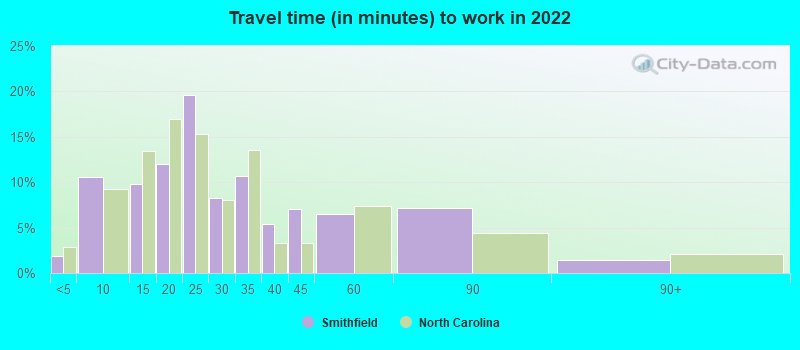
Travel time to work (commute)
- Less than 5 minutes: 216
- 5 to 9 minutes: 797
- 10 to 14 minutes: 496
- 15 to 19 minutes: 393
- 20 to 24 minutes: 491
- 25 to 29 minutes: 39
- 30 to 34 minutes: 443
- 35 to 39 minutes: 55
- 40 to 44 minutes: 59
- 45 to 59 minutes: 463
- 60 to 89 minutes: 596
- 90 or more minutes: 6
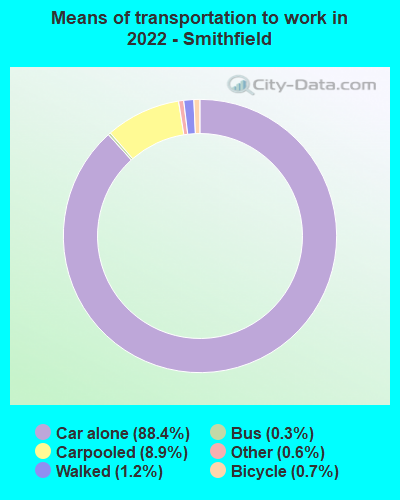
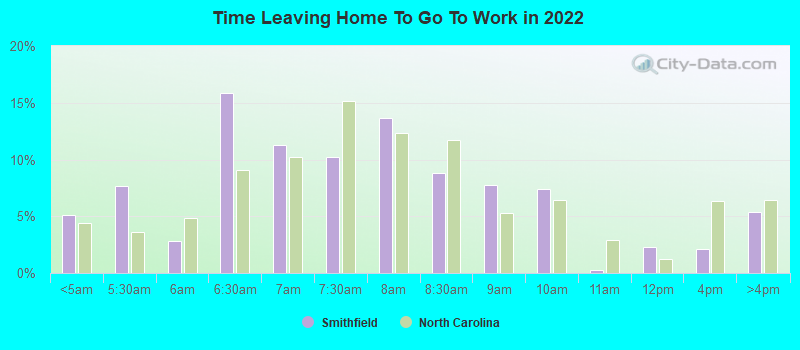
Means of transportation to work:
- Drove a car alone: 10,201 (82.3%)
- Carpooled: 1,068 (8.6%)
- Bus: 25 (0.2%)
- Taxi: 66 (0.5%)
- Bicycle: 88 (0.7%)
- Walked: 147 (1.2%)
- Worked at home: 260 (2.1%)
- Unemployment by race in 2022
- Unemployment rate for White non-Hispanic residents
- 4.8%Males
- 1.5%Females
- Unemployment rate for Black residents
- 4.0%Males
- 15.1%Females
- Unemployment rate for Hispanic or Latino residents
- 1.0%Males
- 8.5%Females
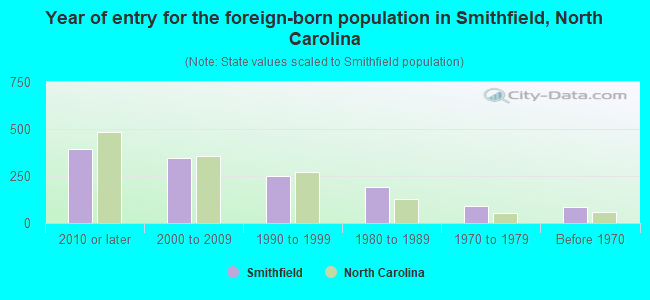
- Year of entry for the foreign-born population in Smithfield, North Carolina
- 3932010 or later
- 3442000 to 2009
- 2501990 to 1999
- 1901980 to 1989
- 901970 to 1979
- 84Before 1970
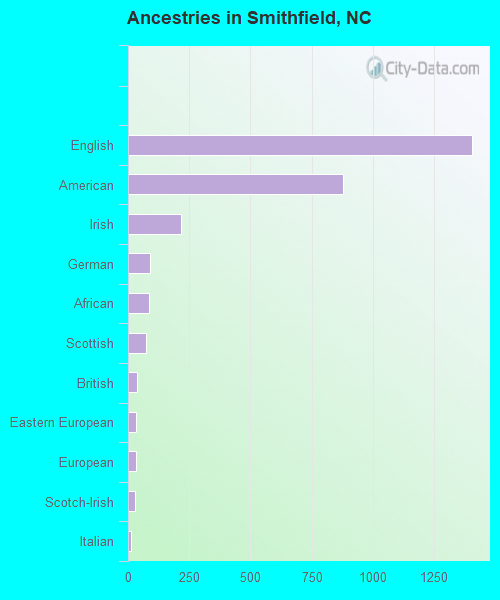
First ancestries reported:
- English: 1,405 (20.0%)
- American: 878 (12.5%)
- Irish: 215 (3.1%)
- German: 91 (1.3%)
- African: 87 (1.2%)
- Scottish: 73 (1.0%)
- British: 36 (0.5%)
- Eastern European: 34 (0.5%)
- European: 32 (0.5%)
- Scotch-Irish: 28 (0.4%)
- Italian: 14 (0.2%)
- Belgian: 9 (0.1%)
- French: 8 (0.1%)
- Polish: 7 (0.10%)
- Swedish: 6 (0.09%)
- Barbadian: 4 (0.06%)
Most common places of birth for foreign-born residents (%):
| Smithfield: | 33.6% (369) |
| North Carolina: | 4.7% (40,707) |
| Smithfield: | 25.0% (275) |
| North Carolina: | 24.7% (214,776) |
| Smithfield: | 10.6% (116) |
| North Carolina: | 2.6% (22,964) |
| Smithfield: | 5.5% (60) |
| North Carolina: | 1.0% (9,005) |
| Smithfield: | 4.9% (54) |
| North Carolina: | 1.8% (15,988) |
| Smithfield: | 4.5% (49) |
| North Carolina: | 1.7% (15,135) |
| Smithfield: | 3.8% (42) |
| North Carolina: | 3.2% (27,477) |
| Smithfield: | 3.3% (36) |
| North Carolina: | 2.4% (20,695) |
| Smithfield: | 2.7% (30) |
| North Carolina: | 2.1% (18,275) |
| Smithfield: | 2.5% (27) |
| North Carolina: | 0.1% (998) |
Place of birth for U.S.-born residents:
- This state: 8,298
- Other state: 2,833
- Northeast: 804
- Midwest: 192
- South: 1,615
- West: 169
91.5% of Smithfield residents lived in the same house 1 years ago.
Out of people who lived in different houses, 30.5% lived in this county.
Out of people who lived in different counties, 67.5% lived in North Carolina.
| Smithfield: | 91.5% |
| State average: | 87.3% |
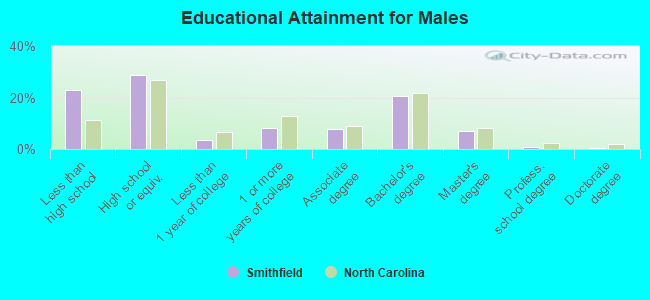
Education attainment for males 25 years and older:
- No schooling: 40
- Nursery to 4th grade: 32
- 5th and 6th grade: 270
- 7th and 8th grade: 231
- 9th grade: 131
- 10th grade: 162
- 11th grade: 30
- 12th grade, no diploma: 129
- High school graduate (or equivalency): 1,273
- Less than 1 year of college: 153
- Some college more than 1 year, no degree: 368
- Associate degree: 350
- Bachelor's degree: 913
- Master's degree: 305
- Professional school degree: 28
- Doctorate degree: 22
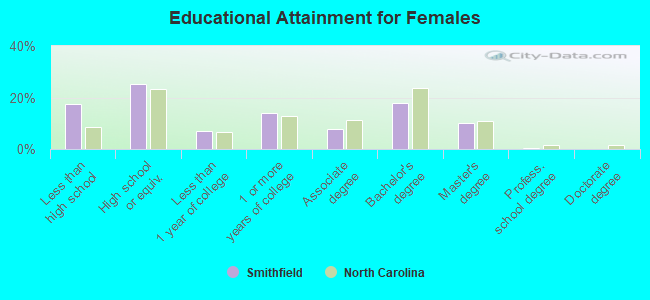
Education attainment for females 25 years and older:
- No schooling: 164
- Nursery to 4th grade: 44
- 5th and 6th grade: 172
- 7th and 8th grade: 41
- 9th grade: 122
- 10th grade: 87
- 11th grade: 48
- 12th grade, no diploma: 56
- High school graduate (or equivalency): 1,067
- Less than 1 year of college: 303
- Some college more than 1 year, no degree: 585
- Associate degree: 330
- Bachelor's degree: 759
- Master's degree: 423
- Professional school degree: 19
- Doctorate degree: 0


Housing units in structures:
- One, detached: 3,407
- One, attached: 344
- Two: 268
- 3 or 4: 352
- 5 to 9: 197
- 10 to 19: 120
- 20 to 49: 634
- 50 or more: 33
- Mobile homes: 342
Median worth of mobile homes: $119,967
Housing units lacking complete kitchen facilities in 2022: 1.8%
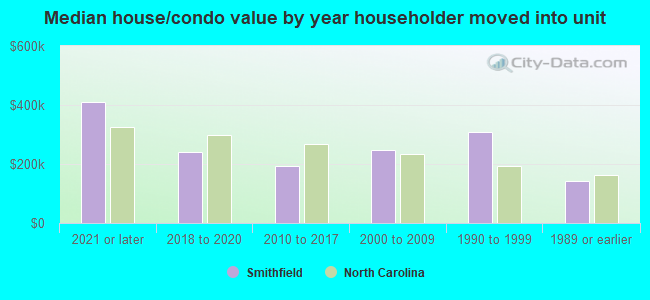
House/condo owner moved in on average 13 years ago
Renter moved in on average 5 years ago
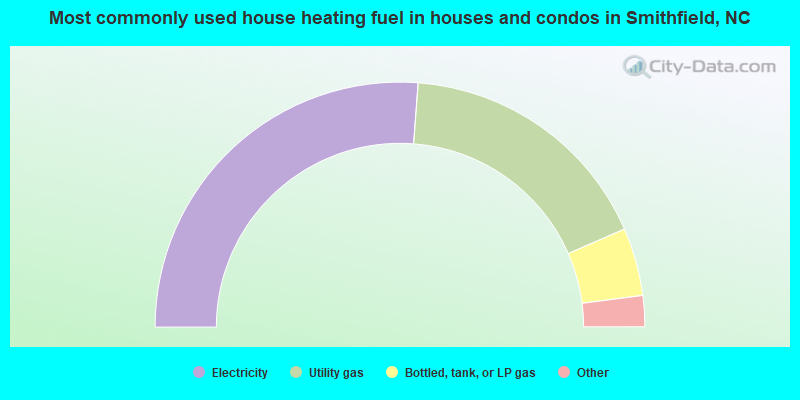
- 52.5%Electricity
- 34.6%Utility gas
- 9.0%Bottled, tank, or LP gas
- 2.5%Fuel oil, kerosene, etc.
- 0.8%No fuel used
- 0.7%Wood
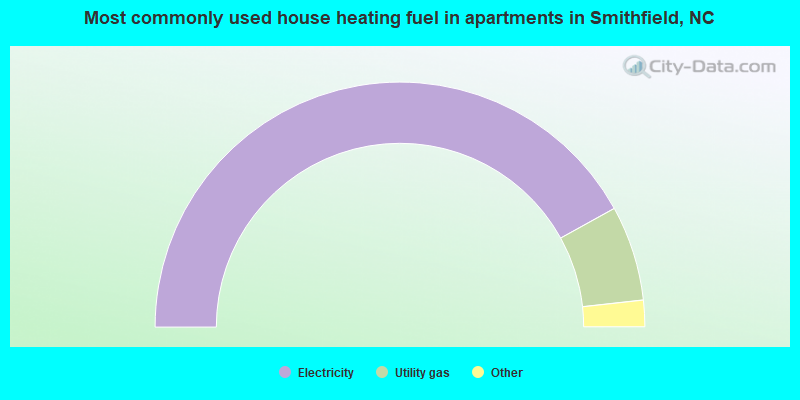
- 84.0%Electricity
- 12.6%Utility gas
- 3.0%Bottled, tank, or LP gas
- 0.4%No fuel used
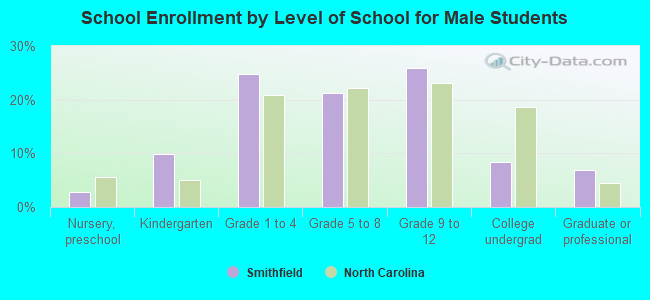
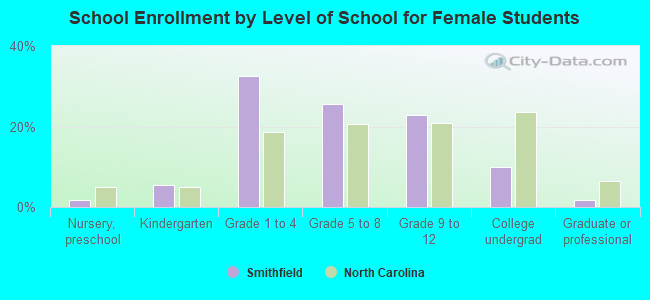
Private vs. public school enrollment:
| Here: | 1.3% |
| North Carolina: | 13.8% |
| Here: | 0.9% |
| North Carolina: | 11.9% |
| Here: | 40.7% |
| North Carolina: | 19.3% |