Solon, IA (Iowa) Houses and Residents
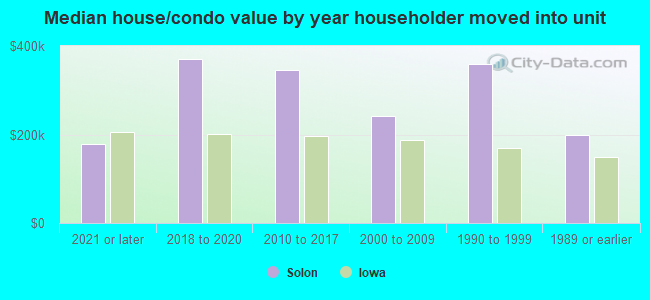
| Solon: | $290,310 |
| Iowa: | $194,600 |
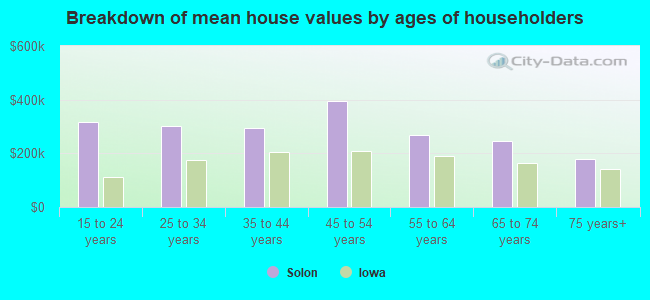
Mean price in 2022:
Detached houses: $500,089
Here: $500,089 State: $245,224 Townhouses or other attached units: $274,003
Here: $274,003 State: $238,767 In 5-or-more-unit structures: $214,525
Here: $214,525 State: $190,519
Total population: 2,396 (Urban population: 0, Rural population: 1,172 (all nonfarm))
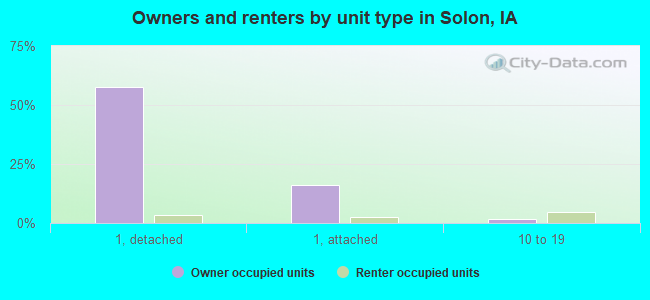
Houses: 1,083 (1,065 occupied: 881 owner occupied, 184 renter occupied)
| % of renters here: | 17% |
| State: | 28% |
Housing density: 816 houses/condos per square mile
Median price asked for vacant for-sale houses and condos in 2022 in this county: $241,383.
Median contract rent in 2022: $981 (lower quartile is $785, upper quartile is $1,213)
Median rent asked for vacant for-rent units in 2022: $1,328
Median gross rent in Solon, IA in 2022: $1,102
Housing units in Solon with a mortgage: 579 (102 second mortgage, 18 home equity loan, 82 both second mortgage and home equity loan)
Houses without a mortgage: 0
Median household income for houses/condos with a mortgage: $130,666
Median household income for apartments without a mortgage: $73,966
Median monthly housing costs: $1,332
Compare current foreclosures near Solon, IA:
| Photo | Address | Area | Beds / Baths | Price | Details |
|---|---|---|---|---|---|

|
#1
Crest View Rd NE
Solon, IA 52333
|
3,513 sq. feet
|
5 baths 4 beds |
show details | |

|
#2
Newberry Ave NE
Solon, IA 52333
|
1,564 sq. feet
|
3 baths 4 beds |
show details | |

|
#3
14th Ave SW
Cedar Rapids, IA 52404
|
844 sq. feet
|
1 baths 2 beds |
$124,900
|
show details |

|
#4
24th St NW
Cedar Rapids, IA 52405
|
1,064 sq. feet
|
1 baths 2 beds |
show details | |

|
#5
Sw7th St
Cedar Rapids, IA 52404
|
1,346 sq. feet
|
1 baths 3 beds |
show details | |

|
#6
Grande Ave SE
Cedar Rapids, IA 52403
|
2,086 sq. feet
|
3 baths 3 beds |
show details | |

|
#7
Mallory St SW
Cedar Rapids, IA 52404
|
1,969 sq. feet
|
1 baths 2 beds |
show details | |

|
#8
Bolton St
Springville, IA 52336
|
1,354 sq. feet
|
1 baths 2 beds |
show details | |

|
#9
C Ave NW
Cedar Rapids, IA 52405
|
596 sq. feet
|
1 baths 2 beds |
show details | |

|
#10
Sunrise Dr
Ely, IA 52227
|
1,606 sq. feet
|
3 baths 3 beds |
show details |
| Photo | Address | Area | Beds / Baths | Price | Details |
|---|---|---|---|---|---|

|
#11
9th Ave
Marion, IA 52302
|
1,543 sq. feet
|
1 baths 3 beds |
show details | |

|
#12
6th Ave SW
Cedar Rapids, IA 52404
|
616 sq. feet
|
2 baths 3 beds |
show details | |

|
#13
11th St NW
Cedar Rapids, IA 52405
|
616 sq. feet
|
1 baths 3 beds |
show details | |

|
#14
Diamond Ln
Cedar Rapids, IA 52403
|
4,222 sq. feet
|
5 baths 3 beds |
show details | |

|
#15
B Ave NW
Cedar Rapids, IA 52405
|
572 sq. feet
|
1 baths 3 beds |
show details | |

|
#16
B Ave NE
Cedar Rapids, IA 52402
|
1,046 sq. feet
|
2 baths 4 beds |
show details | |

|
#17
Hughes Dr SW
Cedar Rapids, IA 52404
|
1,292 sq. feet
|
1 baths 4 beds |
show details | |

|
#18
11th St SW
Cedar Rapids, IA 52404
|
850 sq. feet
|
1 baths 2 beds |
show details | |

|
#19
Bramble Rd SW
Cedar Rapids, IA 52404
|
894 sq. feet
|
1 baths 4 beds |
show details | |

|
#20
King Dr SW
Cedar Rapids, IA 52404
|
1,272 sq. feet
|
3 baths 4 beds |
show details |
| Photo | Address | Area | Beds / Baths | Price | Details |
|---|---|---|---|---|---|

|
#21
7th St SW
Cedar Rapids, IA 52404
|
792 sq. feet
|
1 baths 4 beds |
show details | |

|
#22
7th St SW
Cedar Rapids, IA 52404
|
612 sq. feet
|
1 baths 2 beds |
show details | |

|
#23
Park Ave SE
Cedar Rapids, IA 52403
|
572 sq. feet
|
1 baths 2 beds |
show details | |

|
#24
Texas Ave NE
Cedar Rapids, IA 52402
|
1,040 sq. feet
|
1 baths 3 beds |
show details | |

|
#25
18th St SE
Cedar Rapids, IA 52403
|
732 sq. feet
|
1 baths 4 beds |
show details | |

|
#26
F Ave NW
Cedar Rapids, IA 52405
|
581 sq. feet
|
2 baths 5 beds |
show details | |

|
#27
15th Ave SW
Cedar Rapids, IA 52404
|
640 sq. feet
|
1 baths 3 beds |
show details | |

|
#28
Clifton St NE
Cedar Rapids, IA 52402
|
1,016 sq. feet
|
1 baths 3 beds |
show details | |

|
#29
5th Ave SE
Cedar Rapids, IA 52403
|
728 sq. feet
|
1 baths 3 beds |
show details | |

|
#30
15th St SE
Cedar Rapids, IA 52403
|
576 sq. feet
|
1 baths 2 beds |
show details |
| Photo | Address | Area | Beds / Baths | Price | Details |
|---|---|---|---|---|---|

|
#31
Bealer Ct SE
Cedar Rapids, IA 52401
|
722 sq. feet
|
1 baths 3 beds |
show details | |

|
#32
5th St SE
Cedar Rapids, IA 52401
|
616 sq. feet
|
1 baths 2 beds |
show details | |

|
#33
10th Ave SE
Cedar Rapids, IA 52401
|
916 sq. feet
|
1 baths 2 beds |
show details | |

|
#34
21st Ave SW
Cedar Rapids, IA 52404
|
624 sq. feet
|
1 baths 4 beds |
show details | |

|
#35
Orchard Dr NW
Cedar Rapids, IA 52405
|
1,240 sq. feet
|
1 baths 5 beds |
show details | |

|
#36
140th St NW
Swisher, IA 52338
|
1,464 sq. feet
|
1 baths 3 beds |
show details | |

|
#37
Mount Vernon Rd SE
Cedar Rapids, IA 52403
|
672 sq. feet
|
1 baths 3 beds |
show details | |

|
#38
Americus Dr SE
Cedar Rapids, IA 52403
|
940 sq. feet
|
1 baths 2 beds |
show details | |

|
#39
24th Street Dr SE
Cedar Rapids, IA 52403
|
1,076 sq. feet
|
1 baths 2 beds |
show details | |

|
#40
Pleasantview Dr
Marion, IA 52302
|
1,962 sq. feet
|
3 baths 3 beds |
show details |
| Photo | Address | Area | Beds / Baths | Price | Details |
|---|---|---|---|---|---|

|
#41
Richmond Rd NE
Cedar Rapids, IA 52402
|
960 sq. feet
|
1 baths 3 beds |
show details | |

|
#42
Boice Rd NW
Cedar Rapids, IA 52405
|
1,168 sq. feet
|
2 baths 3 beds |
show details | |

|
#43
25th St
Marion, IA 52302
|
960 sq. feet
|
1 baths 3 beds |
show details | |

|
#44
14th Ave
Marion, IA 52302
|
1,750 sq. feet
|
1 baths 3 beds |
show details | |

|
#45
Kelso Ln
Fairfax, IA 52228
|
1,378 sq. feet
|
2 baths 3 beds |
show details | |

|
#46
E Ave NW
Cedar Rapids, IA 52405
|
975 sq. feet
|
2 baths 2 beds |
show details | |

|
#47
Hidden Hollow Ln NW
Cedar Rapids, IA 52405
|
1,196 sq. feet
|
3 baths 3 beds |
show details | |

|
#48
10th St
Marion, IA 52302
|
2,014 sq. feet
|
2 baths 5 beds |
show details | |

|
#49
1st Ave Sw, Apt 6
Cedar Rapids, IA 52405
|
900 sq. feet
|
1 baths 2 beds |
show details | |

|
Check over 1 million property listings on Foreclosure.com!
|
browse all offers | |||

Latest news about housing in Solon, IA collected exclusively by city-data.com from local newspapers, TV, and radio stations

 | Farm/Country-style house rental near Iowa City (7 replies) |
| Affordable housing for first time homebuyer? (11 replies) |
| Relocating to Iowa City next year (3 replies) |
| Country living for Grad Student (4 replies) |
| Ely, Solon, Swisher or North Liberty? (1 reply) |
| what about solon? (10 replies) |

Median year apartment built: 2005
Household type by relationship:
Households: 3,080- Male householders: 332 (42 living alone), Female householders: 722 (243 living alone)
570 spouses (570 opposite-sex spouses), 48 unmarried partners, (48 opposite-sex unmarried partners), 1,128 children (1,067 natural, 40 adopted, 19 stepchildren), 49 grandchildren, 0 brothers or sisters, 17 parents, 0 foster children, 34 other relatives, 90 non-relatives
- In group quarters: 85
Size of family households: 212 2-persons, 183 3-persons, 202 4-persons, 50 5-persons, 19 6-persons, 18 7-or-more-persons.
Size of nonfamily households: 341 1-person, 16 2-persons, 4 3-persons.
543 married couples with children.
371 single-parent households (184 men, 187 women).
97.8% of residents of Solon speak English at home.
1.6% of residents speak Spanish at home (71% speak English very well, 4% speak English well, 13% speak English not well, 11% don't speak English at all).
0.3% of residents speak other Indo-European language at home (100% speak English very well).
Foreign born population: 8 (0.3%)
(150.0% of them are naturalized citizens)
| Here: | 7.0 |
| State: | 6.8 |
| Here: | 4.1 |
| State: | 4.2 |
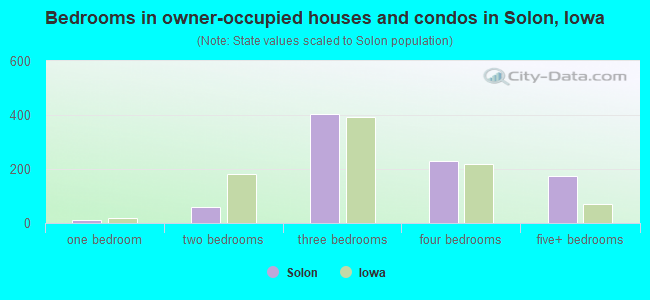
- Bedrooms in owner-occupied houses and condos in Solon, Iowa
- 0no bedroom
- 111 bedroom
- 612 bedrooms
- 4033 bedrooms
- 2314 bedrooms
- 1755+ bedrooms
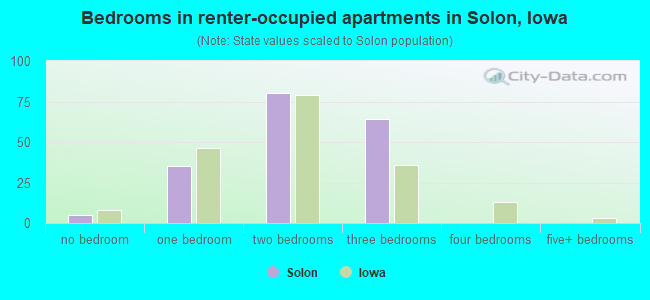
- Bedrooms in renter-occupied apartments in Solon, Iowa
- 5no bedroom
- 351 bedroom
- 802 bedrooms
- 643 bedrooms
- 04 bedrooms
- 05+ bedrooms
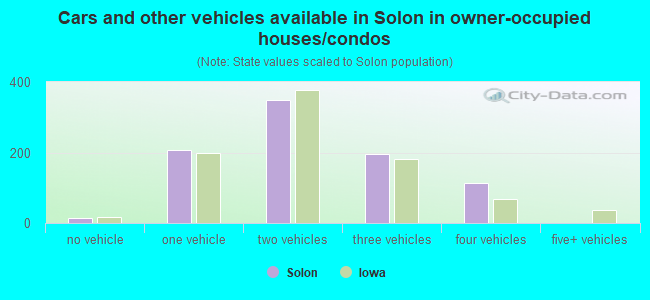
- Cars and other vehicles available in Solon in owner-occupied houses/condos
- 15no vehicle
- 2081 vehicle
- 3482 vehicles
- 1963 vehicles
- 1144 vehicles
- 05+ vehicles
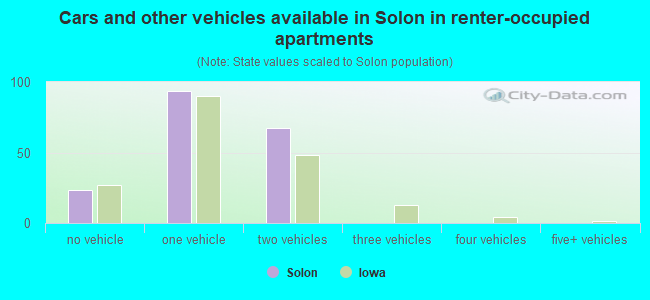
- Cars and other vehicles available in Solon in renter-occupied apartments
- 24no vehicle
- 941 vehicle
- 672 vehicles
- 03 vehicles
- 04 vehicles
- 05+ vehicles
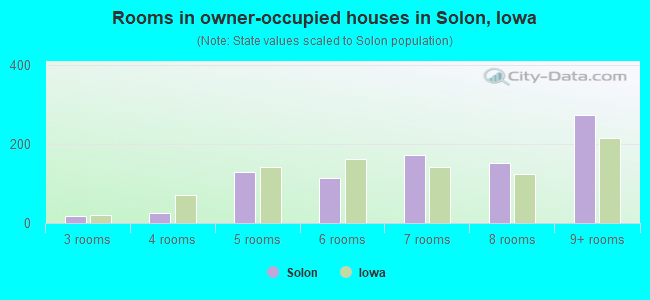
- Rooms in owner-occupied houses in Solon, Iowa
- 01 room
- 02 rooms
- 183 rooms
- 254 rooms
- 1295 rooms
- 1146 rooms
- 1717 rooms
- 1528 rooms
- 2739+ rooms
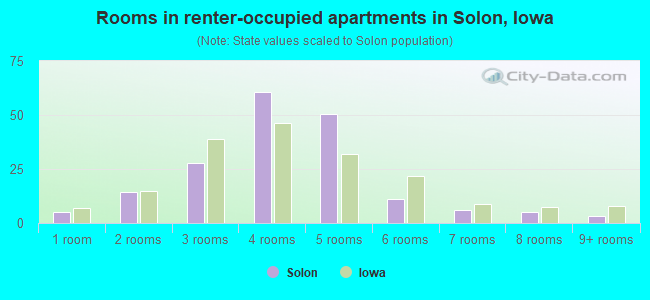
- Rooms in renter-occupied apartments in Solon, Iowa
- 51 room
- 142 rooms
- 283 rooms
- 614 rooms
- 515 rooms
- 116 rooms
- 67 rooms
- 58 rooms
- 39+ rooms
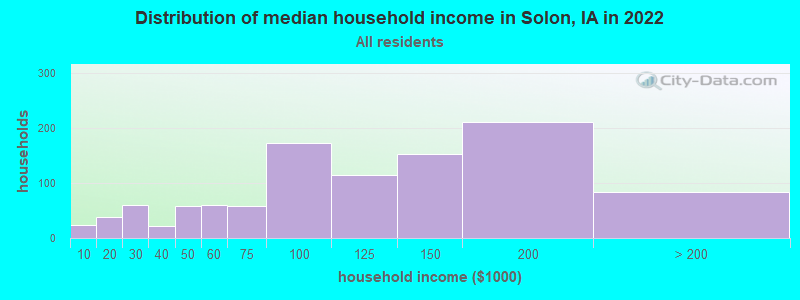
Solon, IA household income distribution

- 24Less than $10,000
- 39$10,000 to $19,999
- 60$20,000 to $29,999
- 22$30,000 to $39,999
- 59$40,000 to $49,999
- 60$50,000 to $59,999
- 59$60,000 to $74,999
- 172$75,000 to $99,999
- 115$100,000 to $124,999
- 153$125,000 to $149,999
- 211$150,000 to $199,999
- 84$200,000 or more
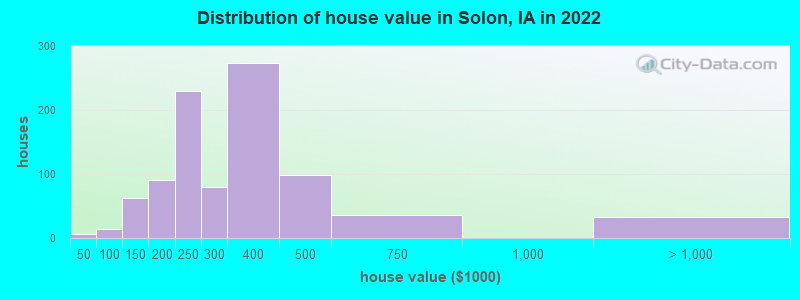
Home value of owner - occupied houses in 2022 in Solon, IA
-
- 7$15,000 to $19,999
- 5$60,000 to $69,999
- 6$70,000 to $79,999
- 2$80,000 to $89,999
- 17$100,000 to $124,999
- 44$125,000 to $149,999
- 40$150,000 to $174,999
- 49$175,000 to $199,999
- 229$200,000 to $249,999
- 79$250,000 to $299,999
- 273$300,000 to $399,999
- 97$400,000 to $499,999
- 35$500,000 to $749,999
- 10$1,000,000 to $1,499,999
- 22$2,000,000 or more
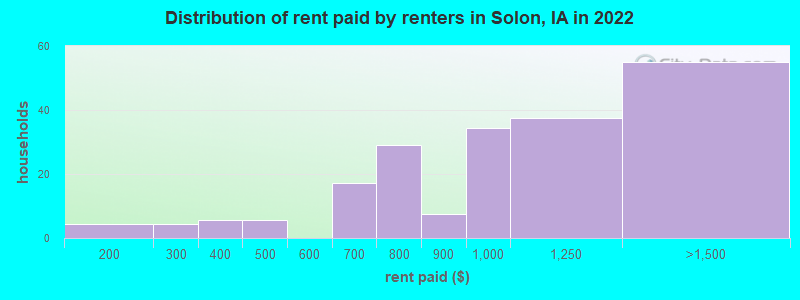
Rent paid by renters in 2022 in Solon, IA
-
- 4$150 to $199
- 4$250 to $299
- 2$300 to $349
- 3$350 to $399
- 5$450 to $499
- 8$600 to $649
- 8$650 to $699
- 1$700 to $749
- 27$750 to $799
- 7$800 to $899
- 34$900 to $999
- 37$1,000 to $1,249
- 55$1,250 to $1,499
Percentage of workers working in this county: 78.5%
Number of people working at home: 204 (12.3% of all workers)
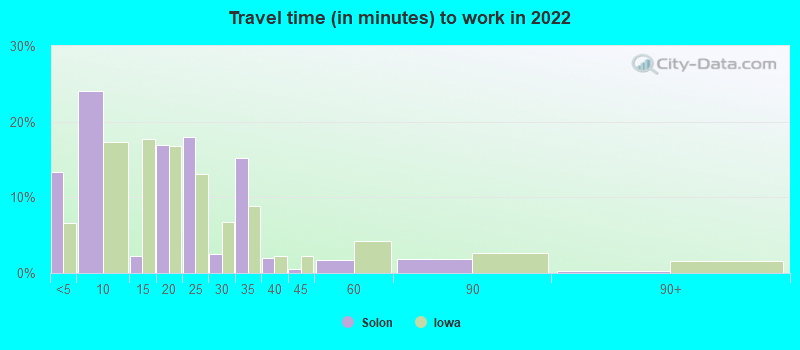
Travel time to work (commute)
- Less than 5 minutes: 208
- 5 to 9 minutes: 255
- 10 to 14 minutes: 76
- 15 to 19 minutes: 154
- 20 to 24 minutes: 366
- 25 to 29 minutes: 252
- 30 to 34 minutes: 148
- 35 to 39 minutes: 36
- 40 to 44 minutes: 0
- 45 to 59 minutes: 19
- 60 to 89 minutes: 24
- 90 or more minutes: 3
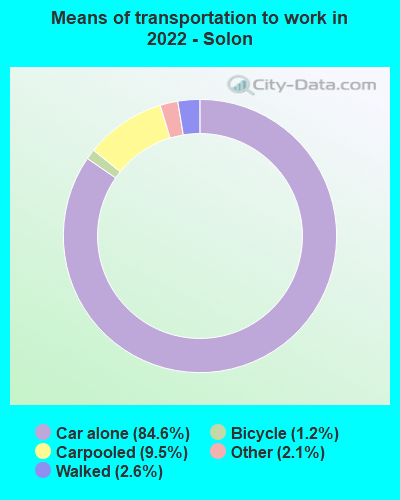
Means of transportation to work:
- Drove a car alone: 1,064 (71.4%)
- Carpooled: 128 (8.6%)
- Taxi: 16 (1.1%)
- Bicycle: 18 (1.2%)
- Walked: 38 (2.6%)
- Worked at home: 204 (13.7%)
- Unemployment by race in 2022
- Unemployment rate for White non-Hispanic residents
- 1.8%Males
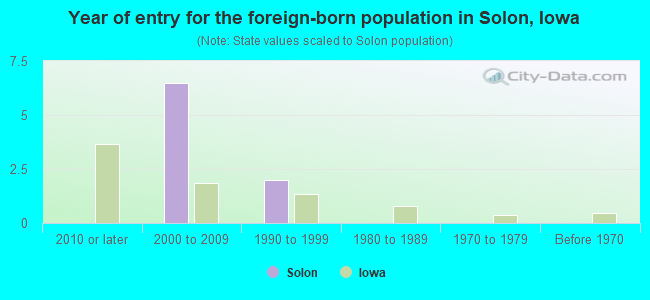
- Year of entry for the foreign-born population in Solon, Iowa
- 02010 or later
- 62000 to 2009
- 21990 to 1999
- 01980 to 1989
- 01970 to 1979
- 0Before 1970
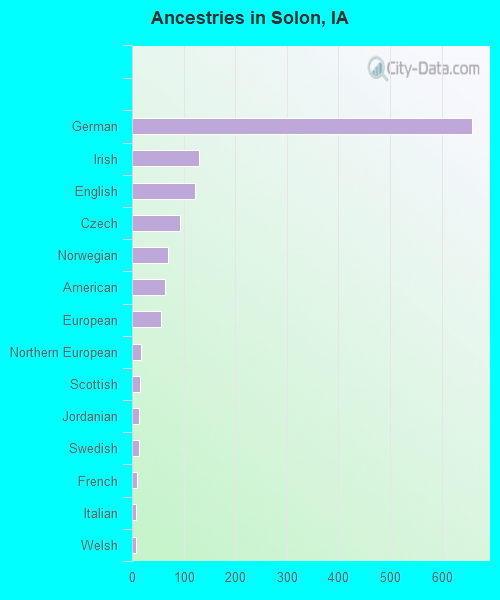
First ancestries reported:
- German: 659 (48.9%)
- Irish: 130 (9.6%)
- English: 123 (9.1%)
- Czech: 94 (7.0%)
- Norwegian: 69 (5.1%)
- American: 64 (4.7%)
- European: 56 (4.2%)
- Northern European: 18 (1.3%)
- Scottish: 16 (1.2%)
- Jordanian: 13 (1.0%)
- Swedish: 13 (1.0%)
- French: 9 (0.7%)
- Italian: 7 (0.5%)
- Welsh: 7 (0.5%)
- Russian: 5 (0.4%)
- Danish: 4 (0.3%)
- Scotch-Irish: 2 (0.1%)
Most common places of birth for foreign-born residents (%):
| Solon: | 88.9% (8) |
| Iowa: | 0.0% (67) |
| Solon: | 22.2% (2) |
| Iowa: | 0.2% (442) |
Place of birth for U.S.-born residents:
- This state: 2,662
- Other state: 464
- Northeast: 40
- Midwest: 331
- South: 16
- West: 54
90.6% of Solon residents lived in the same house 1 years ago.
Out of people who lived in different houses, 33.1% lived in this county.
Out of people who lived in different counties, 92.3% lived in Iowa.
| Solon: | 90.6% |
| State average: | 87.2% |
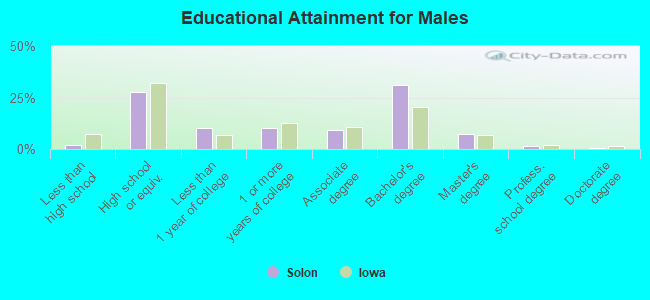
Education attainment for males 25 years and older:
- No schooling: 5
- Nursery to 4th grade: 0
- 5th and 6th grade: 0
- 7th and 8th grade: 0
- 9th grade: 0
- 10th grade: 0
- 11th grade: 0
- 12th grade, no diploma: 10
- High school graduate (or equivalency): 203
- Less than 1 year of college: 76
- Some college more than 1 year, no degree: 74
- Associate degree: 69
- Bachelor's degree: 229
- Master's degree: 52
- Professional school degree: 12
- Doctorate degree: 3
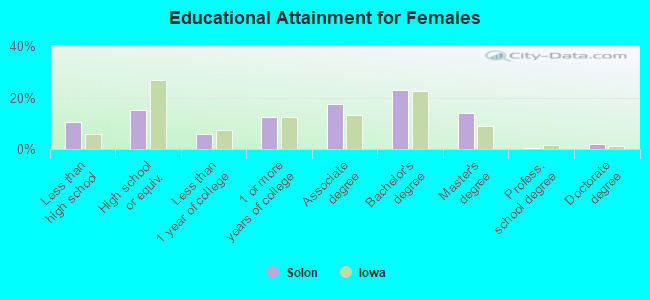
Education attainment for females 25 years and older:
- No schooling: 9
- Nursery to 4th grade: 0
- 5th and 6th grade: 0
- 7th and 8th grade: 17
- 9th grade: 0
- 10th grade: 34
- 11th grade: 39
- 12th grade, no diploma: 18
- High school graduate (or equivalency): 173
- Less than 1 year of college: 65
- Some college more than 1 year, no degree: 140
- Associate degree: 198
- Bachelor's degree: 259
- Master's degree: 157
- Professional school degree: 4
- Doctorate degree: 20


Housing units in structures:
- One, detached: 734
- One, attached: 208
- Two: 9
- 3 or 4: 25
- 5 to 9: 24
- 10 to 19: 77
- 20 to 49: 4
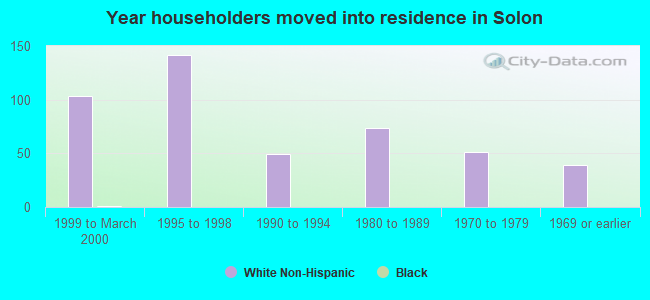
House/condo owner moved in on average 8 years ago
Renter moved in on average 4 years ago
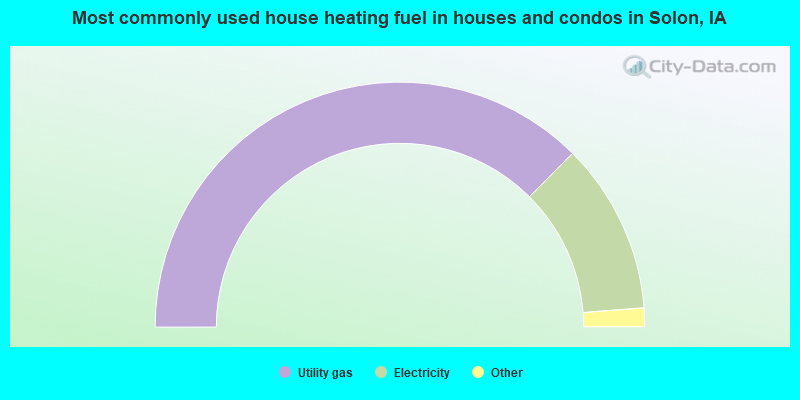
- 75.0%Utility gas
- 22.6%Electricity
- 0.9%Other fuel
- 0.6%Coal or coke
- 0.6%No fuel used
- 0.4%Bottled, tank, or LP gas
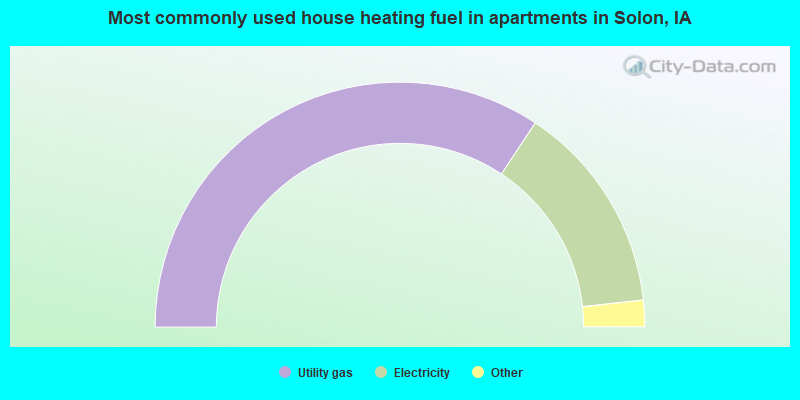
- 68.7%Utility gas
- 27.9%Electricity
- 2.2%Other fuel
- 1.1%Bottled, tank, or LP gas
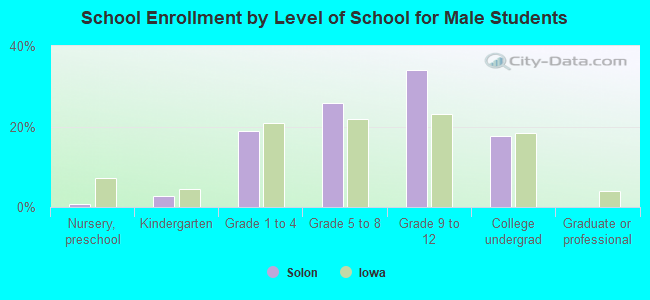
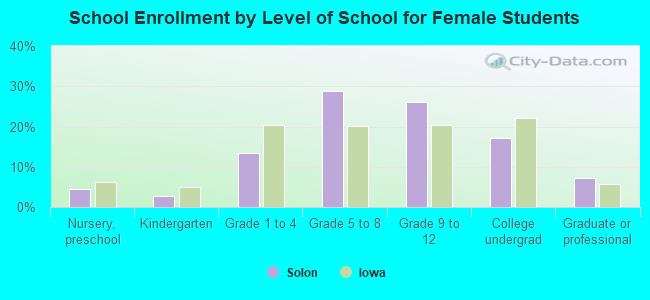
Private vs. public school enrollment:
| Here: | 10.8% |
| Iowa: | 10.6% |
| Here: | 0.0% |
| Iowa: | 7.9% |
| Here: | 31.0% |
| Iowa: | 23.9% |