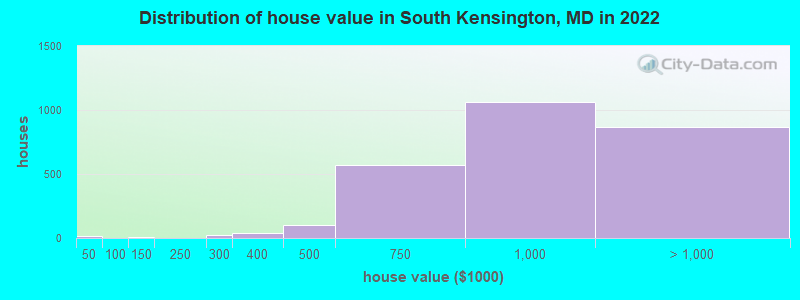
Housing density: 1,440 houses/condos per square mile
Median price asked for vacant for-sale houses and condos in 2022: $755,915.
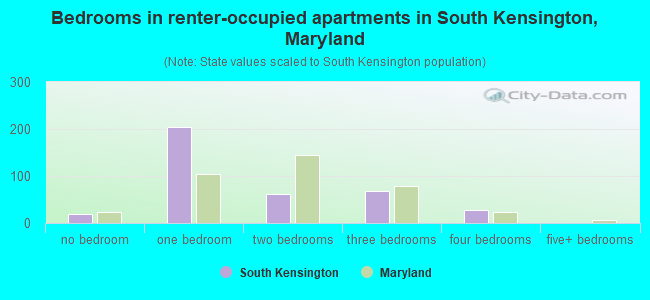
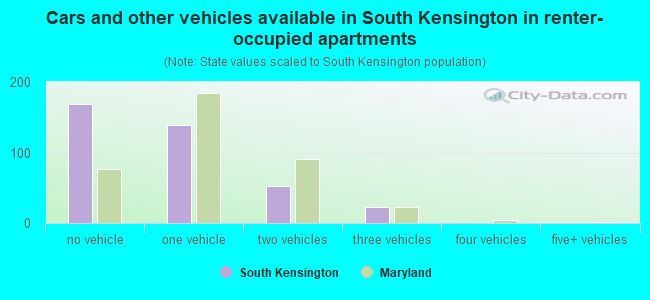
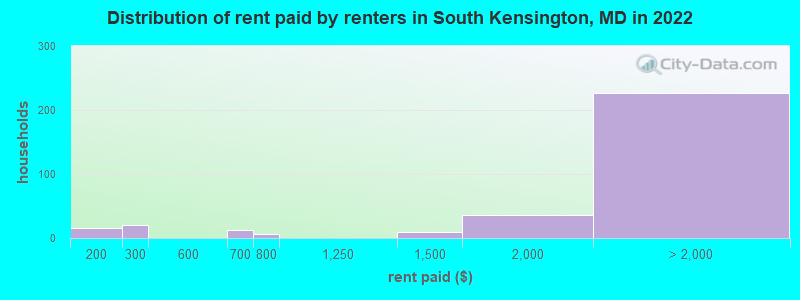
Median contract rent in 2022: over $2,000 (lower quartile is $1,580, upper quartile is over $2,000)
Median rent asked for vacant for-rent units in 2022: $3,001
Median gross rent in South Kensington, MD in 2022: over $2,000
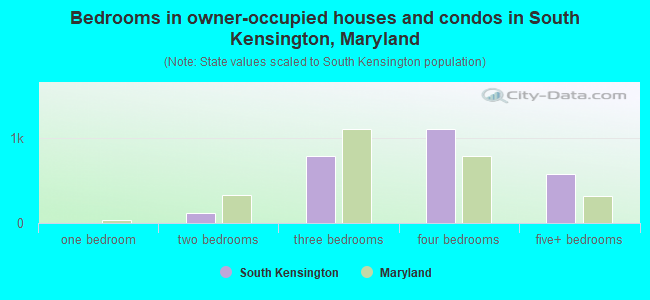
Housing units in South Kensington with a mortgage: 1,923 (240 second mortgage, 0 home equity loan, 232 both second mortgage and home equity loan) Houses without a mortgage: 60
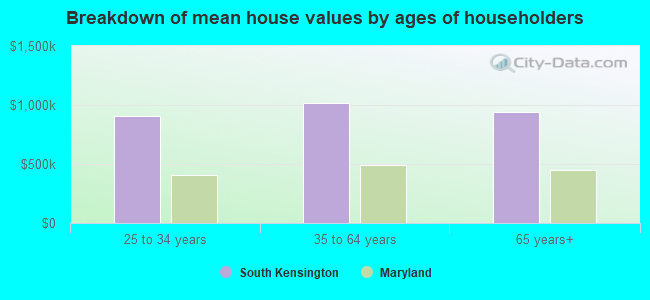
Median household income for houses/condos with a mortgage: $222,189
Median household income for apartments without a mortgage: $144,985
Median monthly housing costs: $2,875
Compare current foreclosures near South Kensington, MD:
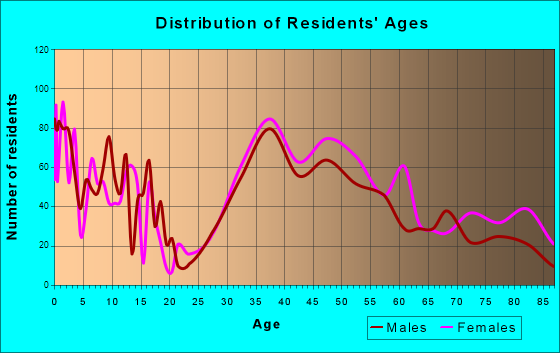
Size of family households: 892 2-persons, 402 3-persons, 628 4-persons, 161 5-persons, 47 6-persons, 14 7-or-more-persons.
Size of nonfamily households: 689 1-person, 86 2-persons, 21 3-persons.
2,117 married couples with children.
66 single-parent households (34 men, 32 women).
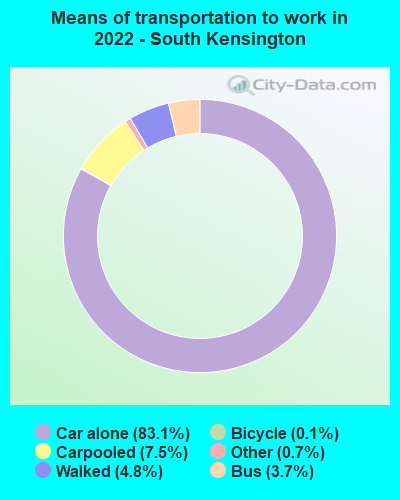
83.4% of residents of South Kensington speak English at home.
3.7% of residents speak Spanish at home (88% speak English very well, 7% speak English well, 6% speak English not well).
6.0% of residents speak other Indo-European language at home (90% speak English very well, 7% speak English well, 3% speak English not well).
3.3% of residents speak Asian or Pacific Island language at home (58% speak English very well, 27% speak English well, 15% speak English not well).
2.4% of residents speak other language at home (100% speak English very well).
Foreign born population: 900 (10.8%)
(80.9% of them are naturalized citizens)
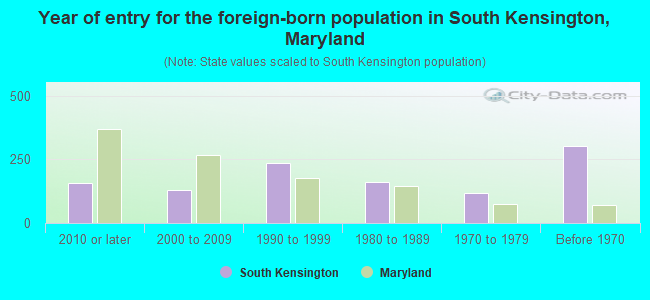
Year of entry for the foreign-born population in South Kensington, Maryland
1582010 or later
1302000 to 2009
2341990 to 1999
1621980 to 1989
1191970 to 1979
302Before 1970
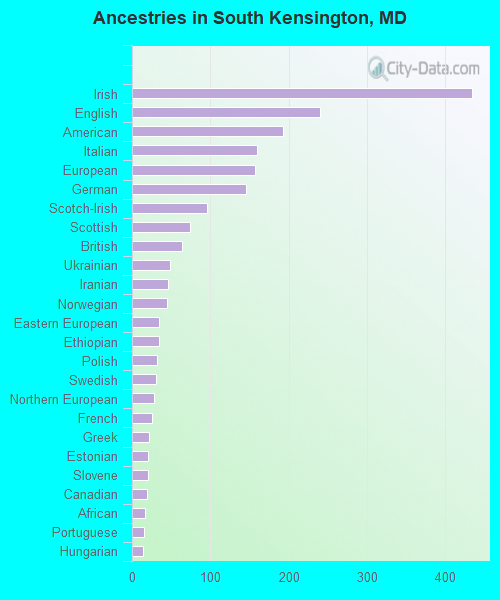
First ancestries reported:
Irish: 434 (13.1%)
English: 240 (7.2%)
American: 193 (5.8%)
Italian: 159 (4.8%)
European: 157 (4.7%)
German: 146 (4.4%)
Scotch-Irish: 96 (2.9%)
Scottish: 74 (2.2%)
British: 64 (1.9%)
Ukrainian: 48 (1.4%)
Iranian: 46 (1.4%)
Norwegian: 45 (1.4%)
Eastern European: 35 (1.1%)
Ethiopian: 35 (1.1%)
Polish: 32 (1.0%)
Swedish: 30 (0.9%)
Northern European: 28 (0.8%)
French: 26 (0.8%)
Greek: 22 (0.7%)
Estonian: 21 (0.6%)
Slovene: 20 (0.6%)
Canadian: 19 (0.6%)
African: 16 (0.5%)
Portuguese: 15 (0.5%)
Hungarian: 14 (0.4%)
Bermudan: 11 (0.3%)
Lithuanian: 10 (0.3%)
Russian: 10 (0.3%)
Austrian: 9 (0.3%)
Romanian: 9 (0.3%)
Barbadian: 9 (0.3%)
Armenian: 9 (0.3%)
Slavic: 8 (0.2%)
Welsh: 8 (0.2%)
French Canadian: 6 (0.2%)
Dutch: 6 (0.2%)
Sudanese: 6 (0.2%)
Lebanese: 5 (0.2%)
Trinidadian and Tobagonian: 5 (0.2%)
Israeli: 1 (0.03%)
Most common places of birth for foreign-born residents (%):
India
South Kensington:
8.0% (72)
Maryland:
6.4% (61,725)
Korea
South Kensington:
7.7% (69)
Maryland:
3.4% (32,635)
Canada
South Kensington:
7.1% (64)
Maryland:
0.9% (8,603)
United Kingdom, excluding England and Scotland
South Kensington:
6.0% (54)
Maryland:
0.7% (6,724)
Sweden
South Kensington:
5.1% (46)
Maryland:
0.1% (789)
Scotland
South Kensington:
5.0% (45)
Maryland:
0.1% (738)
Russia
South Kensington:
4.7% (42)
Maryland:
1.0% (9,481)
Brazil
South Kensington:
4.1% (37)
Maryland:
1.2% (11,980)
Iran
South Kensington:
3.9% (35)
Maryland:
1.3% (12,074)
Italy
South Kensington:
3.4% (31)
Maryland:
0.5% (4,596)
Thailand
South Kensington:
3.2% (29)
Maryland:
0.4% (3,874)
Philippines
South Kensington:
2.7% (24)
Maryland:
3.8% (36,698)
Ethiopia
South Kensington:
2.7% (24)
Maryland:
3.2% (30,870)
Vietnam
South Kensington:
2.6% (23)
Maryland:
1.9% (18,716)
China, excluding Hong Kong and Taiwan
South Kensington:
2.4% (22)
Maryland:
4.6% (44,742)
Norway
South Kensington:
2.4% (22)
Maryland:
0.1% (581)
Taiwan
South Kensington:
2.4% (22)
Maryland:
0.9% (8,520)
Uruguay
South Kensington:
2.2% (20)
Maryland:
0.1% (667)
Nicaragua
South Kensington:
2.0% (18)
Maryland:
0.6% (5,899)
Colombia
South Kensington:
1.8% (16)
Maryland:
1.3% (12,898)
Australia
South Kensington:
1.7% (15)
Maryland:
0.2% (1,764)
El Salvador
South Kensington:
1.7% (15)
Maryland:
12.0% (115,412)
Place of birth for U.S.-born residents:
This state: 2,141
Other state: 4,887
Northeast: 1,264
Midwest: 819
South: 2,266
West: 567
92.2% of South Kensington residents lived in the same house 1 years ago. Out of people who lived in different houses, 33.5% lived in this county. Out of people who lived in different counties, 40.3% lived in Maryland.
South Kensington:
92.2%
State average:
88.5%
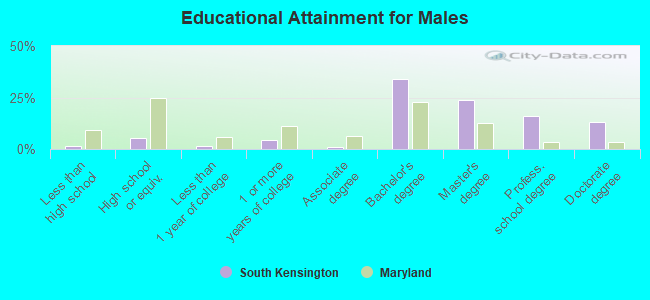
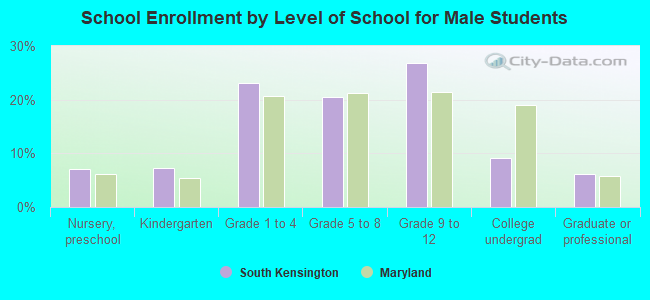
Education attainment for males 25 years and older:
No schooling: 1
Nursery to 4th grade: 0
5th and 6th grade: 15
7th and 8th grade: 0
9th grade: 2
10th grade: 0
11th grade: 10
12th grade, no diploma: 16
High school graduate (or equivalency): 138
Less than 1 year of college: 40
Some college more than 1 year, no degree: 119
Associate degree: 20
Bachelor's degree: 912
Master's degree: 645
Professional school degree: 434
Doctorate degree: 350
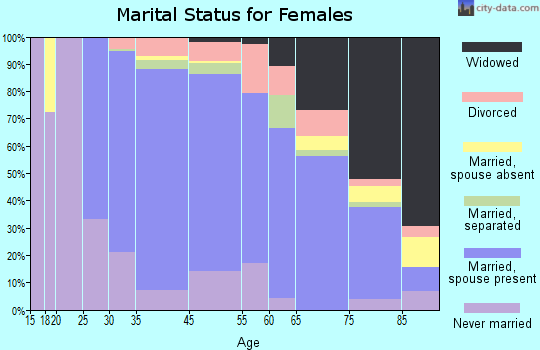
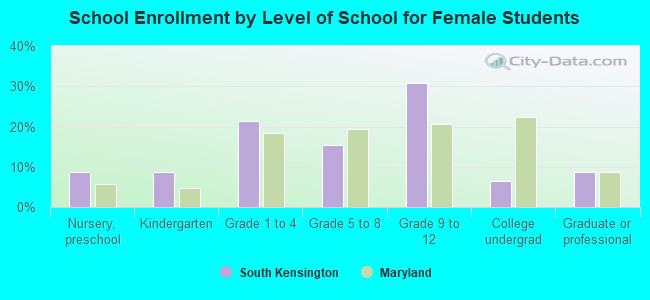
Education attainment for females 25 years and older:
No schooling: 0
Nursery to 4th grade: 6
5th and 6th grade: 0
7th and 8th grade: 0
9th grade: 22
10th grade: 8
11th grade: 0
12th grade, no diploma: 4
High school graduate (or equivalency): 209
Less than 1 year of college: 34
Some college more than 1 year, no degree: 100
Associate degree: 151
Bachelor's degree: 976
Master's degree: 853
Professional school degree: 372
Doctorate degree: 226
Housing units in structures:
One, detached: 2,815
One, attached: 33
20 to 49: 27
50 or more: 186
Boats, RVs, vans, etc.: 9
Housing units lacking complete plumbing facilities in 2022: 1.1%
Housing units lacking complete kitchen facilities in 2022: 1.1%
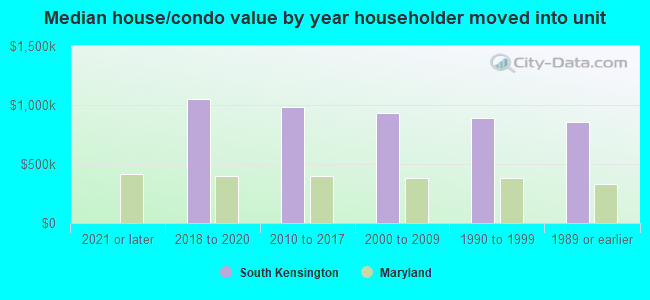
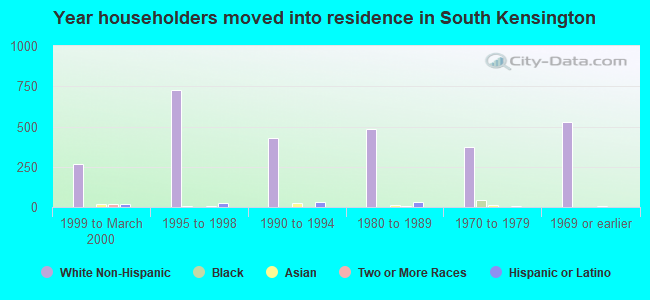
House/condo owner moved in on average 16 years ago