Housing density: 2,976 houses/condos per square mile
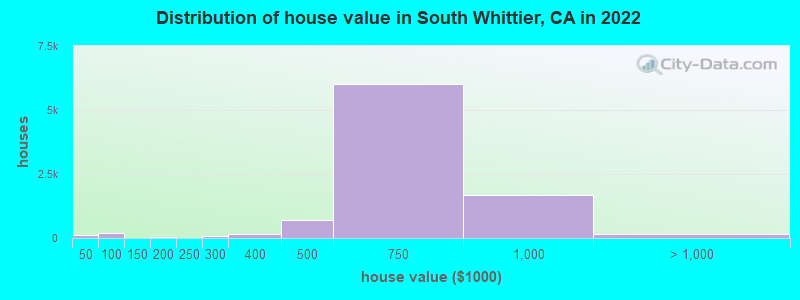
Median price asked for vacant for-sale houses and condos in 2022: $719,661.
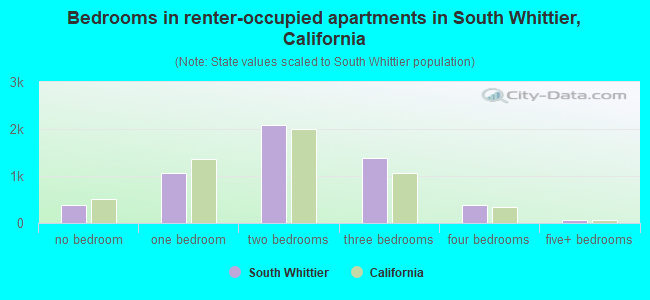
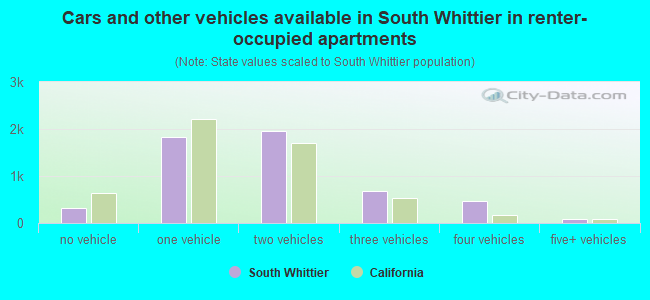
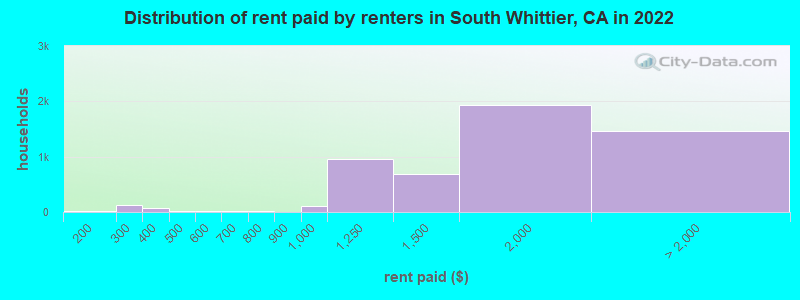
Median contract rent in 2022: $1,659 (lower quartile is $1,238, upper quartile is over $2,000)
Median rent asked for vacant for-rent units in 2022: $1,736
Median gross rent in South Whittier, CA in 2022: $1,757
Housing units in South Whittier with a mortgage: 7,183 (574 second mortgage, 20 home equity loan, 442 both second mortgage and home equity loan) Houses without a mortgage: 54
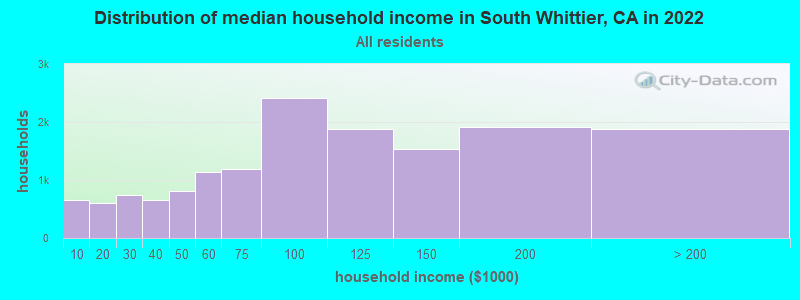
Median household income for houses/condos with a mortgage: $121,590
Median household income for apartments without a mortgage: $89,990
Median monthly housing costs: $1,922
Compare current foreclosures near South Whittier, CA:
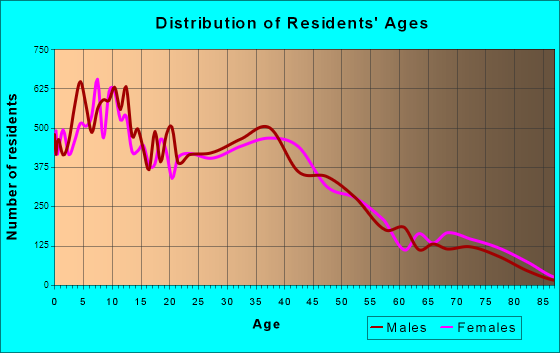
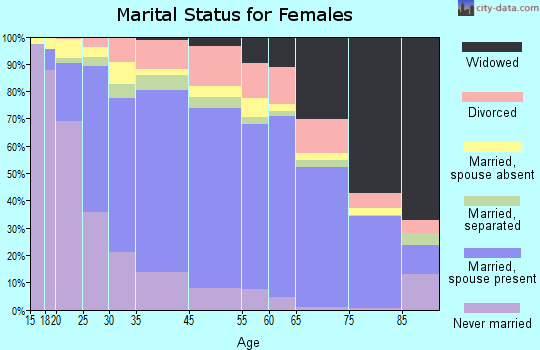
7,582 married couples with children.
1,885 single-parent households (361 men, 1,524 women).
40.8% of residents of South Whittier speak English at home.
52.8% of residents speak Spanish at home (70% speak English very well, 15% speak English well, 9% speak English not well, 6% don't speak English at all).
1.3% of residents speak other Indo-European language at home (66% speak English very well, 18% speak English well, 10% speak English not well, 7% don't speak English at all).
4.2% of residents speak Asian or Pacific Island language at home (59% speak English very well, 27% speak English well, 11% speak English not well, 3% don't speak English at all).
0.4% of residents speak other language at home (61% speak English very well, 25% speak English well, 14% speak English not well).
Foreign born population: 13,641 (24.3%)
(57.4% of them are naturalized citizens)
Percentage of workers working in this county: 77.6% Number of people working at home: 2,380 (8.5% of all workers)
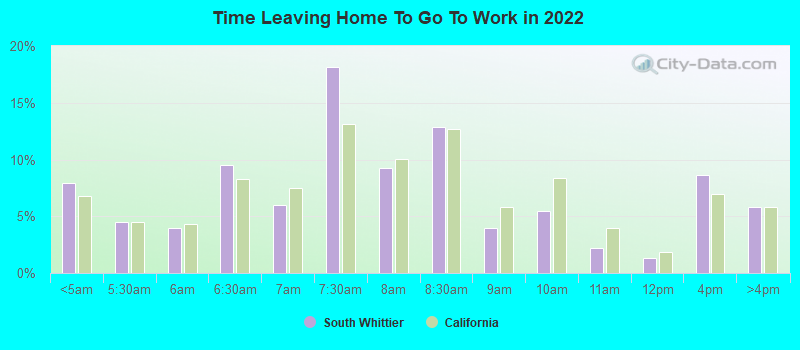
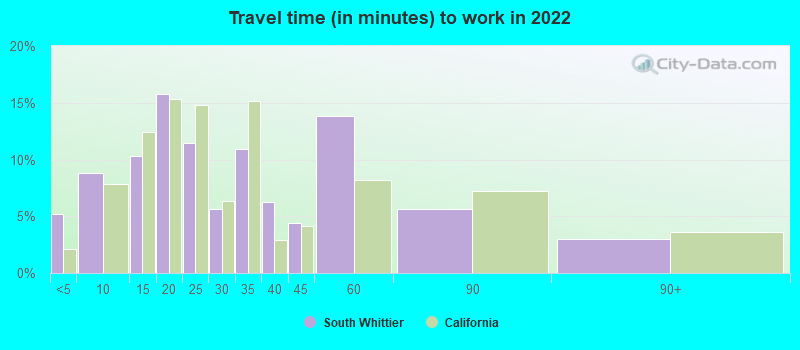
Travel time to work (commute)
Less than 5 minutes: 422
5 to 9 minutes: 1,242
10 to 14 minutes: 2,727
15 to 19 minutes: 3,422
20 to 24 minutes: 3,090
25 to 29 minutes: 1,656
30 to 34 minutes: 4,048
35 to 39 minutes: 1,126
40 to 44 minutes: 1,169
45 to 59 minutes: 2,709
60 to 89 minutes: 2,351
90 or more minutes: 965
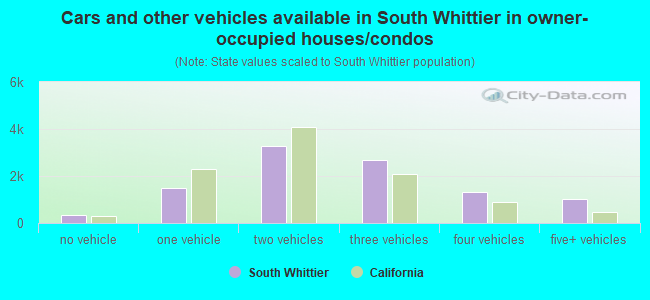
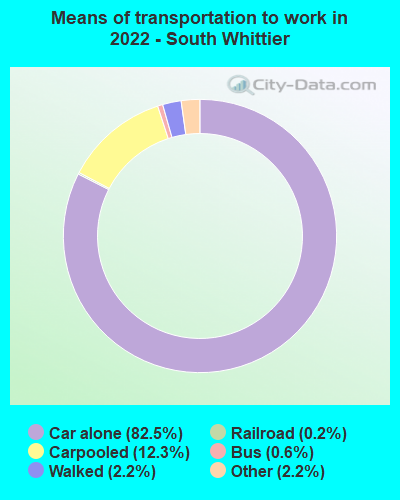
Means of transportation to work:
Drove a car alone: 3,128 (53.6%)
Carpooled: 515 (8.8%)
Bus: 21 (0.4%)
Light rail, streetcar or trolley: 5 (0.1%)
Taxi: 89 (1.5%)
Walked: 89 (1.5%)
Worked at home: 2,380 (40.8%)
Unemployment by race in 2022
Unemployment rate for White non-Hispanic residents
5.7%Males
6.3%Females
Unemployment rate for Black residents
5.4%Males
Unemployment rate for American Indian and Alaska Native residents
10.1%Males
6.8%Females
Unemployment rate for Asian residents
12.5%Males
2.5%Females
Unemployment rate for other race residents
3.2%Males
3.2%Females
Unemployment rate for two or more race residents
5.4%Males
3.4%Females
Unemployment rate for Hispanic or Latino residents
3.9%Males
4.2%Females
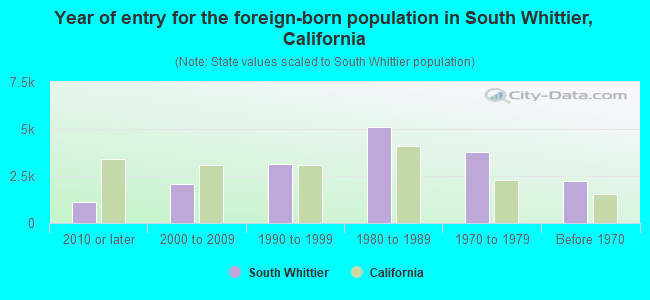
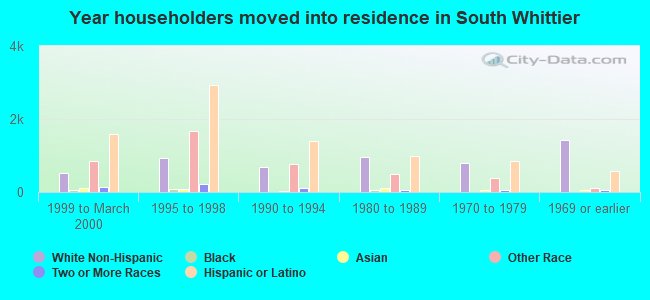
Year of entry for the foreign-born population in South Whittier, California
1,1052010 or later
2,0622000 to 2009
3,1351990 to 1999
5,1071980 to 1989
3,7861970 to 1979
2,237Before 1970
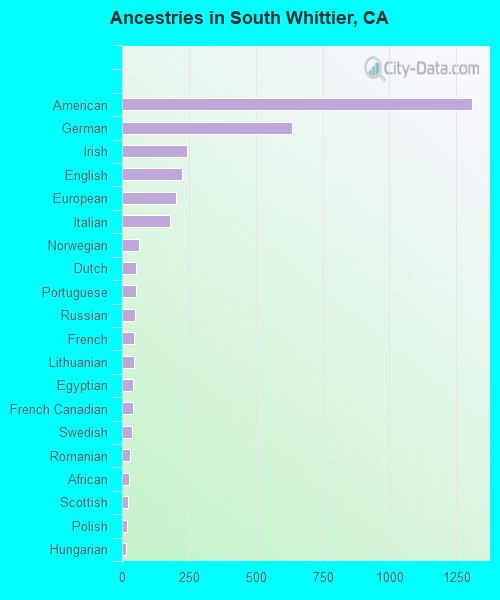
First ancestries reported:
American: 1,307 (3.4%)
German: 634 (1.6%)
Irish: 244 (0.6%)
English: 223 (0.6%)
European: 201 (0.5%)
Italian: 179 (0.5%)
Norwegian: 65 (0.2%)
Dutch: 52 (0.1%)
Portuguese: 52 (0.1%)
Russian: 47 (0.1%)
French: 46 (0.1%)
Lithuanian: 46 (0.1%)
Egyptian: 40 (0.1%)
French Canadian: 40 (0.1%)
Swedish: 37 (0.10%)
Romanian: 29 (0.07%)
African: 26 (0.07%)
Scottish: 22 (0.06%)
Polish: 20 (0.05%)
Hungarian: 15 (0.04%)
British: 10 (0.03%)
Danish: 9 (0.02%)
Ukrainian: 9 (0.02%)
Eastern European: 8 (0.02%)
Scandinavian: 8 (0.02%)
Scotch-Irish: 8 (0.02%)
Armenian: 7 (0.02%)
Swiss: 6 (0.02%)
Northern European: 3 (0.01%)
Most common places of birth for foreign-born residents (%):
Mexico
South Whittier:
66.1% (9,020)
California:
37.2% (3,881,193)
Philippines
South Whittier:
5.9% (803)
California:
7.8% (818,297)
El Salvador
South Whittier:
3.7% (505)
California:
4.2% (440,287)
Korea
South Whittier:
3.7% (499)
California:
3.0% (315,248)
Guatemala
South Whittier:
2.8% (378)
California:
2.8% (290,436)
Peru
South Whittier:
2.3% (307)
California:
0.7% (74,025)
Vietnam
South Whittier:
1.8% (242)
California:
4.9% (512,335)
Colombia
South Whittier:
1.6% (225)
California:
0.5% (55,249)
Place of birth for U.S.-born residents:
This state: 39,545
Other state: 2,634
Northeast: 464
Midwest: 649
South: 812
West: 676
94.5% of South Whittier residents lived in the same house 1 years ago. Out of people who lived in different houses, 44.0% lived in this county. Out of people who lived in different counties, 80.2% lived in California.
South Whittier:
94.5%
State average:
88.9%
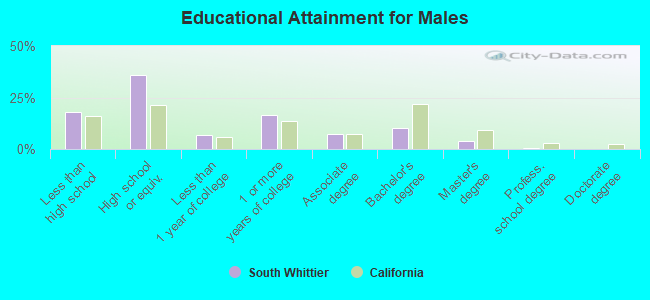
Education attainment for males 25 years and older:
No schooling: 698
Nursery to 4th grade: 233
5th and 6th grade: 537
7th and 8th grade: 358
9th grade: 320
10th grade: 286
11th grade: 298
12th grade, no diploma: 545
High school graduate (or equivalency): 6,509
Less than 1 year of college: 1,205
Some college more than 1 year, no degree: 3,007
Associate degree: 1,356
Bachelor's degree: 1,814
Master's degree: 709
Professional school degree: 126
Doctorate degree: 42
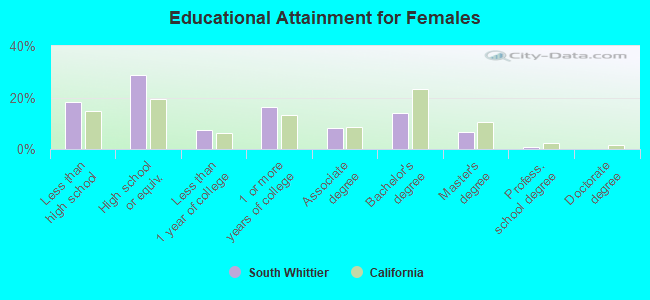
Education attainment for females 25 years and older:
No schooling: 881
Nursery to 4th grade: 133
5th and 6th grade: 571
7th and 8th grade: 331
9th grade: 300
10th grade: 354
11th grade: 220
12th grade, no diploma: 521
High school graduate (or equivalency): 5,234
Less than 1 year of college: 1,341
Some college more than 1 year, no degree: 3,008
Associate degree: 1,467
Bachelor's degree: 2,592
Master's degree: 1,230
Professional school degree: 126
Doctorate degree: 22
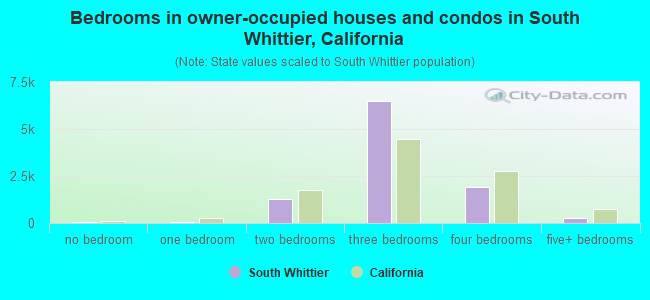
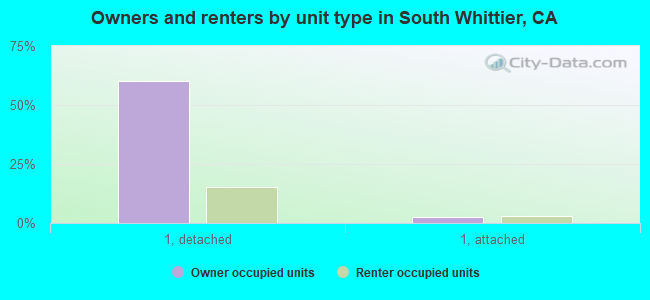
Housing units in structures:
One, detached: 12,142
One, attached: 843
Two: 58
3 or 4: 356
5 to 9: 564
10 to 19: 491
20 to 49: 743
50 or more: 728
Mobile homes: 81
Median worth of mobile homes: $93,737
Housing units lacking complete plumbing facilities in 2022: 0.2%
Housing units lacking complete kitchen facilities in 2022: 1.7%
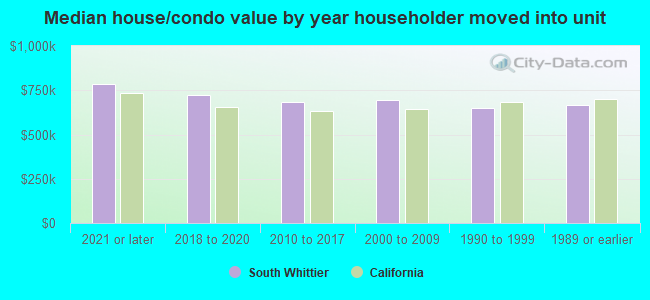
House/condo owner moved in on average 17 years ago