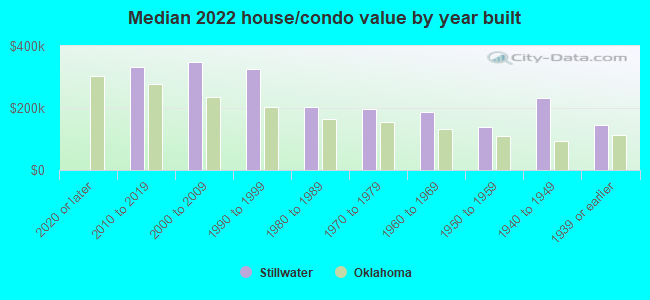
Stillwater, OK (Oklahoma) Houses and Residents
| Stillwater: | $240,811 |
| Oklahoma: | $191,700 |
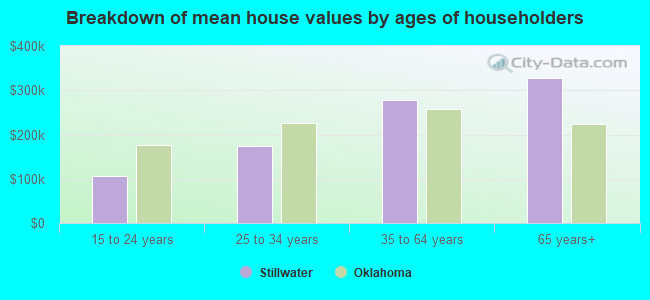
Mean price in 2022:
Detached houses: $301,955
Here: $301,955 State: $255,409 Townhouses or other attached units: $175,009
Here: $175,009 State: $206,466 In 2-unit structures: $240,451
Here: $240,451 State: $195,100 In 5-or-more-unit structures: $321,800
Here: $321,800 State: $233,805 Mobile homes: $88,349
Here: $88,349 State: $110,804
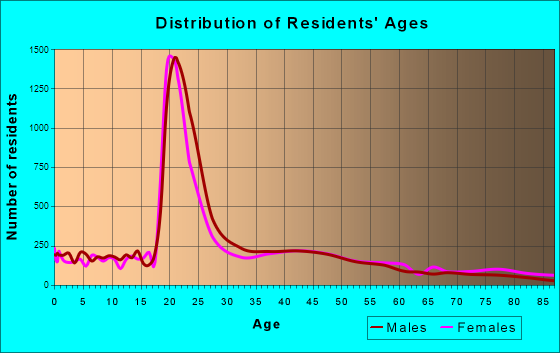
Total population: 48,406 (Urban population: 37,927 (all inside urban clusters), Rural population: 1,041 (19 farm, 1,022 nonfarm))
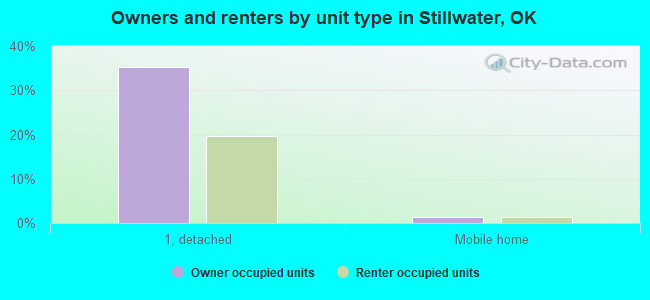
Houses: 22,205 (19,111 occupied: 7,527 owner occupied, 12,576 renter occupied)
| % of renters here: | 63% |
| State: | 35% |
Housing density: 797 houses/condos per square mile
Median price asked for vacant for-sale houses and condos in 2022: $93,637.
Median contract rent in 2022: $782 (lower quartile is $594, upper quartile is $957)
Median rent asked for vacant for-rent units in 2022: $731
Median gross rent in Stillwater, OK in 2022: $980
Housing units in Stillwater with a mortgage: 4,443 (499 second mortgage, 0 home equity loan, 464 both second mortgage and home equity loan)
Houses without a mortgage: 65
Median household income for houses/condos with a mortgage: $99,053
Median household income for apartments without a mortgage: $63,266
Median monthly housing costs: $970
Compare current foreclosures near Stillwater, OK:
| Photo | Address | Area | Beds / Baths | Price | Details |
|---|---|---|---|---|---|

|
#1
W Chickasaw Ln
Stillwater, OK 74075
|
1,066 sq. feet
|
2 baths 3 beds |
show details | |

|
#2
W Graham Ave
Stillwater, OK 74075
|
2,300 sq. feet
|
2 baths 3 beds |
show details | |

|
#3
N Bethel Rd
Stillwater, OK 74075
|
960 sq. feet
|
- baths 3 beds |
show details | |

|
#4
S Oxford Dr
Stillwater, OK 74074
|
2,179 sq. feet
|
- baths 4 beds |
show details | |

|
#5
S 2nd Ct
Stillwater, OK 74074
|
1,701 sq. feet
|
- baths 3 beds |
show details | |

|
#6
E Audene Dr
Stillwater, OK 74075
|
1,544 sq. feet
|
- baths - beds |
show details | |

|
#7
S Mcdonald St
Stillwater, OK 74074
|
1,071 sq. feet
|
- baths - beds |
show details | |

|
#8
Chandler St
Stillwater, OK 74074
|
- sq. feet
|
- baths - beds |
show details | |

|
#9
S Saddle Rock Rd
Stillwater, OK 74074
|
1,891 sq. feet
|
- baths - beds |
show details | |

|
#10
N Perkins Rd Apt D28
Stillwater, OK 74075
|
- sq. feet
|
- baths - beds |
show details |
| Photo | Address | Area | Beds / Baths | Price | Details |
|---|---|---|---|---|---|

|
#11
N Manning St
Stillwater, OK 74075
|
2,118 sq. feet
|
- baths - beds |
show details | |

|
#12
W 8th Ave
Stillwater, OK 74074
|
1,365 sq. feet
|
- baths - beds |
show details | |

|
#13
S Fairgrounds
Stillwater, OK 74074
|
- sq. feet
|
- baths - beds |
show details | |

|
#14
N Washington St # 301
Stillwater, OK 74075
|
- sq. feet
|
- baths - beds |
show details | |

|
#15
W 7th Ave
Stillwater, OK 74074
|
1,395 sq. feet
|
- baths - beds |
show details | |

|
#16
S Oxford Dr
Stillwater, OK 74074
|
2,143 sq. feet
|
- baths - beds |
show details | |

|
#17
E 14th Ave
Stillwater, OK 74074
|
- sq. feet
|
- baths - beds |
show details | |

|
#18
E Rogers Dr
Stillwater, OK 74075
|
- sq. feet
|
- baths - beds |
show details | |

|
#19
S Jardot Rd, Trlr 14
Stillwater, OK 74074
|
- sq. feet
|
- baths - beds |
show details | |

|
#20
W 44th St
Stillwater, OK 74074
|
- sq. feet
|
- baths - beds |
show details |
| Photo | Address | Area | Beds / Baths | Price | Details |
|---|---|---|---|---|---|

|
#21
N Union Rd
Stillwater, OK 74075
|
- sq. feet
|
- baths - beds |
show details | |

|
#22
S Pine St
Stillwater, OK 74074
|
- sq. feet
|
- baths - beds |
show details | |

|
#23
N Perkins Rd Apt R197
Stillwater, OK 74075
|
- sq. feet
|
- baths - beds |
show details | |

|
#24
W Osage Dr
Stillwater, OK 74075
|
- sq. feet
|
- baths - beds |
show details | |

|
#25
E Kinder Wells Blvd
Perkins, OK 74059
|
- sq. feet
|
- baths - beds |
show details | |

|
#26
W Lee St
Coyle, OK 73027
|
- sq. feet
|
- baths - beds |
show details | |

|
#27
S Asp St
Coyle, OK 73027
|
- sq. feet
|
- baths - beds |
show details | |

|
#28
N Massachusetts Ave
Coyle, OK 73027
|
- sq. feet
|
- baths - beds |
show details | |

|
#29
Frontier
Perry, OK 73077
|
- sq. feet
|
- baths - beds |
show details | |

|
Check over 1 million property listings on Foreclosure.com!
|
browse all offers | |||

Latest news about housing in Stillwater, OK collected exclusively by city-data.com from local newspapers, TV, and radio stations

 | Ideal Homes New Construction - Stillwater (10 replies) |
| Stillwater beats Norman when it comes to apartment living (7 replies) |
| Rental houses in Enid (13 replies) |
| Any Big Houses in OKC (8 replies) |
| Is there any way without a car to get to Stillwater and then home? (45 replies) |
| These Are the World’s Most Affordable and Least Affordable Cities to Buy a Home OKC #2 (21 replies) |
Median year apartment built: 1986
Household type by relationship:
Households: 49,080- Male householders: 9,730 (3,927 living alone), Female householders: 9,390 (3,891 living alone)
5,620 spouses (5,602 opposite-sex spouses), 1,221 unmarried partners, (1,127 opposite-sex unmarried partners), 7,951 children (7,343 natural, 255 adopted, 353 stepchildren), 230 grandchildren, 218 brothers or sisters, 199 parents, 64 foster children, 467 other relatives, 5,405 non-relatives
- In group quarters: 8,579
Size of family households: 4,598 2-persons, 2,003 3-persons, 1,362 4-persons, 382 5-persons, 282 6-persons, 100 7-or-more-persons.
Size of nonfamily households: 8,105 1-person, 2,073 2-persons, 599 3-persons, 373 4-persons, 63 5-persons, 6 6-persons, 8 7-or-more-persons.
4,783 married couples with children.
3,046 single-parent households (1,467 men, 1,579 women).
88.5% of residents of Stillwater speak English at home.
2.1% of residents speak Spanish at home (78% speak English very well, 4% speak English well, 18% speak English not well).
3.0% of residents speak other Indo-European language at home (73% speak English very well, 21% speak English well, 6% speak English not well).
3.5% of residents speak Asian or Pacific Island language at home (47% speak English very well, 48% speak English well, 4% speak English not well, 1% don't speak English at all).
2.1% of residents speak other language at home (88% speak English very well, 10% speak English well, 2% speak English not well).
Foreign born population: 4,140 (8.4%)
(18.2% of them are naturalized citizens)
| Here: | 6.2 |
| State: | 6.1 |
| Here: | 3.9 |
| State: | 4.5 |
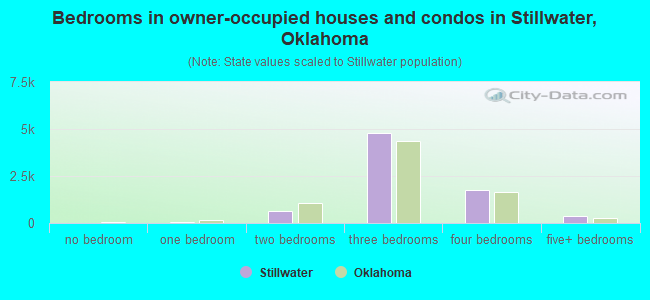
- Bedrooms in owner-occupied houses and condos in Stillwater, Oklahoma
- 0no bedroom
- 461 bedroom
- 6332 bedrooms
- 4,7723 bedrooms
- 1,7314 bedrooms
- 3465+ bedrooms
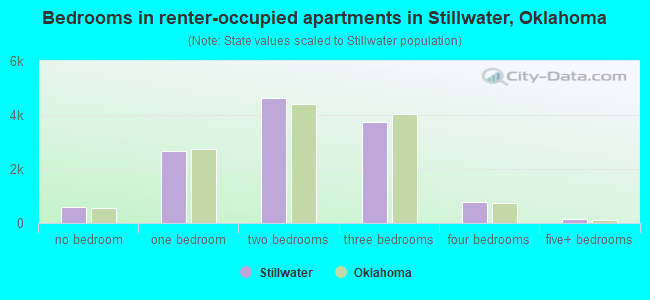
- Bedrooms in renter-occupied apartments in Stillwater, Oklahoma
- 600no bedroom
- 2,6511 bedroom
- 4,6422 bedrooms
- 3,7573 bedrooms
- 7674 bedrooms
- 1595+ bedrooms
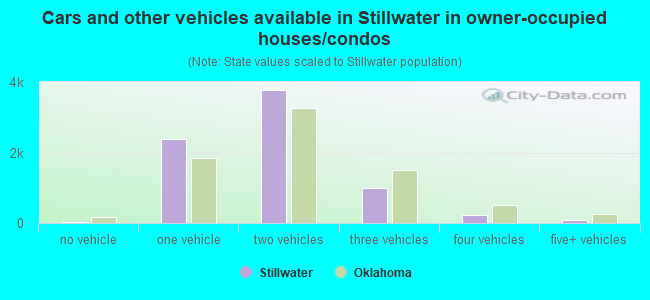
- Cars and other vehicles available in Stillwater in owner-occupied houses/condos
- 39no vehicle
- 2,3851 vehicle
- 3,7862 vehicles
- 9813 vehicles
- 2404 vehicles
- 975+ vehicles
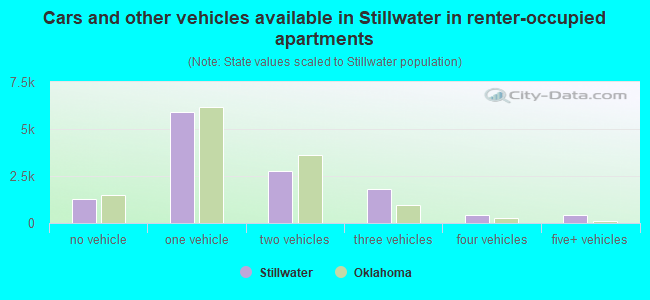
- Cars and other vehicles available in Stillwater in renter-occupied apartments
- 1,269no vehicle
- 5,8961 vehicle
- 2,7712 vehicles
- 1,7893 vehicles
- 4494 vehicles
- 4035+ vehicles
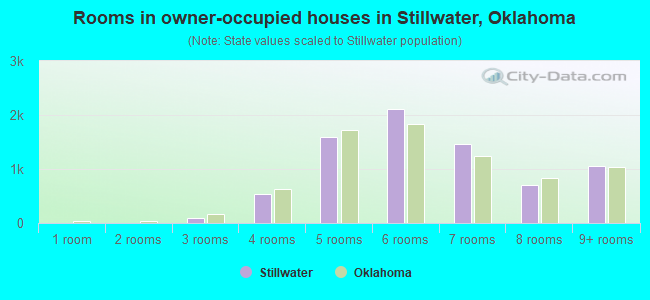
- Rooms in owner-occupied houses in Stillwater, Oklahoma
- 01 room
- 02 rooms
- 843 rooms
- 5284 rooms
- 1,5845 rooms
- 2,1086 rooms
- 1,4677 rooms
- 7008 rooms
- 1,0579+ rooms
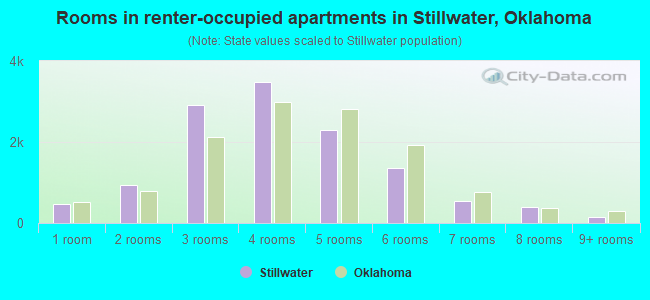
- Rooms in renter-occupied apartments in Stillwater, Oklahoma
- 4771 room
- 9462 rooms
- 2,9093 rooms
- 3,4804 rooms
- 2,2995 rooms
- 1,3596 rooms
- 5557 rooms
- 4038 rooms
- 1499+ rooms
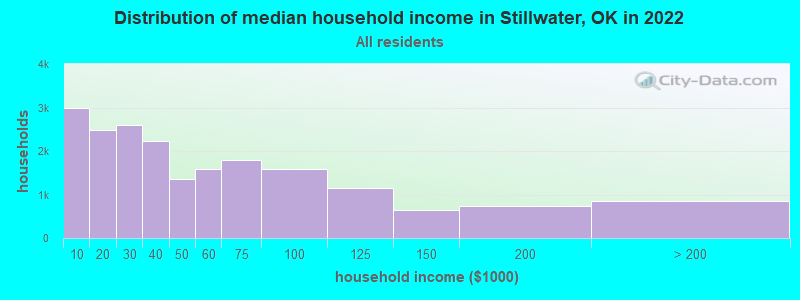
Stillwater, OK household income distribution

- 2,996Less than $10,000
- 2,474$10,000 to $19,999
- 2,591$20,000 to $29,999
- 2,236$30,000 to $39,999
- 1,367$40,000 to $49,999
- 1,595$50,000 to $59,999
- 1,804$60,000 to $74,999
- 1,587$75,000 to $99,999
- 1,148$100,000 to $124,999
- 639$125,000 to $149,999
- 744$150,000 to $199,999
- 853$200,000 or more
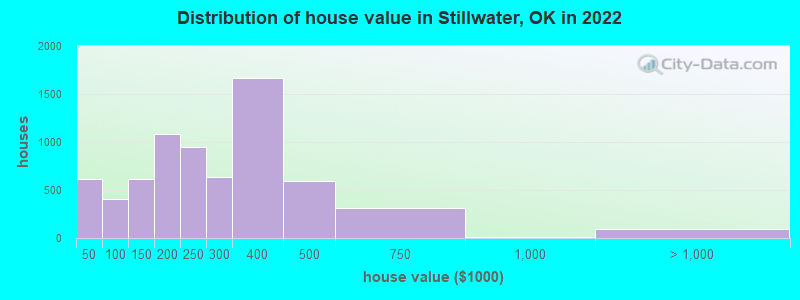
Home value of owner - occupied houses in 2022 in Stillwater, OK
-
- 109Less than $10,000
- 42$10,000 to $14,999
- 53$15,000 to $19,999
- 109$20,000 to $24,999
- 188$25,000 to $29,999
- 17$30,000 to $34,999
- 26$35,000 to $39,999
- 69$40,000 to $49,999
- 7$50,000 to $59,999
- 81$60,000 to $69,999
- 101$70,000 to $79,999
- 3$80,000 to $89,999
- 144$90,000 to $99,999
- 152$100,000 to $124,999
- 464$125,000 to $149,999
- 486$150,000 to $174,999
- 598$175,000 to $199,999
- 942$200,000 to $249,999
- 632$250,000 to $299,999
- 1,669$300,000 to $399,999
- 597$400,000 to $499,999
- 310$500,000 to $749,999
- 8$750,000 to $999,999
- 35$1,000,000 to $1,499,999
- 15$1,500,000 to $1,999,999
- 38$2,000,000 or more
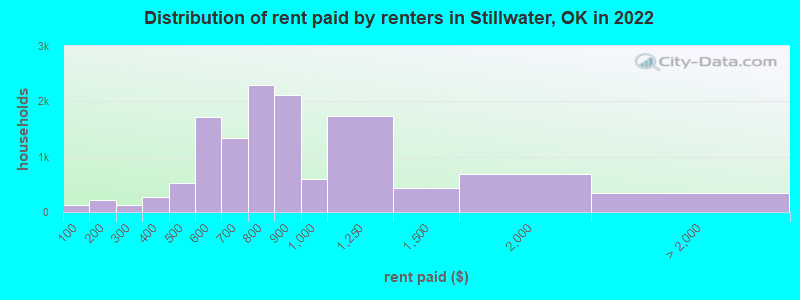
Rent paid by renters in 2022 in Stillwater, OK
-
- 127Less than $100
- 94$100 to $149
- 126$150 to $199
- 24$200 to $249
- 108$250 to $299
- 69$300 to $349
- 194$350 to $399
- 286$400 to $449
- 237$450 to $499
- 1,029$500 to $549
- 693$550 to $599
- 801$600 to $649
- 539$650 to $699
- 1,546$700 to $749
- 757$750 to $799
- 2,123$800 to $899
- 591$900 to $999
- 1,742$1,000 to $1,249
- 435$1,250 to $1,499
- 694$1,500 to $1,999
- 80$2,000 to $2,499
- 36$2,500 to $2,999
- 51$3,000 to $3,499
- 173No cash rent
Percentage of workers working in this county: 84.8%
Number of people working at home: 2,429 (10.7% of all workers)
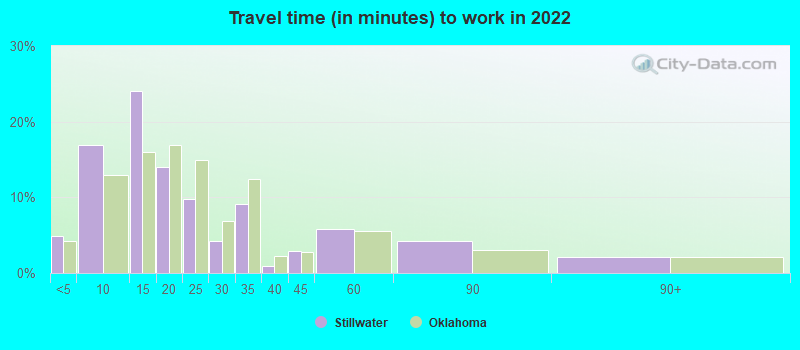
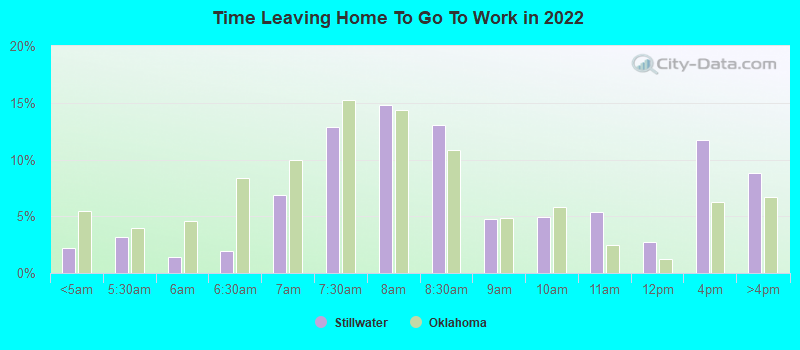
Travel time to work (commute)
- Less than 5 minutes: 1,236
- 5 to 9 minutes: 4,762
- 10 to 14 minutes: 7,136
- 15 to 19 minutes: 2,609
- 20 to 24 minutes: 1,089
- 25 to 29 minutes: 492
- 30 to 34 minutes: 642
- 35 to 39 minutes: 154
- 40 to 44 minutes: 199
- 45 to 59 minutes: 443
- 60 to 89 minutes: 942
- 90 or more minutes: 284
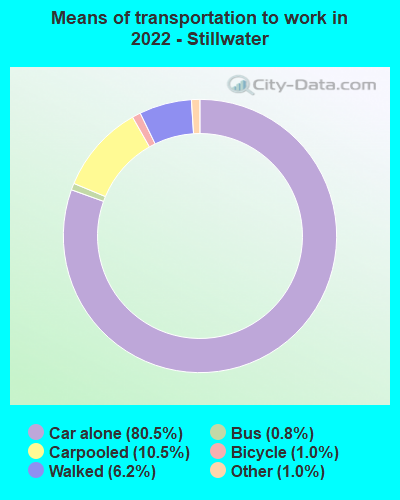
Means of transportation to work:
- Drove a car alone: 20,851 (73.4%)
- Carpooled: 2,779 (9.8%)
- Bus: 172 (0.6%)
- Taxi: 248 (0.9%)
- Bicycle: 254 (0.9%)
- Walked: 1,626 (5.7%)
- Worked at home: 2,429 (8.5%)
- Unemployment by race in 2022
- Unemployment rate for White non-Hispanic residents
- 6.9%Males
- 2.7%Females
- Unemployment rate for Black residents
- 9.4%Males
- 2.6%Females
- Unemployment rate for American Indian and Alaska Native residents
- 11.9%Males
- 9.3%Females
- Unemployment rate for Asian residents
- 4.7%Males
- Unemployment rate for two or more race residents
- 5.3%Males
- 5.3%Females
- Unemployment rate for Hispanic or Latino residents
- 1.8%Males
- 3.4%Females
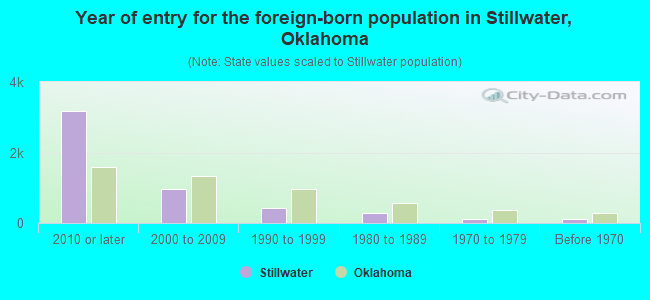
- Year of entry for the foreign-born population in Stillwater, Oklahoma
- 3,1852010 or later
- 9642000 to 2009
- 4391990 to 1999
- 2941980 to 1989
- 1271970 to 1979
- 115Before 1970
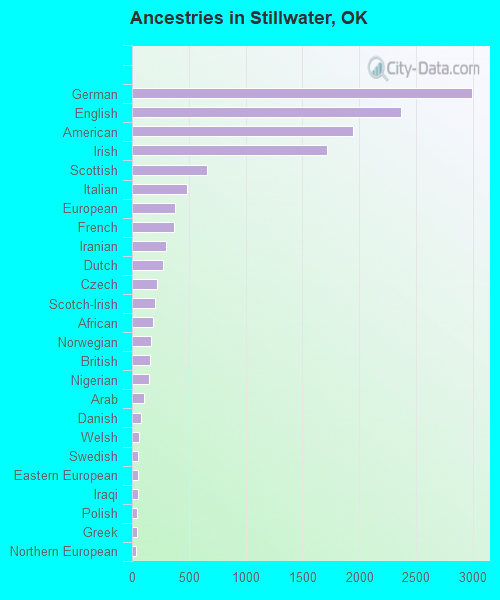
First ancestries reported:
- German: 2,994 (13.9%)
- English: 2,369 (11.0%)
- American: 1,949 (9.1%)
- Irish: 1,718 (8.0%)
- Scottish: 664 (3.1%)
- Italian: 481 (2.2%)
- European: 380 (1.8%)
- French: 367 (1.7%)
- Iranian: 302 (1.4%)
- Dutch: 270 (1.3%)
- Czech: 222 (1.0%)
- Scotch-Irish: 203 (0.9%)
- African: 181 (0.8%)
- Norwegian: 170 (0.8%)
- British: 158 (0.7%)
- Nigerian: 149 (0.7%)
- Arab: 104 (0.5%)
- Danish: 82 (0.4%)
- Welsh: 66 (0.3%)
- Swedish: 54 (0.3%)
- Eastern European: 53 (0.2%)
- Iraqi: 51 (0.2%)
- Polish: 46 (0.2%)
- Greek: 43 (0.2%)
- Northern European: 34 (0.2%)
- Turkish: 34 (0.2%)
- Afghan: 33 (0.2%)
- Egyptian: 31 (0.1%)
- Lebanese: 24 (0.1%)
- Czechoslovakian: 23 (0.1%)
- Swiss: 18 (0.08%)
- Finnish: 17 (0.08%)
- Basque: 14 (0.07%)
- Slovak: 13 (0.06%)
- Lithuanian: 13 (0.06%)
- Canadian: 13 (0.06%)
- Estonian: 12 (0.06%)
- Pennsylvania German: 8 (0.04%)
- French Canadian: 7 (0.03%)
- Ghanaian: 6 (0.03%)
- Belizean: 3 (0.01%)
Most common places of birth for foreign-born residents (%):
| Stillwater: | 20.0% (942) |
| Oklahoma: | 3.2% (7,698) |
| Stillwater: | 13.9% (656) |
| Oklahoma: | 4.1% (10,034) |
| Stillwater: | 5.7% (271) |
| Oklahoma: | 0.9% (2,098) |
| Stillwater: | 4.3% (204) |
| Oklahoma: | 2.0% (4,771) |
| Stillwater: | 4.1% (191) |
| Oklahoma: | 1.2% (2,959) |
| Stillwater: | 3.2% (150) |
| Oklahoma: | 0.3% (765) |
| Stillwater: | 3.0% (140) |
| Oklahoma: | 0.2% (437) |
| Stillwater: | 2.9% (137) |
| Oklahoma: | 42.4% (103,425) |
| Stillwater: | 2.4% (112) |
| Oklahoma: | 0.3% (829) |
| Stillwater: | 2.3% (108) |
| Oklahoma: | 1.7% (4,140) |
| Stillwater: | 2.2% (106) |
| Oklahoma: | 0.4% (1,083) |
| Stillwater: | 2.1% (100) |
| Oklahoma: | 0.2% (485) |
| Stillwater: | 1.9% (88) |
| Oklahoma: | 0.5% (1,194) |
| Stillwater: | 1.7% (80) |
| Oklahoma: | 0.2% (385) |
| Stillwater: | 1.5% (72) |
| Oklahoma: | 0.2% (429) |
| Stillwater: | 1.5% (71) |
| Oklahoma: | 0.5% (1,320) |
Place of birth for U.S.-born residents:
- This state: 25,222
- Other state: 19,536
- Northeast: 832
- Midwest: 5,238
- South: 8,903
- West: 4,540
66.3% of Stillwater residents lived in the same house 1 years ago.
Out of people who lived in different houses, 29.3% lived in this county.
Out of people who lived in different counties, 46.3% lived in Oklahoma.
| Stillwater: | 66.3% |
| State average: | 85.5% |
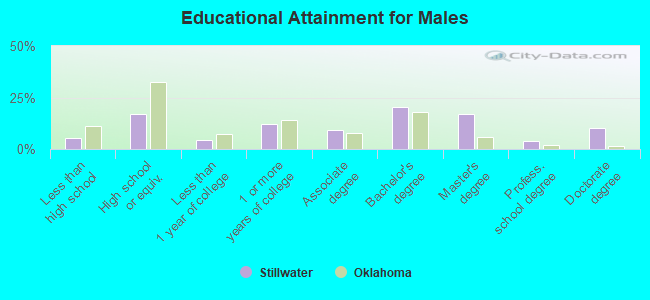
Education attainment for males 25 years and older:
- No schooling: 121
- Nursery to 4th grade: 14
- 5th and 6th grade: 11
- 7th and 8th grade: 33
- 9th grade: 11
- 10th grade: 71
- 11th grade: 173
- 12th grade, no diploma: 183
- High school graduate (or equivalency): 1,960
- Less than 1 year of college: 510
- Some college more than 1 year, no degree: 1,399
- Associate degree: 1,052
- Bachelor's degree: 2,309
- Master's degree: 1,945
- Professional school degree: 455
- Doctorate degree: 1,185
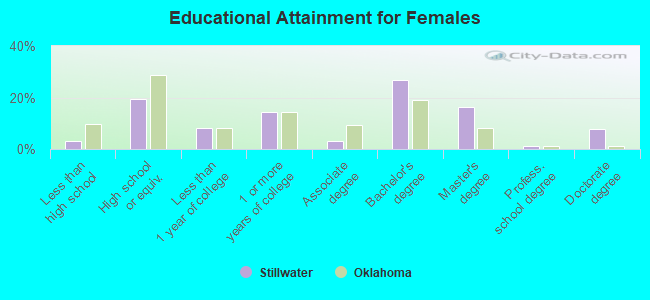
Education attainment for females 25 years and older:
- No schooling: 62
- Nursery to 4th grade: 19
- 5th and 6th grade: 0
- 7th and 8th grade: 13
- 9th grade: 55
- 10th grade: 147
- 11th grade: 10
- 12th grade, no diploma: 55
- High school graduate (or equivalency): 2,176
- Less than 1 year of college: 896
- Some college more than 1 year, no degree: 1,622
- Associate degree: 333
- Bachelor's degree: 3,016
- Master's degree: 1,854
- Professional school degree: 111
- Doctorate degree: 872
Housing units in structures:
- One, detached: 11,279
- One, attached: 960
- Two: 1,045
- 3 or 4: 967
- 5 to 9: 1,581
- 10 to 19: 2,490
- 20 to 49: 1,288
- 50 or more: 1,581
- Mobile homes: 1,010
Median worth of mobile homes: $13,197
Housing units lacking complete kitchen facilities in 2022: 1.4%
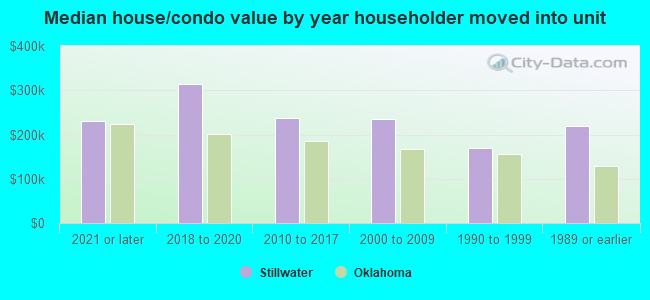
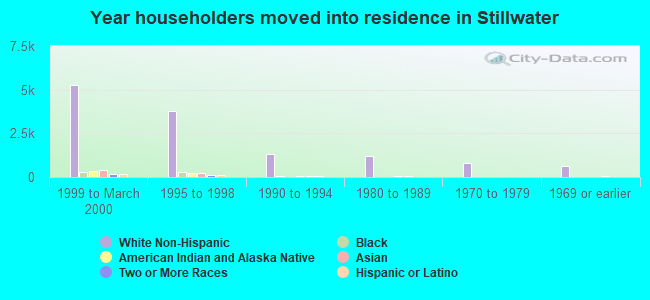
House/condo owner moved in on average 7 years ago
Renter moved in on average 0 years ago
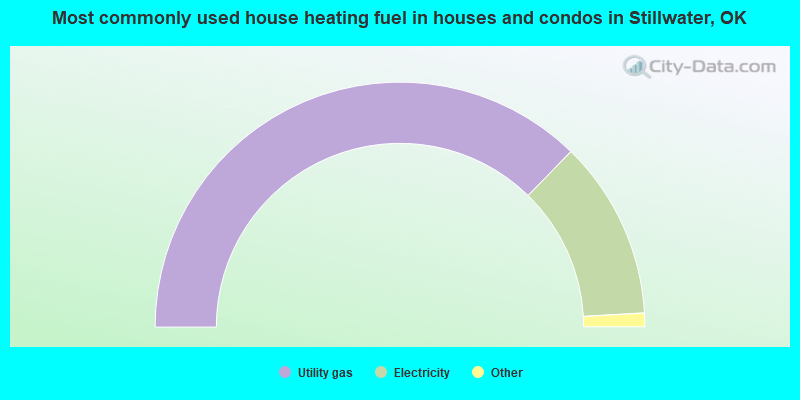
- 74.6%Utility gas
- 23.6%Electricity
- 1.3%Bottled, tank, or LP gas
- 0.4%Other fuel
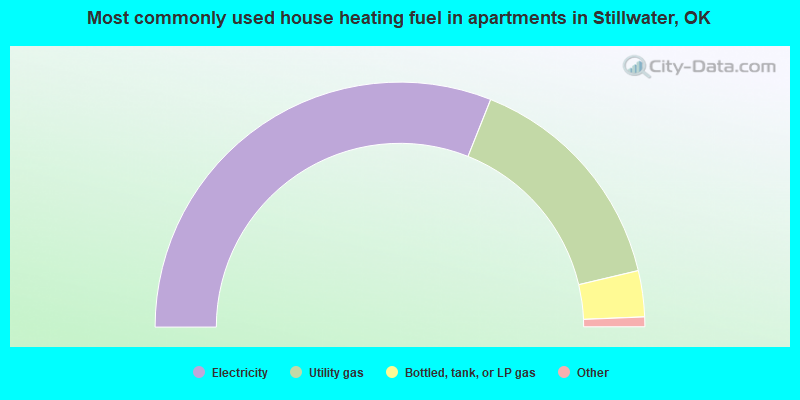
- 62.1%Electricity
- 30.5%Utility gas
- 6.1%Bottled, tank, or LP gas
- 0.4%Fuel oil, kerosene, etc.
- 0.4%Coal or coke
- 0.4%No fuel used
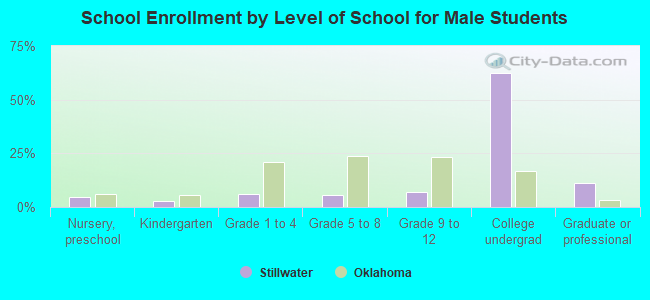
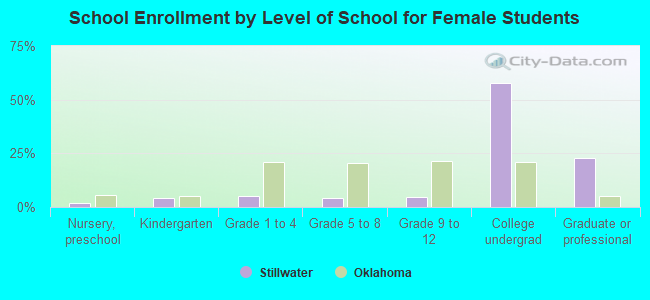
Private vs. public school enrollment:
| Here: | 12.3% |
| Oklahoma: | 11.7% |
| Here: | 10.2% |
| Oklahoma: | 11.7% |
| Here: | 1.3% |
| Oklahoma: | 19.3% |