Housing density: 1,898 houses/condos per square mile
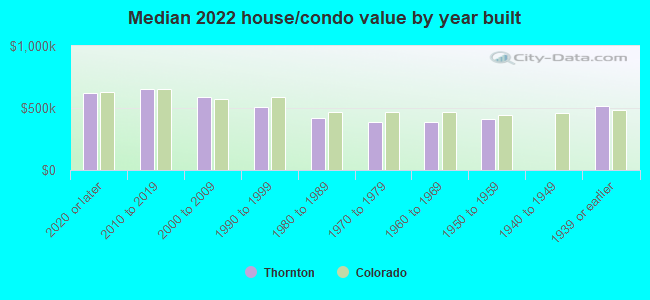
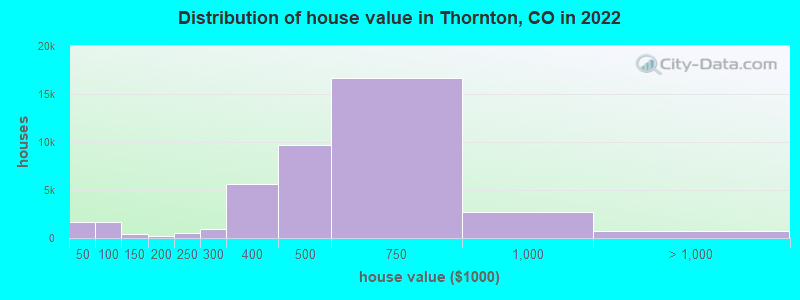
Median price asked for vacant for-sale houses and condos in 2022: $806,964.
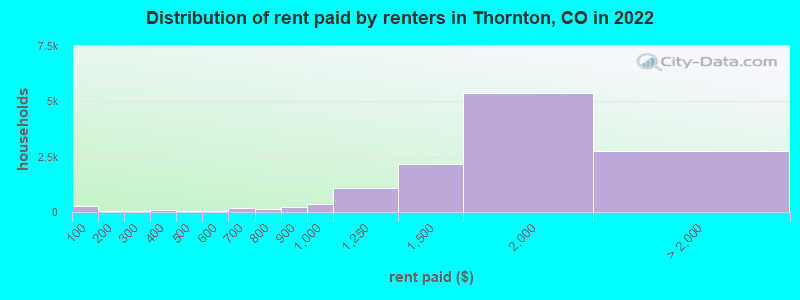
Median contract rent in 2022: $1,686 (lower quartile is $1,409, upper quartile is $1,928)
Median rent asked for vacant for-rent units in 2022: $1,089
Median gross rent in Thornton, CO in 2022: $1,810
Housing units in Thornton with a mortgage: 29,099 (3,381 second mortgage, 0 home equity loan, 2,746 both second mortgage and home equity loan) Houses without a mortgage: 512
Median household income for houses/condos with a mortgage: $118,995
Median household income for apartments without a mortgage: $94,585
25,075 married couples with children.
7,588 single-parent households (2,935 men, 4,653 women).
73.5% of residents of Thornton speak English at home.
20.7% of residents speak Spanish at home (68% speak English very well, 18% speak English well, 10% speak English not well, 4% don't speak English at all).
2.8% of residents speak other Indo-European language at home (56% speak English very well, 28% speak English well, 15% speak English not well, 2% don't speak English at all).
2.7% of residents speak Asian or Pacific Island language at home (51% speak English very well, 26% speak English well, 22% speak English not well, 1% don't speak English at all).
0.4% of residents speak other language at home (41% speak English very well, 39% speak English well, 2% speak English not well, 19% don't speak English at all).
Foreign born population: 16,893 (11.8%)
(40.8% of them are naturalized citizens)
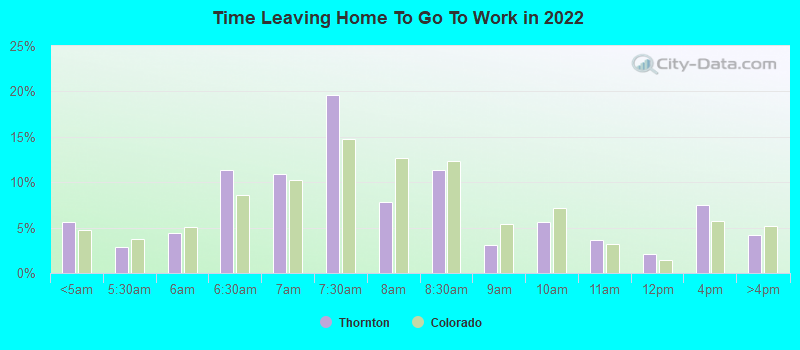
Percentage of workers working in this county: 56.2% Number of people working at home: 14,556 (18.3% of all workers)
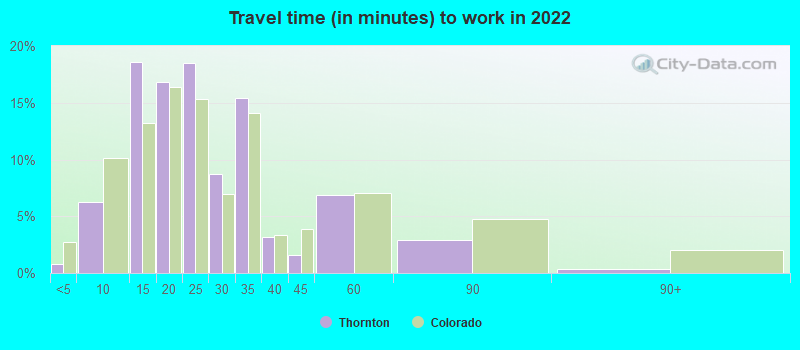
Travel time to work (commute)
Less than 5 minutes: 252
5 to 9 minutes: 2,518
10 to 14 minutes: 8,324
15 to 19 minutes: 11,019
20 to 24 minutes: 7,580
25 to 29 minutes: 4,838
30 to 34 minutes: 13,133
35 to 39 minutes: 2,189
40 to 44 minutes: 3,150
45 to 59 minutes: 8,690
60 to 89 minutes: 4,038
90 or more minutes: 853
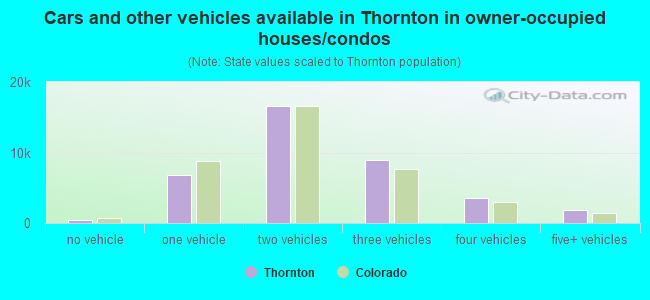
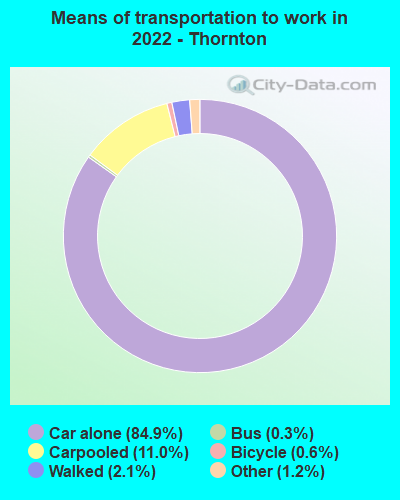
Means of transportation to work:
Drove a car alone: 25,210 (59.8%)
Carpooled: 3,469 (8.2%)
Bus: 65 (0.2%)
Taxi: 333 (0.8%)
Bicycle: 145 (0.3%)
Walked: 529 (1.3%)
Worked at home: 14,556 (34.5%)
Unemployment by race in 2022
Unemployment rate for White non-Hispanic residents
1.8%Males
1.8%Females
Unemployment rate for Black residents
10.2%Males
7.6%Females
Unemployment rate for American Indian and Alaska Native residents
7.1%Males
Unemployment rate for Asian residents
0.8%Males
3.2%Females
Unemployment rate for other race residents
7.2%Males
6.0%Females
Unemployment rate for two or more race residents
2.1%Males
2.2%Females
Unemployment rate for Hispanic or Latino residents
2.7%Males
5.9%Females
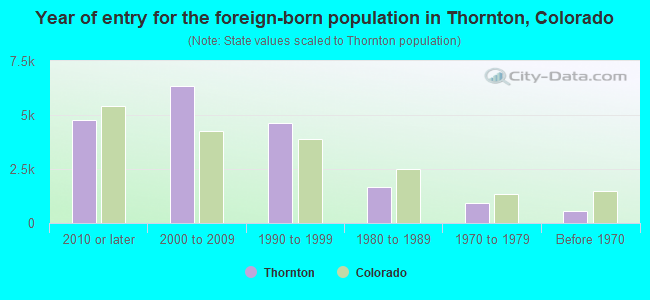
Year of entry for the foreign-born population in Thornton, Colorado
4,7852010 or later
6,3252000 to 2009
4,6191990 to 1999
1,6511980 to 1989
9281970 to 1979
539Before 1970
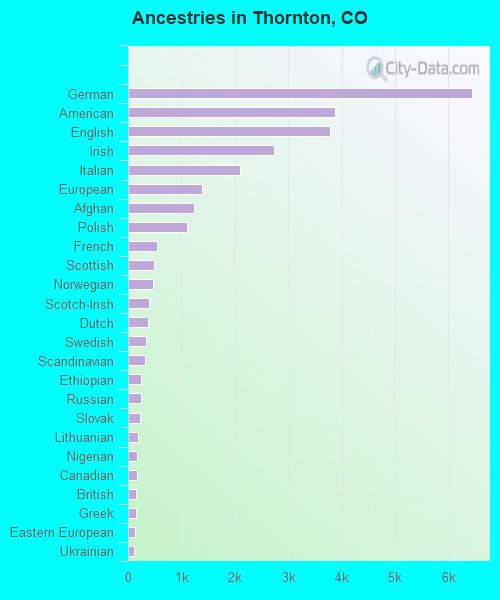
First ancestries reported:
German: 6,439 (9.5%)
American: 3,879 (5.7%)
English: 3,792 (5.6%)
Irish: 2,740 (4.0%)
Italian: 2,091 (3.1%)
European: 1,388 (2.0%)
Afghan: 1,232 (1.8%)
Polish: 1,107 (1.6%)
French: 551 (0.8%)
Scottish: 485 (0.7%)
Norwegian: 462 (0.7%)
Scotch-Irish: 395 (0.6%)
Dutch: 378 (0.6%)
Swedish: 345 (0.5%)
Scandinavian: 311 (0.5%)
Ethiopian: 252 (0.4%)
Russian: 245 (0.4%)
Slovak: 221 (0.3%)
Lithuanian: 187 (0.3%)
Nigerian: 177 (0.3%)
Canadian: 175 (0.3%)
British: 149 (0.2%)
Greek: 141 (0.2%)
Eastern European: 135 (0.2%)
Ukrainian: 115 (0.2%)
Portuguese: 107 (0.2%)
Northern European: 105 (0.2%)
Czech: 98 (0.1%)
Danish: 96 (0.1%)
Welsh: 90 (0.1%)
Iranian: 78 (0.1%)
French Canadian: 76 (0.1%)
Australian: 63 (0.09%)
Arab: 63 (0.09%)
Croatian: 61 (0.09%)
Yugoslavian: 50 (0.07%)
Latvian: 49 (0.07%)
Romanian: 46 (0.07%)
Turkish: 45 (0.07%)
Bulgarian: 43 (0.06%)
Slavic: 41 (0.06%)
Armenian: 33 (0.05%)
Hungarian: 32 (0.05%)
Brazilian: 31 (0.05%)
African: 25 (0.04%)
Maltese: 20 (0.03%)
Belgian: 20 (0.03%)
Iraqi: 17 (0.03%)
Pennsylvania German: 17 (0.03%)
Czechoslovakian: 17 (0.03%)
Swiss: 16 (0.02%)
Lebanese: 12 (0.02%)
Serbian: 10 (0.01%)
Jamaican: 7 (0.01%)
Austrian: 5 (0.01%)
South African: 5 (0.01%)
Bahamian: 5 (0.01%)
Most common places of birth for foreign-born residents (%):
Mexico
Thornton:
56.1% (11,315)
Colorado:
38.3% (209,491)
India
Thornton:
5.0% (1,013)
Colorado:
4.0% (21,689)
Afghanistan
Thornton:
4.3% (869)
Colorado:
0.3% (1,730)
Vietnam
Thornton:
3.6% (721)
Colorado:
3.0% (16,616)
China, excluding Hong Kong and Taiwan
Thornton:
2.6% (528)
Colorado:
3.3% (17,998)
Philippines
Thornton:
2.5% (510)
Colorado:
2.3% (12,342)
Brazil
Thornton:
2.5% (509)
Colorado:
1.0% (5,365)
El Salvador
Thornton:
1.8% (367)
Colorado:
2.2% (12,150)
Poland
Thornton:
1.7% (347)
Colorado:
0.9% (4,772)
Canada
Thornton:
1.5% (309)
Colorado:
2.7% (15,026)
Place of birth for U.S.-born residents:
This state: 74,554
Other state: 49,725
Northeast: 4,034
Midwest: 16,322
South: 9,395
West: 19,974
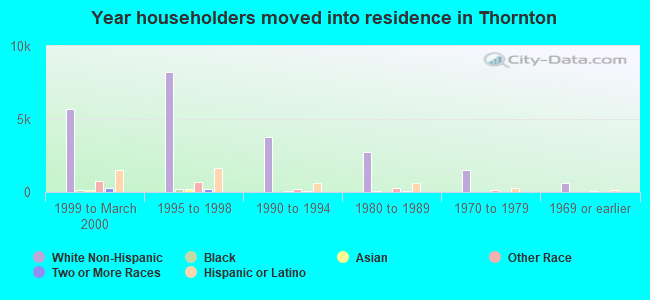
87.3% of Thornton residents lived in the same house 1 years ago. Out of people who lived in different houses, 32.4% lived in this county. Out of people who lived in different counties, 77.5% lived in Colorado.
Thornton:
87.3%
State average:
83.6%
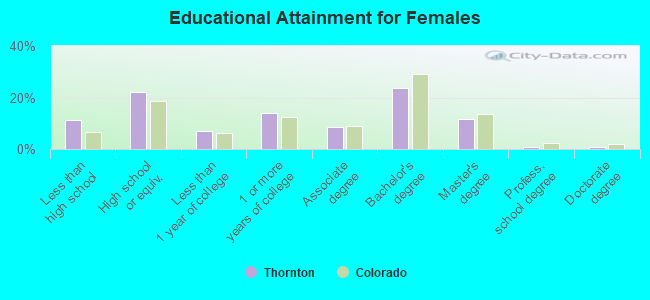
Education attainment for males 25 years and older:
No schooling: 2,035
Nursery to 4th grade: 415
5th and 6th grade: 113
7th and 8th grade: 481
9th grade: 968
10th grade: 331
11th grade: 772
12th grade, no diploma: 1,581
High school graduate (or equivalency): 11,009
Less than 1 year of college: 3,084
Some college more than 1 year, no degree: 6,508
Associate degree: 3,638
Bachelor's degree: 9,605
Master's degree: 3,532
Professional school degree: 204
Doctorate degree: 624
Education attainment for females 25 years and older:
No schooling: 1,619
Nursery to 4th grade: 336
5th and 6th grade: 491
7th and 8th grade: 110
9th grade: 479
10th grade: 670
11th grade: 519
12th grade, no diploma: 1,204
High school graduate (or equivalency): 10,695
Less than 1 year of college: 3,407
Some college more than 1 year, no degree: 6,716
Associate degree: 4,160
Bachelor's degree: 11,423
Master's degree: 5,667
Professional school degree: 428
Doctorate degree: 471
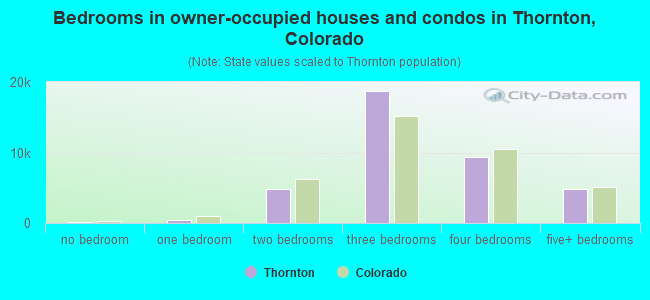
Housing units in structures:
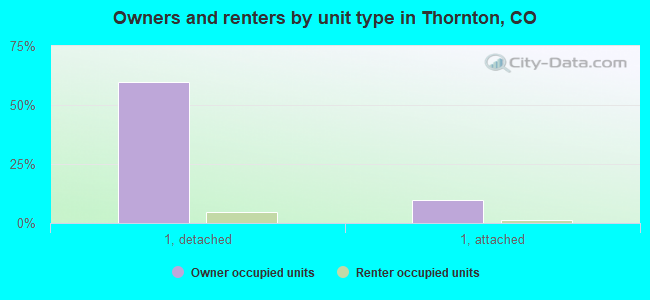
One, detached: 32,660
One, attached: 5,889
Two: 204
3 or 4: 996
5 to 9: 3,061
10 to 19: 2,660
20 to 49: 1,920
50 or more: 1,056
Mobile homes: 2,539
Median worth of mobile homes: $52,000
Housing units lacking complete kitchen facilities in 2022: 0.4%