Tybee Island, GA (Georgia) Houses and Residents
| Tybee Island: | $641,557 |
| Georgia: | $297,400 |
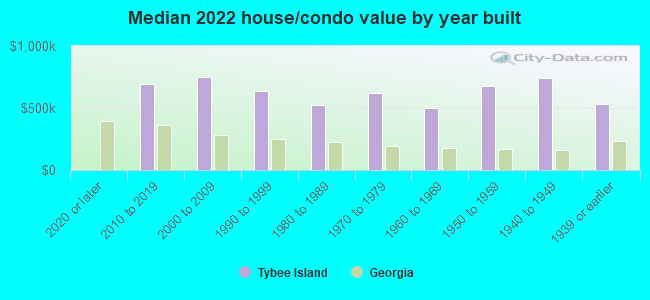
Mean price in 2022:
Detached houses: $988,754
Here: $988,754 State: $376,364 Townhouses or other attached units: $983,986
Here: $983,986 State: $341,709 In 2-unit structures: $519,758
Here: $519,758 State: $269,631 In 5-or-more-unit structures: $300,289
Here: $300,289 State: $370,730
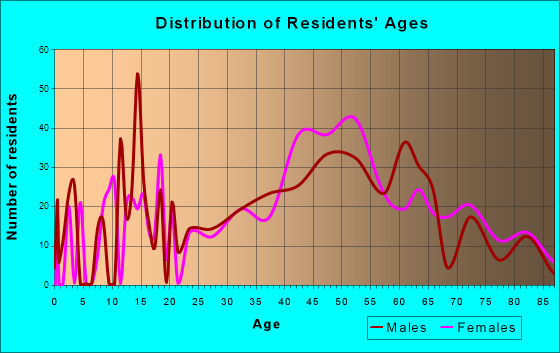
Total population: 3,082 (All urban)
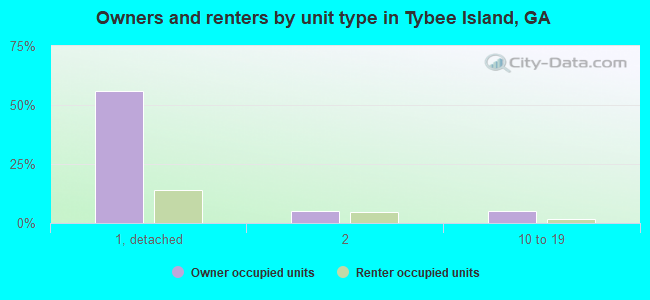
Houses: 3,388 (1,494 occupied: 1,353 owner occupied, 155 renter occupied)
| % of renters here: | 10% |
| State: | 34% |
Housing density: 1,325 houses/condos per square mile
Median price asked for vacant for-sale houses and condos in 2022: $236,388.
Median contract rent in 2022: $1,059 (lower quartile is $934, upper quartile is $1,968)
Median rent asked for vacant for-rent units in 2022: $1,589
Median gross rent in Tybee Island, GA in 2022: $1,298
Housing units in Tybee Island with a mortgage: 539 (69 second mortgage, 0 home equity loan, 65 both second mortgage and home equity loan)
Houses without a mortgage: 47
Median household income for houses/condos with a mortgage: $131,907
Median household income for apartments without a mortgage: $96,617
Median monthly housing costs: $1,140
Compare current foreclosures near Tybee Island, GA:
| Photo | Address | Area | Beds / Baths | Price | Details |
|---|---|---|---|---|---|

|
#1
Polk St
Tybee Island, GA 31328
|
- sq. feet
|
- baths - beds |
show details | |

|
#2
Lovell Ave
Tybee Island, GA 31328
|
- sq. feet
|
- baths - beds |
show details | |

|
#3
Dav Island Rd
Tybee Island, GA 31328
|
- sq. feet
|
- baths - beds |
show details | |

|
#4
5th Ave # B
Tybee Island, GA 31328
|
- sq. feet
|
- baths - beds |
show details | |

|
#5
Springfield Pl
Savannah, GA 31411
|
3,717 sq. feet
|
4 baths 6 beds |
$1,310,400
|
show details |

|
#6
W 52nd St
Savannah, GA 31405
|
1,350 sq. feet
|
1 baths 3 beds |
$97,500
|
show details |

|
#7
W 39th St
Savannah, GA 31401
|
2,256 sq. feet
|
2 baths 5 beds |
show details | |

|
#8
W 44th St
Savannah, GA 31405
|
2,378 sq. feet
|
2 baths 3 beds |
show details | |

|
#9
Salisbury Rd
Savannah, GA 31410
|
2,981 sq. feet
|
2 baths 4 beds |
show details | |

|
#10
W 58th St
Savannah, GA 31405
|
850 sq. feet
|
1 baths 3 beds |
show details |
| Photo | Address | Area | Beds / Baths | Price | Details |
|---|---|---|---|---|---|

|
#11
Debbie St
Savannah, GA 31410
|
1,996 sq. feet
|
2 baths 3 beds |
show details | |

|
#12
Lake Linden Dr
Bluffton, SC 29910
|
1,288 sq. feet
|
2 baths 1 beds |
show details | |

|
#13
Reserve Way
Savannah, GA 31421
|
2,922 sq. feet
|
4 baths 4 beds |
show details | |

|
#14
Ceasar Pl
Hilton Head Island, SC 29926
|
2,090 sq. feet
|
2 baths 4 beds |
show details | |

|
#15
E Park Ave
Savannah, GA 31404
|
1,275 sq. feet
|
1 baths 2 beds |
show details | |

|
#16
Adair St
Savannah, GA 31404
|
1,224 sq. feet
|
1 baths 3 beds |
show details | |

|
#17
E Duffy St
Savannah, GA 31404
|
1,504 sq. feet
|
1 baths 2 beds |
show details | |

|
#18
E 53rd St
Savannah, GA 31404
|
1,290 sq. feet
|
1 baths 3 beds |
show details | |

|
#19
E 49th St
Savannah, GA 31404
|
1,536 sq. feet
|
1 baths 3 beds |
show details | |

|
#20
Terrace St
Savannah, GA 31415
|
672 sq. feet
|
1 baths 2 beds |
show details |
| Photo | Address | Area | Beds / Baths | Price | Details |
|---|---|---|---|---|---|

|
#21
E 53rd St
Savannah, GA 31404
|
1,820 sq. feet
|
1 baths 3 beds |
show details | |

|
#22
W 41st St
Savannah, GA 31415
|
912 sq. feet
|
1 baths 2 beds |
show details | |

|
#23
W 37th St
Savannah, GA 31415
|
1,175 sq. feet
|
1 baths 3 beds |
show details | |

|
#24
Yam Gandy Rd
Savannah, GA 31411
|
2,949 sq. feet
|
2 baths 3 beds |
show details | |

|
#25
Speir St
Savannah, GA 31406
|
1,313 sq. feet
|
1 baths 3 beds |
show details | |

|
#26
Seiler Ave
Savannah, GA 31404
|
1,499 sq. feet
|
1 baths 2 beds |
show details | |

|
#27
E 54th St
Savannah, GA 31404
|
1,644 sq. feet
|
2 baths 4 beds |
show details | |

|
#28
E 51st St
Savannah, GA 31404
|
2,356 sq. feet
|
2 baths 3 beds |
show details | |

|
#29
E 39th St
Savannah, GA 31404
|
2,350 sq. feet
|
2 baths 3 beds |
show details | |

|
#30
E 56th St
Savannah, GA 31404
|
1,092 sq. feet
|
1 baths 3 beds |
show details |
| Photo | Address | Area | Beds / Baths | Price | Details |
|---|---|---|---|---|---|

|
#31
W 52nd St
Savannah, GA 31405
|
1,260 sq. feet
|
2 baths 3 beds |
show details | |

|
#32
E 32nd St
Savannah, GA 31404
|
1,452 sq. feet
|
1 baths 2 beds |
show details | |

|
#33
Kandlewood Dr
Savannah, GA 31406
|
950 sq. feet
|
1 baths 3 beds |
show details | |

|
#34
E 31st St
Savannah, GA 31404
|
1,026 sq. feet
|
1 baths 2 beds |
show details | |

|
#35
Croatan St
Savannah, GA 31406
|
950 sq. feet
|
1 baths 3 beds |
show details | |

|
#36
W 41st St
Savannah, GA 31415
|
1,676 sq. feet
|
1 baths 3 beds |
show details | |

|
#37
Mildred St
Savannah, GA 31405
|
836 sq. feet
|
1 baths 2 beds |
show details | |

|
#38
Delesseps Ave
Savannah, GA 31404
|
1,404 sq. feet
|
2 baths 3 beds |
show details | |

|
#39
Staley Ave
Savannah, GA 31405
|
1,553 sq. feet
|
1 baths 3 beds |
show details | |

|
#40
Eastgate Dr
Savannah, GA 31404
|
1,152 sq. feet
|
1 baths 3 beds |
show details |
| Photo | Address | Area | Beds / Baths | Price | Details |
|---|---|---|---|---|---|

|
#41
Albert St
Savannah, GA 31406
|
1,228 sq. feet
|
2 baths 3 beds |
show details | |

|
#42
Eastgate Dr
Savannah, GA 31404
|
1,260 sq. feet
|
1 baths 4 beds |
show details | |

|
#43
Paradise Dr
Savannah, GA 31406
|
1,549 sq. feet
|
1 baths 3 beds |
show details | |

|
#44
Shirley Dr
Savannah, GA 31404
|
1,530 sq. feet
|
2 baths 3 beds |
show details | |

|
#45
Pinetree Rd
Savannah, GA 31404
|
1,566 sq. feet
|
2 baths 4 beds |
show details | |

|
#46
Mason Dr
Savannah, GA 31404
|
1,164 sq. feet
|
1 baths 3 beds |
show details | |

|
#47
Lorraine Ct
Savannah, GA 31404
|
1,014 sq. feet
|
1 baths 3 beds |
show details | |

|
#48
Marcy Ct
Savannah, GA 31406
|
1,377 sq. feet
|
2 baths 3 beds |
show details | |

|
#49
Oleander Ave
Savannah, GA 31404
|
1,134 sq. feet
|
1 baths 3 beds |
show details | |

|
Check over 1 million property listings on Foreclosure.com!
|
browse all offers | |||


 | Trip to Savannah and Tybee Island suggestions (14 replies) |
| Merritt Condos (8 replies) |
| Tybee Island Fine Me Beach (11 replies) |
| shopping for homes in Savannah (65 replies) |
| Savannah development news (634 replies) |
| Wanting property for rental and future retirement: Tybee Island or Hilton Head (6 replies) |
Median year apartment built: 1980
Household type by relationship:
Households: 3,177- Male householders: 823 (119 living alone), Female householders: 657 (234 living alone)
856 spouses (856 opposite-sex spouses), 65 unmarried partners, (65 opposite-sex unmarried partners), 596 children (561 natural, 0 adopted, 35 stepchildren), 0 grandchildren, 6 brothers or sisters, 8 parents, 0 foster children, 42 other relatives, 4 non-relatives
- In group quarters: 116
Size of family households: 690 2-persons, 284 3-persons, 108 4-persons, 13 5-persons.
Size of nonfamily households: 387 1-person, 34 2-persons.
269 married couples with children.
68 single-parent households (68 men, 0 women).
96.3% of residents of Tybee Island speak English at home.
0.6% of residents speak Spanish at home (100% speak English very well).
4.4% of residents speak other Indo-European language at home (100% speak English very well).
Foreign born population: 109 (3.4%)
(86.2% of them are naturalized citizens)
| Here: | 5.7 |
| State: | 6.8 |
| Here: | 5.1 |
| State: | 4.6 |
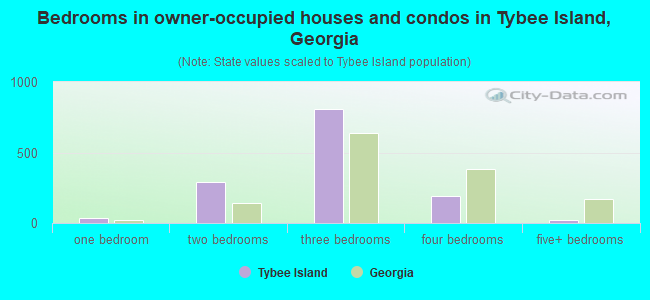
- Bedrooms in owner-occupied houses and condos in Tybee Island, Georgia
- 0no bedroom
- 351 bedroom
- 2912 bedrooms
- 8123 bedrooms
- 1944 bedrooms
- 225+ bedrooms
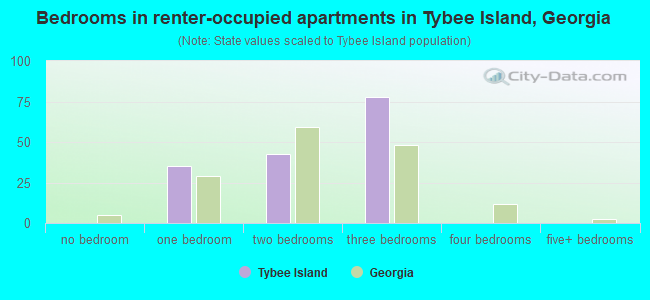
- Bedrooms in renter-occupied apartments in Tybee Island, Georgia
- 0no bedroom
- 351 bedroom
- 422 bedrooms
- 783 bedrooms
- 04 bedrooms
- 05+ bedrooms
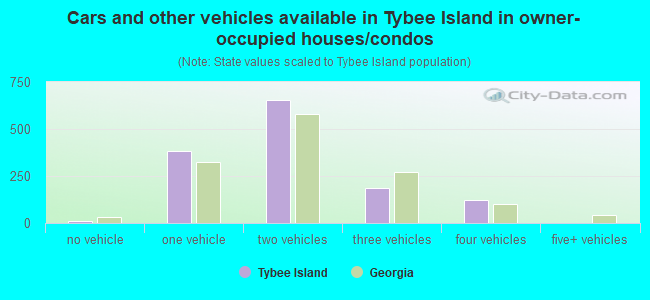
- Cars and other vehicles available in Tybee Island in owner-occupied houses/condos
- 8no vehicle
- 3841 vehicle
- 6522 vehicles
- 1843 vehicles
- 1244 vehicles
- 05+ vehicles
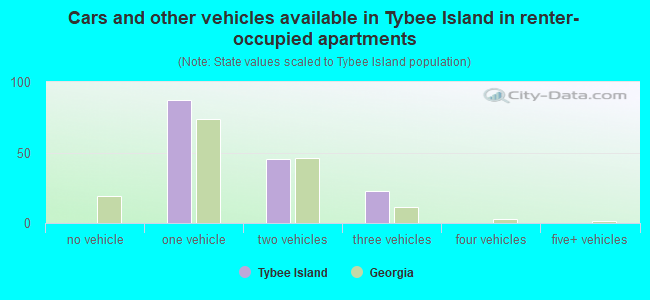
- Cars and other vehicles available in Tybee Island in renter-occupied apartments
- 0no vehicle
- 871 vehicle
- 462 vehicles
- 233 vehicles
- 04 vehicles
- 05+ vehicles
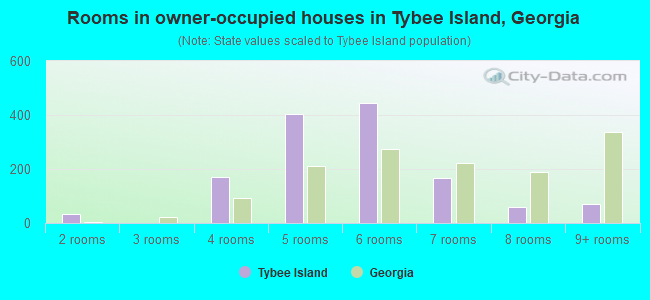
- Rooms in owner-occupied houses in Tybee Island, Georgia
- 01 room
- 352 rooms
- 03 rooms
- 1714 rooms
- 4035 rooms
- 4456 rooms
- 1677 rooms
- 618 rooms
- 719+ rooms
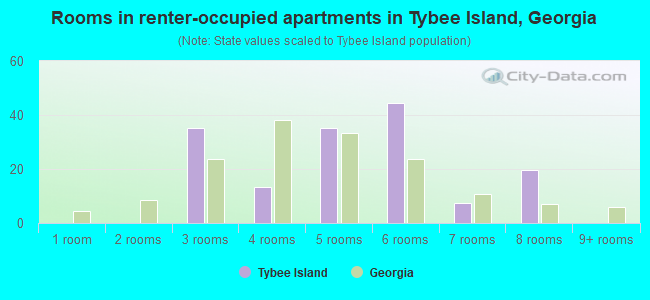
- Rooms in renter-occupied apartments in Tybee Island, Georgia
- 01 room
- 02 rooms
- 353 rooms
- 134 rooms
- 355 rooms
- 456 rooms
- 77 rooms
- 208 rooms
- 09+ rooms
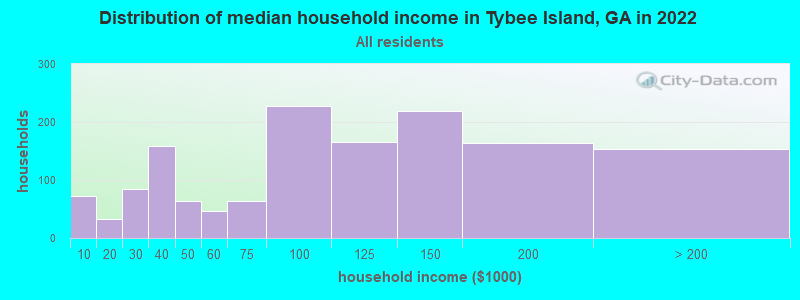
Tybee Island, GA household income distribution

- 72Less than $10,000
- 33$10,000 to $19,999
- 84$20,000 to $29,999
- 159$30,000 to $39,999
- 64$40,000 to $49,999
- 46$50,000 to $59,999
- 64$60,000 to $74,999
- 227$75,000 to $99,999
- 166$100,000 to $124,999
- 219$125,000 to $149,999
- 163$150,000 to $199,999
- 153$200,000 or more
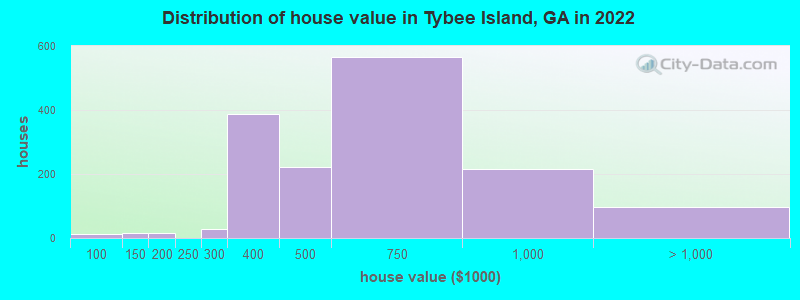
Home value of owner - occupied houses in 2022 in Tybee Island, GA
-
- 13$70,000 to $79,999
- 16$125,000 to $149,999
- 16$175,000 to $199,999
- 26$250,000 to $299,999
- 386$300,000 to $399,999
- 221$400,000 to $499,999
- 565$500,000 to $749,999
- 216$750,000 to $999,999
- 66$1,000,000 to $1,499,999
- 32$2,000,000 or more
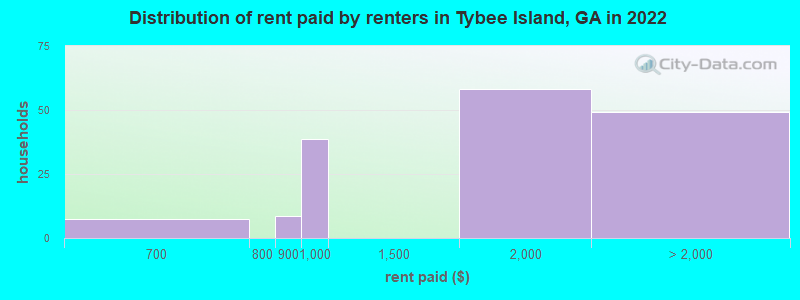
Rent paid by renters in 2022 in Tybee Island, GA
-
- 7$650 to $699
- 8$800 to $899
- 38$900 to $999
- 58$1,500 to $1,999
- 24$2,500 to $2,999
- 24No cash rent
Percentage of workers working in this county: 92.8%
Number of people working at home: 339 (27.7% of all workers)
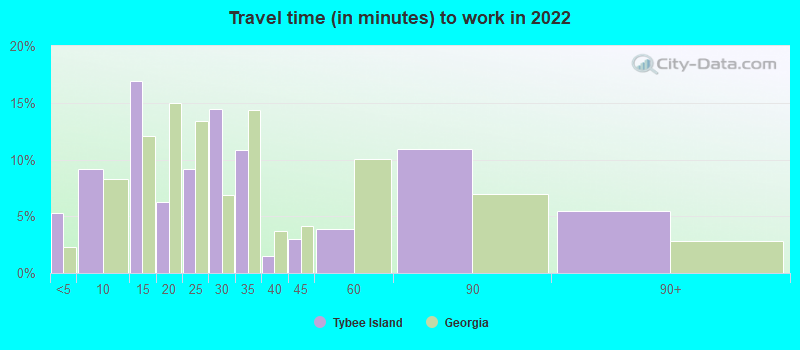
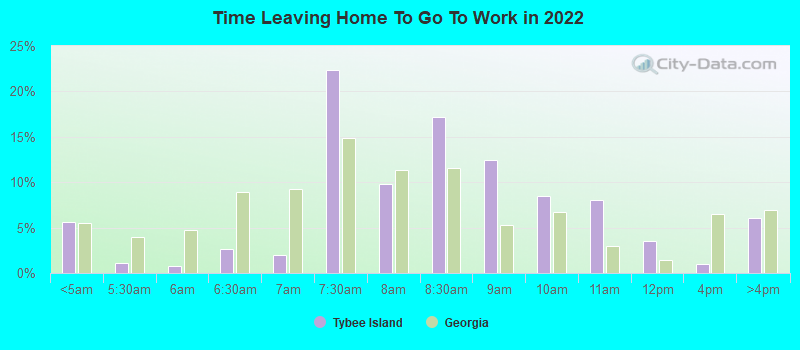
Travel time to work (commute)
- Less than 5 minutes: 40
- 5 to 9 minutes: 126
- 10 to 14 minutes: 83
- 15 to 19 minutes: 39
- 20 to 24 minutes: 20
- 25 to 29 minutes: 31
- 30 to 34 minutes: 359
- 35 to 39 minutes: 107
- 40 to 44 minutes: 45
- 45 to 59 minutes: 59
- 60 to 89 minutes: 16
- 90 or more minutes: 76
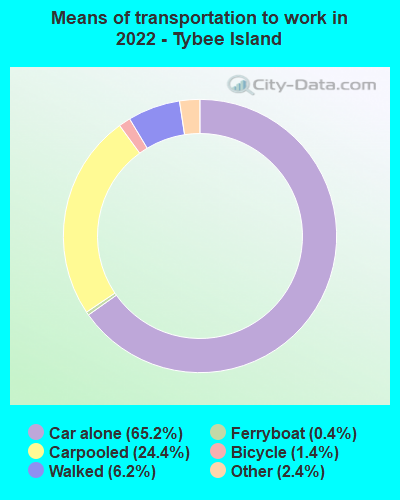
Means of transportation to work:
- Drove a car alone: 770 (52.2%)
- Carpooled: 359 (24.3%)
- Ferryboat: 5 (0.3%)
- Taxi: 14 (0.9%)
- Bicycle: 18 (1.2%)
- Walked: 62 (4.2%)
- Worked at home: 339 (23.0%)
- Unemployment by race in 2022
- Unemployment rate for White non-Hispanic residents
- 0.9%Males
- 7.2%Females
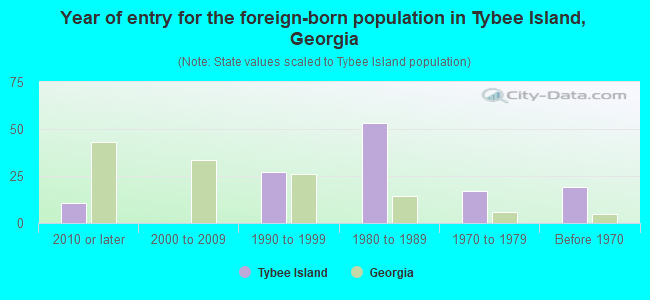
- Year of entry for the foreign-born population in Tybee Island, Georgia
- 112010 or later
- 02000 to 2009
- 271990 to 1999
- 531980 to 1989
- 171970 to 1979
- 19Before 1970
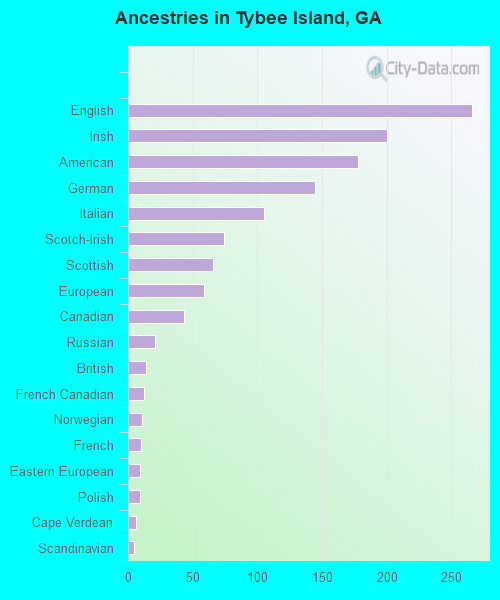
First ancestries reported:
- English: 266 (19.4%)
- Irish: 200 (14.6%)
- American: 178 (13.0%)
- German: 145 (10.6%)
- Italian: 105 (7.7%)
- Scotch-Irish: 74 (5.4%)
- Scottish: 66 (4.8%)
- European: 59 (4.3%)
- Canadian: 43 (3.1%)
- Russian: 21 (1.5%)
- British: 14 (1.0%)
- French Canadian: 12 (0.9%)
- Norwegian: 11 (0.8%)
- French: 10 (0.7%)
- Eastern European: 9 (0.7%)
- Polish: 9 (0.7%)
- Cape Verdean: 6 (0.4%)
- Scandinavian: 5 (0.4%)
Most common places of birth for foreign-born residents (%):
| Tybee Island: | 29.8% (34) |
| Georgia: | 9.2% (103,325) |
| Tybee Island: | 20.2% (23) |
| Georgia: | 1.7% (18,651) |
| Tybee Island: | 13.2% (15) |
| Georgia: | 0.1% (1,138) |
| Tybee Island: | 11.4% (13) |
| Georgia: | 1.6% (17,851) |
| Tybee Island: | 9.6% (11) |
| Georgia: | 0.2% (1,849) |
| Tybee Island: | 8.8% (10) |
| Georgia: | 0.8% (9,101) |
Place of birth for U.S.-born residents:
- This state: 1,494
- Other state: 1,606
- Northeast: 381
- Midwest: 452
- South: 682
- West: 98
91.5% of Tybee Island residents lived in the same house 1 years ago.
Out of people who lived in different houses, 18.4% lived in this county.
Out of people who lived in different counties, 60.9% lived in Georgia.
| Tybee Island: | 91.5% |
| State average: | 86.6% |
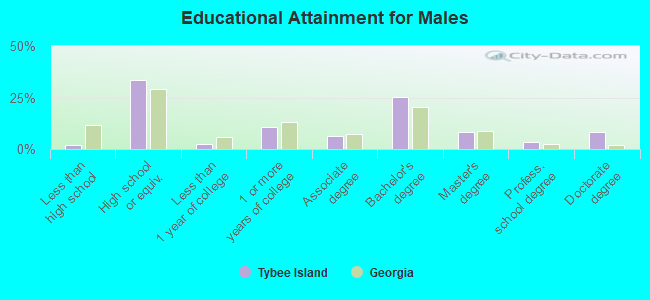
Education attainment for males 25 years and older:
- No schooling: 0
- Nursery to 4th grade: 0
- 5th and 6th grade: 0
- 7th and 8th grade: 0
- 9th grade: 0
- 10th grade: 7
- 11th grade: 8
- 12th grade, no diploma: 9
- High school graduate (or equivalency): 421
- Less than 1 year of college: 32
- Some college more than 1 year, no degree: 138
- Associate degree: 80
- Bachelor's degree: 319
- Master's degree: 103
- Professional school degree: 43
- Doctorate degree: 104
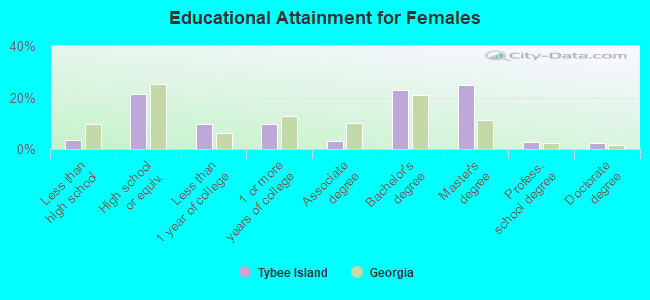
Education attainment for females 25 years and older:
- No schooling: 0
- Nursery to 4th grade: 0
- 5th and 6th grade: 0
- 7th and 8th grade: 5
- 9th grade: 0
- 10th grade: 12
- 11th grade: 35
- 12th grade, no diploma: 0
- High school graduate (or equivalency): 314
- Less than 1 year of college: 143
- Some college more than 1 year, no degree: 140
- Associate degree: 44
- Bachelor's degree: 338
- Master's degree: 365
- Professional school degree: 42
- Doctorate degree: 32
Housing units in structures:
- One, detached: 2,291
- One, attached: 210
- Two: 208
- 3 or 4: 159
- 5 to 9: 113
- 10 to 19: 74
- 20 to 49: 171
- 50 or more: 150
- Mobile homes: 7
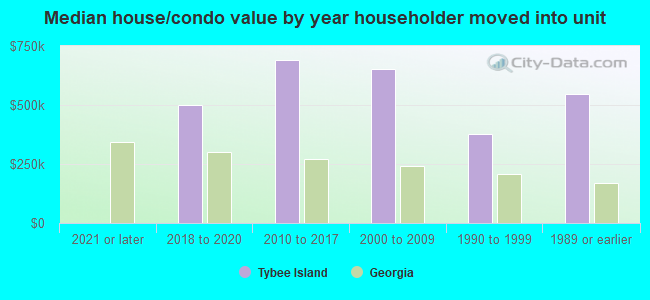
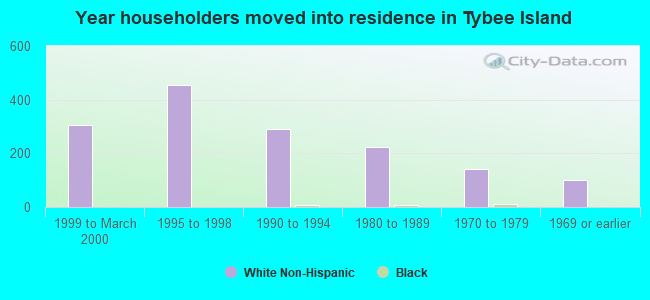
House/condo owner moved in on average 8 years ago
Renter moved in on average 7 years ago
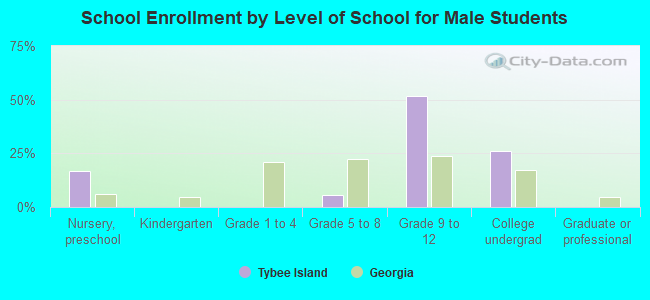
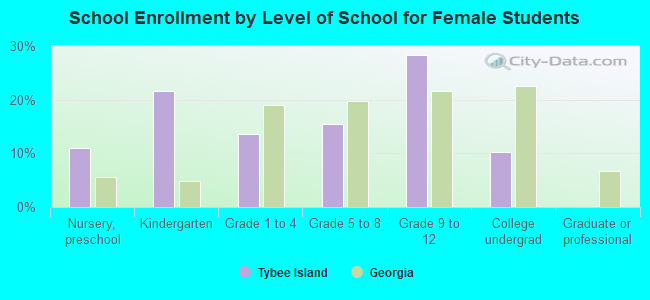
Private vs. public school enrollment:
| Here: | 38.5% |
| Georgia: | 12.1% |
| Here: | 12.6% |
| Georgia: | 10.8% |
| Here: | 49.3% |
| Georgia: | 17.1% |