Union Springs, NY (New York) Houses and Residents
| Union Springs: | $159,355 |
| New York: | $400,400 |
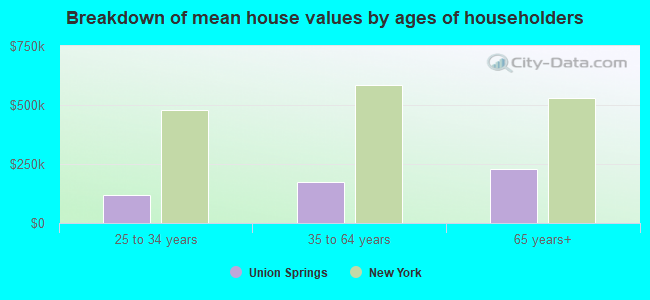
Mean price in 2022:
Detached houses: $184,361
Here: $184,361 State: $476,719 Mobile homes: $33,004
Here: $33,004 State: $88,925
Total population: 1,188 (Urban population: 0, Rural population: 1,067 (6 farm, 1,061 nonfarm))
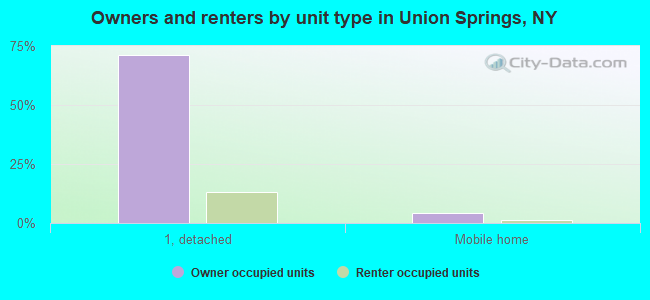
Houses: 529 (472 occupied: 366 owner occupied, 122 renter occupied)
| % of renters here: | 25% |
| State: | 46% |
Housing density: 294 houses/condos per square mile
Median price asked for vacant for-sale houses and condos in 2022 in this county: $146,411.
Median contract rent in 2022: $559 (lower quartile is $314, upper quartile is $687)
Median rent asked for vacant for-rent units in 2022: $510
Median gross rent in Union Springs, NY in 2022: $694
Housing units in Union Springs with a mortgage: 261 (25 second mortgage, 0 home equity loan, 20 both second mortgage and home equity loan)
Houses without a mortgage: 0
Median household income for houses/condos with a mortgage: $125,547
Median household income for apartments without a mortgage: $78,738
Median monthly housing costs: $1,047
Compare current foreclosures near Union Springs, NY:
| Photo | Address | Area | Beds / Baths | Price | Details |
|---|---|---|---|---|---|

|
#1
Arnold St
Union Springs, NY 13160
|
- sq. feet
|
- baths - beds |
show details | |

|
#2
Atwater Rd
King Ferry, NY 13081
|
1,332 sq. feet
|
1 baths 3 beds |
$142,500
|
show details |

|
#3
Oak Dr
Union Springs, NY 13160
|
- sq. feet
|
- baths - beds |
show details | |

|
#4
State Route 414
Seneca Falls, NY 13148
|
1,458 sq. feet
|
1 baths 3 beds |
$24,900
|
show details |

|
#5
Owasco Rd
Auburn, NY 13021
|
- sq. feet
|
1 baths 3 beds |
show details | |

|
#6
E Elizabeth St
Waterloo, NY 13165
|
1,306 sq. feet
|
1 baths 3 beds |
show details | |

|
#7
Hockeborne Ave
Auburn, NY 13021
|
- sq. feet
|
- baths - beds |
$54,900
|
show details |

|
#8
Ross St
Auburn, NY 13021
|
1,100 sq. feet
|
1 baths 3 beds |
show details | |

|
#9
N Seneca St
Waterloo, NY 13165
|
1,266 sq. feet
|
1 baths 2 beds |
show details | |

|
#10
Mattie St
Auburn, NY 13021
|
1,408 sq. feet
|
1 baths 2 beds |
show details |
| Photo | Address | Area | Beds / Baths | Price | Details |
|---|---|---|---|---|---|

|
#11
Walnut St N
Waterloo, NY 13165
|
2,601 sq. feet
|
2 baths 4 beds |
show details | |

|
#12
Van Anden St
Auburn, NY 13021
|
1,860 sq. feet
|
2 baths 4 beds |
show details | |

|
#13
Breen Ln
Waterloo, NY 13165
|
1,104 sq. feet
|
1 baths 2 beds |
show details | |

|
#14
County House Rd
Auburn, NY 13021
|
1,575 sq. feet
|
2 baths 2 beds |
show details | |

|
#15
N Street Rd
Auburn, NY 13021
|
2,700 sq. feet
|
3 baths 3 beds |
show details | |

|
#16
Sheldon Ave
Auburn, NY 13021
|
1,294 sq. feet
|
2 baths 3 beds |
show details | |

|
#17
Holley St
Auburn, NY 13021
|
1,064 sq. feet
|
1 baths 3 beds |
show details | |

|
#18
Long Hill Rd
Moravia, NY 13118
|
1,764 sq. feet
|
2 baths 3 beds |
show details | |

|
#19
County Road 132
Ovid, NY 14521
|
1,684 sq. feet
|
1 baths 4 beds |
show details | |

|
#20
State Route 318
Phelps, NY 14532
|
1,396 sq. feet
|
2 baths 4 beds |
show details |
| Photo | Address | Area | Beds / Baths | Price | Details |
|---|---|---|---|---|---|

|
#21
State Route 14
Phelps, NY 14532
|
1,317 sq. feet
|
1 baths 4 beds |
show details | |

|
#22
Exchange St
Geneva, NY 14456
|
1,768 sq. feet
|
1 baths 3 beds |
show details | |

|
#23
Wadsworth St
Geneva, NY 14456
|
2,048 sq. feet
|
2 baths 4 beds |
show details | |

|
#24
Wadsworth St
Geneva, NY 14456
|
1,225 sq. feet
|
1 baths 4 beds |
show details | |

|
#25
Lewis St
Geneva, NY 14456
|
1,666 sq. feet
|
1 baths 2 beds |
show details | |

|
#26
State Route 90
Genoa, NY 13071
|
2,048 sq. feet
|
2 baths 4 beds |
show details | |

|
#27
Gates Ave
Geneva, NY 14456
|
1,440 sq. feet
|
2 baths 2 beds |
show details | |

|
#28
N Genesee St
Geneva, NY 14456
|
1,888 sq. feet
|
1 baths 3 beds |
show details | |

|
#29
N Genesee St
Geneva, NY 14456
|
2,724 sq. feet
|
2 baths 4 beds |
show details | |

|
#30
Whites Pt
Geneva, NY 14456
|
1,463 sq. feet
|
2 baths 3 beds |
show details |
| Photo | Address | Area | Beds / Baths | Price | Details |
|---|---|---|---|---|---|

|
#31
Castle St
Geneva, NY 14456
|
1,570 sq. feet
|
1 baths 4 beds |
show details | |

|
#32
Cortland St
Geneva, NY 14456
|
1,146 sq. feet
|
1 baths 2 beds |
show details | |

|
#33
Monroe St
Geneva, NY 14456
|
1,344 sq. feet
|
1 baths 3 beds |
show details | |

|
#34
Pulteney St
Geneva, NY 14456
|
1,809 sq. feet
|
2 baths 3 beds |
show details | |

|
#35
N Exchange St
Geneva, NY 14456
|
1,708 sq. feet
|
2 baths 4 beds |
show details | |

|
#36
Pulteney St
Geneva, NY 14456
|
2,082 sq. feet
|
2 baths 4 beds |
show details | |

|
#37
Milton St
Geneva, NY 14456
|
2,484 sq. feet
|
2 baths 4 beds |
show details | |

|
#38
Hogarth Ave
Geneva, NY 14456
|
2,096 sq. feet
|
2 baths 4 beds |
show details | |

|
#39
Hogarth Ave
Geneva, NY 14456
|
1,678 sq. feet
|
2 baths 3 beds |
show details | |

|
#40
Tillman St
Geneva, NY 14456
|
2,228 sq. feet
|
2 baths 5 beds |
show details |
| Photo | Address | Area | Beds / Baths | Price | Details |
|---|---|---|---|---|---|

|
#41
Hogarth Ave
Geneva, NY 14456
|
1,296 sq. feet
|
1 baths 3 beds |
show details | |

|
#42
Center St
Geneva, NY 14456
|
1,364 sq. feet
|
1 baths 3 beds |
show details | |

|
#43
Gates Ave
Geneva, NY 14456
|
1,682 sq. feet
|
2 baths 3 beds |
show details | |

|
#44
Exchange St
Geneva, NY 14456
|
1,527 sq. feet
|
1 baths 4 beds |
show details | |

|
#45
Hogarth Ave
Geneva, NY 14456
|
1,412 sq. feet
|
1 baths 3 beds |
show details | |

|
#46
Geneva St
Geneva, NY 14456
|
2,268 sq. feet
|
2 baths 4 beds |
show details | |

|
#47
Center St
Geneva, NY 14456
|
1,410 sq. feet
|
1 baths 3 beds |
show details | |

|
#48
North St
Geneva, NY 14456
|
1,248 sq. feet
|
1 baths 3 beds |
show details | |

|
#49
North St
Geneva, NY 14456
|
1,280 sq. feet
|
1 baths 4 beds |
show details | |

|
Check over 1 million property listings on Foreclosure.com!
|
browse all offers | |||


 | Auburn area development, events, news, etc. (252 replies) |
| Asian communities in Upstate NY (593 replies) |
| smaller Upstate NY cities and towns/African American communities (5960 replies) |
| Downstate counties have highest rates of students in private schools. Check your district (3 replies) |
| Best places to live in finger lakes area (59 replies) |
| relocating to Auburn, NY - got a few questions... (3 replies) |
Median year apartment built: 1973
Household type by relationship:
Households: 1,260- Male householders: 202 (48 living alone), Female householders: 260 (89 living alone)
261 spouses (261 opposite-sex spouses), 27 unmarried partners, (21 opposite-sex unmarried partners), 396 children (323 natural, 69 adopted, 2 stepchildren), 31 grandchildren, 2 brothers or sisters, 9 parents, 0 foster children, 7 other relatives, 20 non-relatives
- In group quarters: 37
Size of family households: 118 2-persons, 44 3-persons, 99 4-persons, 10 5-persons, 14 6-persons.
Size of nonfamily households: 168 1-person, 13 2-persons, 4 3-persons, 3 5-persons.
206 married couples with children.
16 single-parent households (5 men, 11 women).
97.5% of residents of Union Springs speak English at home.
1.8% of residents speak Spanish at home (91% speak English very well, 9% speak English well).
0.4% of residents speak other language at home (100% speak English very well).
Foreign born population: 13 (1.0%)
(76.9% of them are naturalized citizens)
| Here: | 7.0 |
| State: | 6.3 |
| Here: | 5.3 |
| State: | 3.8 |
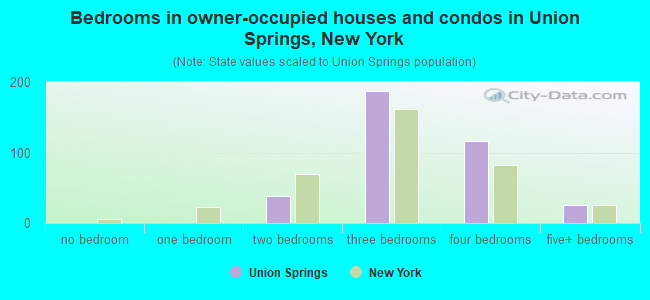
- Bedrooms in owner-occupied houses and condos in Union Springs, New York
- 0no bedroom
- 01 bedroom
- 382 bedrooms
- 1873 bedrooms
- 1164 bedrooms
- 255+ bedrooms
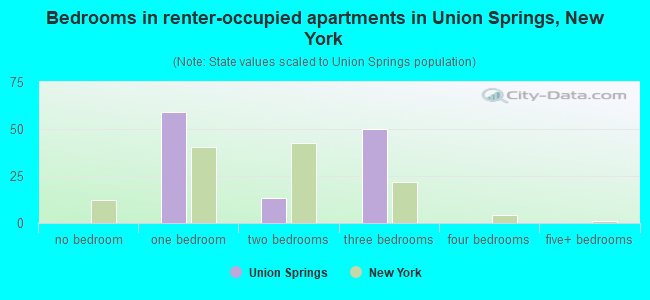
- Bedrooms in renter-occupied apartments in Union Springs, New York
- 0no bedroom
- 591 bedroom
- 142 bedrooms
- 503 bedrooms
- 04 bedrooms
- 05+ bedrooms
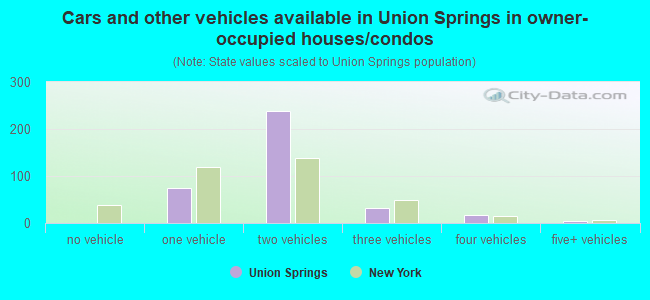
- Cars and other vehicles available in Union Springs in owner-occupied houses/condos
- 0no vehicle
- 751 vehicle
- 2382 vehicles
- 323 vehicles
- 174 vehicles
- 55+ vehicles
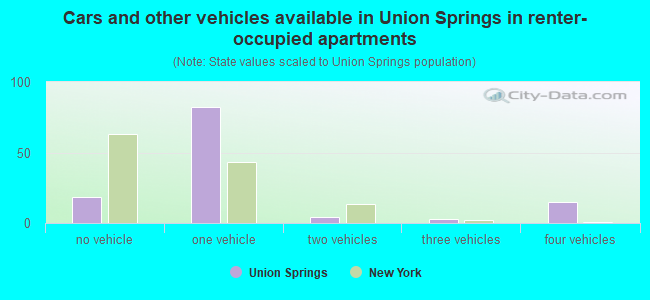
- Cars and other vehicles available in Union Springs in renter-occupied apartments
- 19no vehicle
- 821 vehicle
- 42 vehicles
- 33 vehicles
- 154 vehicles
- 05+ vehicles
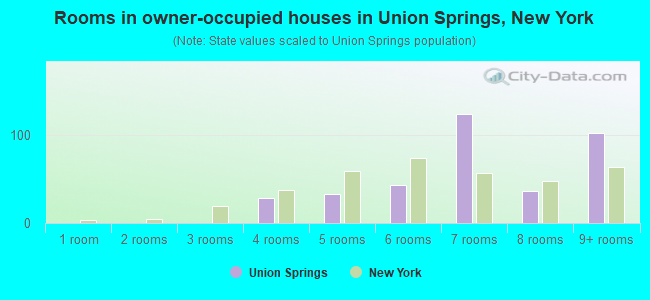
- Rooms in owner-occupied houses in Union Springs, New York
- 01 room
- 02 rooms
- 03 rooms
- 284 rooms
- 335 rooms
- 436 rooms
- 1247 rooms
- 368 rooms
- 1039+ rooms
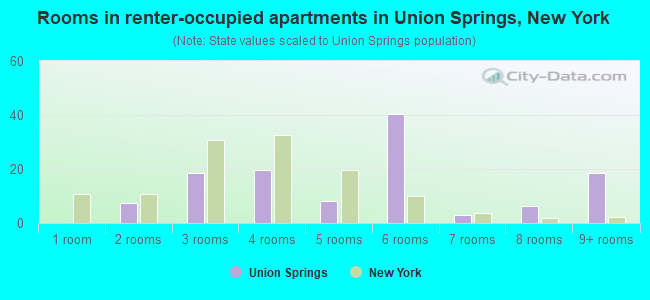
- Rooms in renter-occupied apartments in Union Springs, New York
- 01 room
- 72 rooms
- 193 rooms
- 204 rooms
- 85 rooms
- 416 rooms
- 37 rooms
- 68 rooms
- 199+ rooms
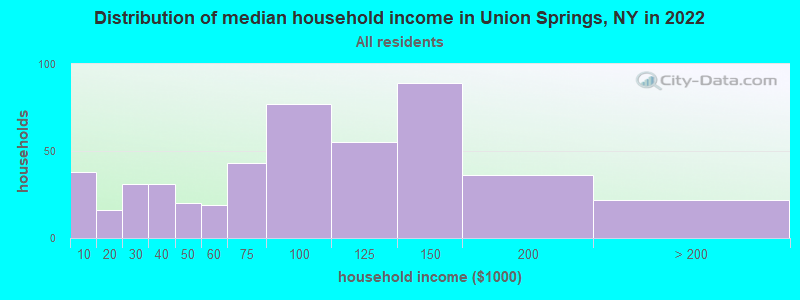
Union Springs, NY household income distribution

- 38Less than $10,000
- 16$10,000 to $19,999
- 31$20,000 to $29,999
- 31$30,000 to $39,999
- 20$40,000 to $49,999
- 19$50,000 to $59,999
- 43$60,000 to $74,999
- 77$75,000 to $99,999
- 55$100,000 to $124,999
- 89$125,000 to $149,999
- 36$150,000 to $199,999
- 22$200,000 or more
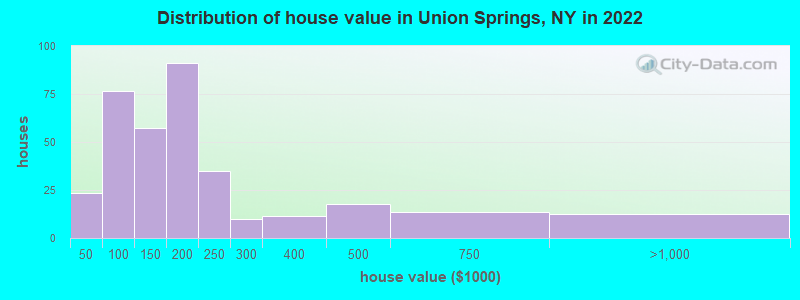
Home value of owner - occupied houses in 2022 in Union Springs, NY
-
- 4$10,000 to $14,999
- 14$15,000 to $19,999
- 4$20,000 to $24,999
- 12$50,000 to $59,999
- 11$60,000 to $69,999
- 14$70,000 to $79,999
- 19$80,000 to $89,999
- 18$90,000 to $99,999
- 20$100,000 to $124,999
- 36$125,000 to $149,999
- 77$150,000 to $174,999
- 13$175,000 to $199,999
- 34$200,000 to $249,999
- 10$250,000 to $299,999
- 11$300,000 to $399,999
- 17$400,000 to $499,999
- 13$500,000 to $749,999
- 12$750,000 to $999,999
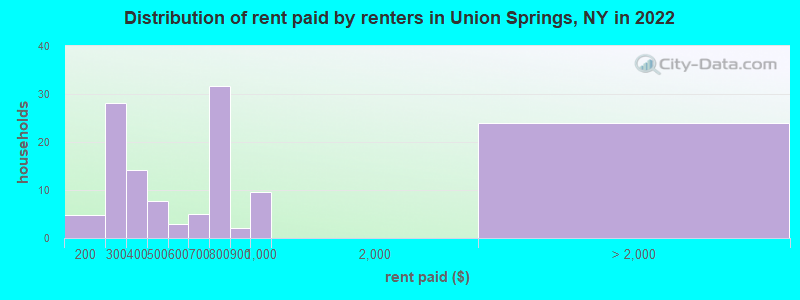
Rent paid by renters in 2022 in Union Springs, NY
-
- 4$150 to $199
- 13$200 to $249
- 14$250 to $299
- 14$350 to $399
- 7$400 to $449
- 2$550 to $599
- 4$650 to $699
- 25$700 to $749
- 5$750 to $799
- 2$800 to $899
- 9$900 to $999
- 6$2,000 to $2,499
- 17No cash rent
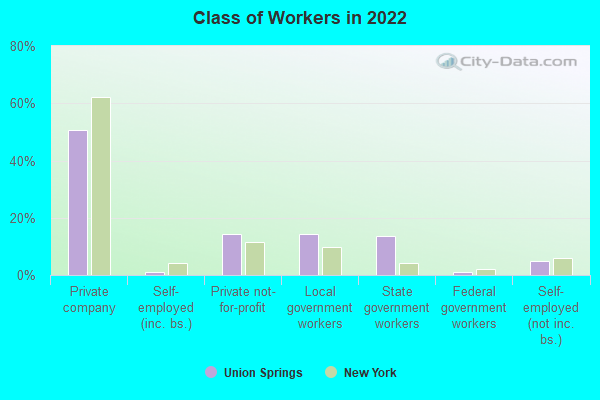
Percentage of workers working in this county: 81.6%
Number of people working at home: 101 (17.3% of all workers)
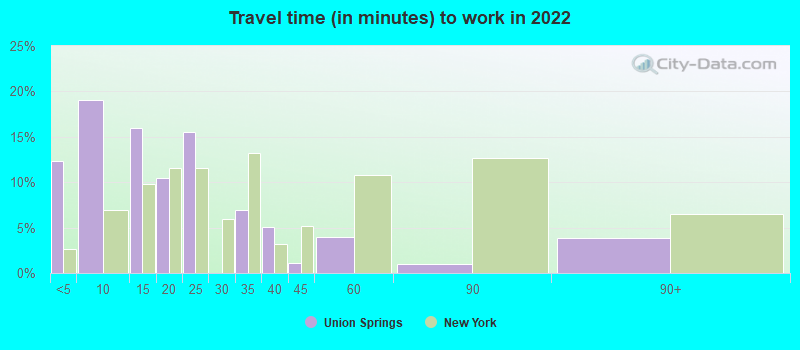
Travel time to work (commute)
- Less than 5 minutes: 49
- 5 to 9 minutes: 61
- 10 to 14 minutes: 64
- 15 to 19 minutes: 69
- 20 to 24 minutes: 95
- 25 to 29 minutes: 27
- 30 to 34 minutes: 24
- 35 to 39 minutes: 8
- 40 to 44 minutes: 3
- 45 to 59 minutes: 40
- 60 to 89 minutes: 37
- 90 or more minutes: 5
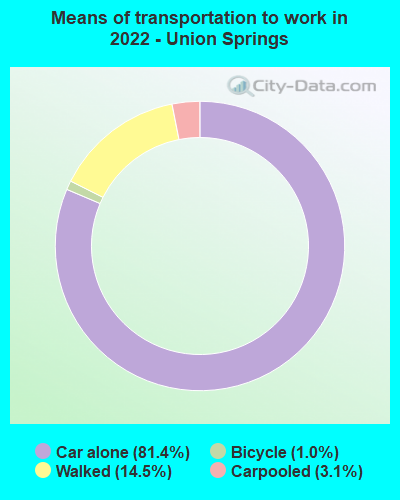
Means of transportation to work:
- Drove a car alone: 403 (68.3%)
- Carpooled: 16 (2.7%)
- Bicycle: 5 (0.8%)
- Walked: 72 (12.2%)
- Worked at home: 101 (17.1%)
- Unemployment by race in 2022
- Unemployment rate for White non-Hispanic residents
- 2.1%Males
- 6.6%Females
- Unemployment rate for Hispanic or Latino residents
- 4.4%Males
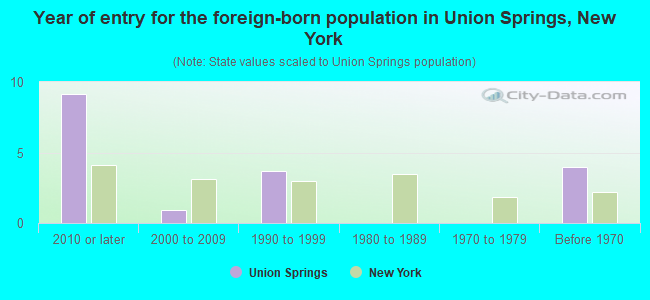
- Year of entry for the foreign-born population in Union Springs, New York
- 92010 or later
- 12000 to 2009
- 41990 to 1999
- 01980 to 1989
- 01970 to 1979
- 4Before 1970
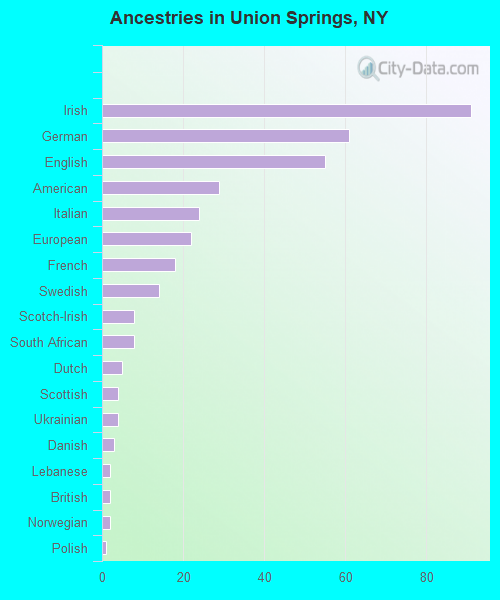
First ancestries reported:
- Irish: 91 (20.5%)
- German: 61 (13.7%)
- English: 55 (12.4%)
- American: 29 (6.5%)
- Italian: 24 (5.4%)
- European: 22 (5.0%)
- French: 18 (4.1%)
- Swedish: 14 (3.2%)
- Scotch-Irish: 8 (1.8%)
- South African: 8 (1.8%)
- Dutch: 5 (1.1%)
- Scottish: 4 (0.9%)
- Ukrainian: 4 (0.9%)
- Danish: 3 (0.7%)
- Lebanese: 2 (0.5%)
- British: 2 (0.5%)
- Norwegian: 2 (0.5%)
- Polish: 1 (0.2%)
Most common places of birth for foreign-born residents (%):
| Union Springs: | 41.7% (5) |
| New York: | 0.2% (8,010) |
| Union Springs: | 25.0% (3) |
| New York: | 1.7% (75,802) |
| Union Springs: | 16.7% (2) |
| New York: | 0.3% (11,831) |
| Union Springs: | 8.3% (1) |
| New York: | 4.8% (214,559) |
Place of birth for U.S.-born residents:
- This state: 964
- Other state: 210
- Northeast: 98
- Midwest: 8
- South: 73
- West: 12
94.6% of Union Springs residents lived in the same house 1 years ago.
Out of people who lived in different houses, 37.5% lived in this county.
Out of people who lived in different counties, 80.0% lived in New York.
| Union Springs: | 94.6% |
| State average: | 89.6% |
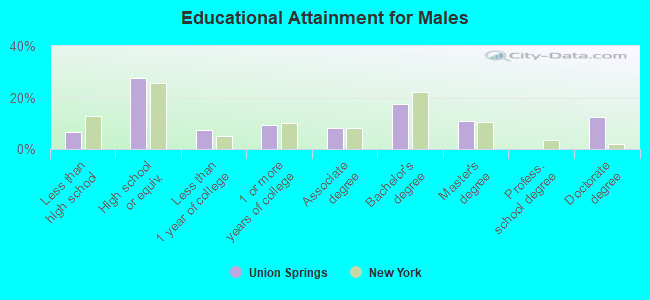
Education attainment for males 25 years and older:
- No schooling: 6
- Nursery to 4th grade: 0
- 5th and 6th grade: 0
- 7th and 8th grade: 3
- 9th grade: 4
- 10th grade: 0
- 11th grade: 2
- 12th grade, no diploma: 14
- High school graduate (or equivalency): 118
- Less than 1 year of college: 31
- Some college more than 1 year, no degree: 40
- Associate degree: 35
- Bachelor's degree: 74
- Master's degree: 47
- Professional school degree: 0
- Doctorate degree: 54
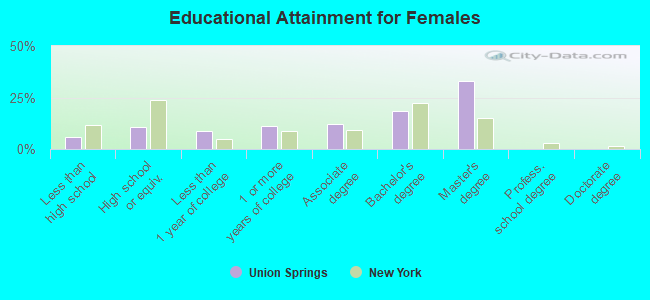
Education attainment for females 25 years and older:
- No schooling: 11
- Nursery to 4th grade: 0
- 5th and 6th grade: 0
- 7th and 8th grade: 7
- 9th grade: 1
- 10th grade: 0
- 11th grade: 3
- 12th grade, no diploma: 5
- High school graduate (or equivalency): 51
- Less than 1 year of college: 41
- Some college more than 1 year, no degree: 52
- Associate degree: 57
- Bachelor's degree: 86
- Master's degree: 154
- Professional school degree: 0
- Doctorate degree: 0
Housing units in structures:
- One, detached: 454
- Two: 3
- 3 or 4: 6
- 5 to 9: 7
- 20 to 49: 28
- 50 or more: 3
- Mobile homes: 28
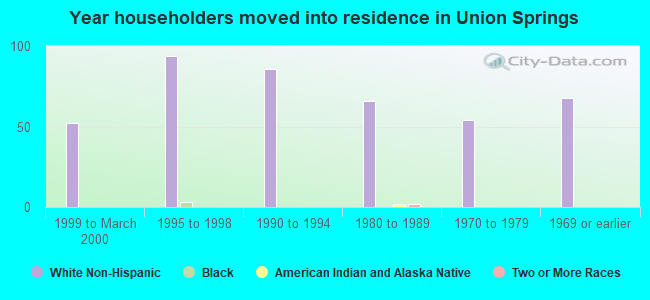
House/condo owner moved in on average 15 years ago
Renter moved in on average 9 years ago
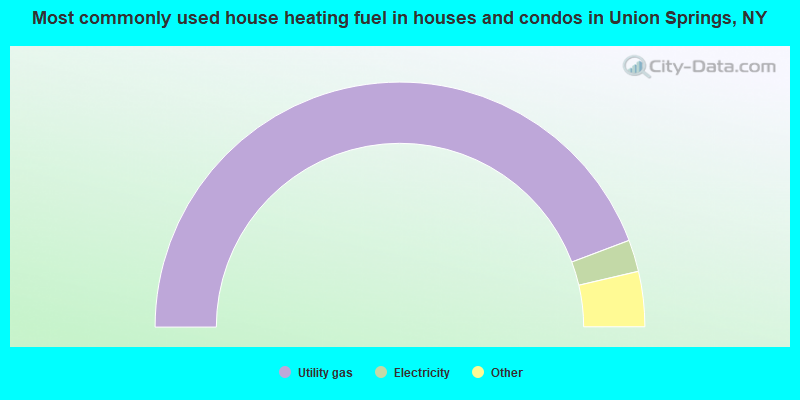
- 88.7%Utility gas
- 4.2%Electricity
- 3.1%Bottled, tank, or LP gas
- 2.8%Wood
- 1.1%Coal or coke
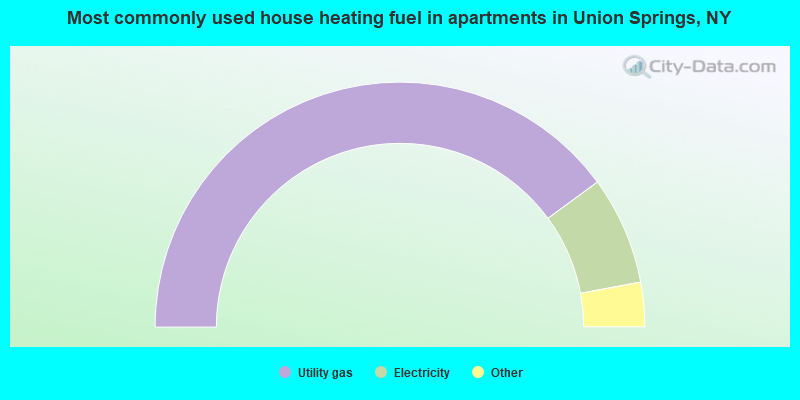
- 80.5%Utility gas
- 14.4%Electricity
- 2.5%Bottled, tank, or LP gas
- 2.5%Wood
Private vs. public school enrollment:
| Here: | 0.0% |
| New York: | 15.6% |
| Here: | 36.0% |
| New York: | 15.0% |
| Here: | 73.5% |
| New York: | 39.2% |