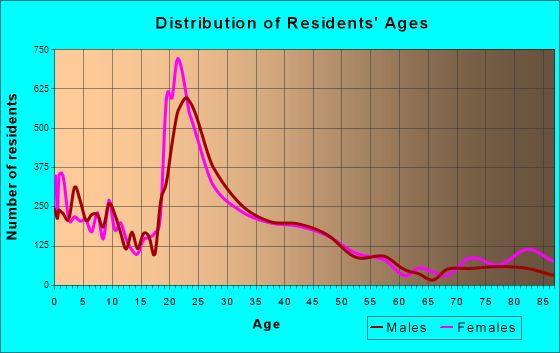
University, FL (Florida) Houses and Residents
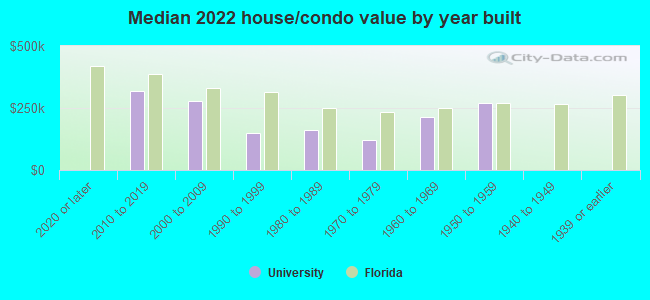
| University: | $175,923 |
| Florida: | $354,100 |
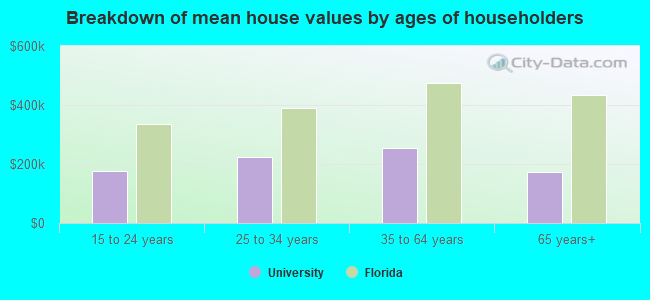
Mean price in 2022:
Detached houses: $247,884
Here: $247,884 State: $500,941 Townhouses or other attached units: $1,453,123
Here: $1,453,123 State: $370,869 In 2-unit structures: $75,064
Here: $75,064 State: $423,188 In 3-to-4-unit structures: $91,478
Here: $91,478 State: $309,944 In 5-or-more-unit structures: $119,422
Here: $119,422 State: $447,145 Mobile homes: $87,923
Here: $87,923 State: $113,202
Total population: 41,163 (Urban population: 30,681, Rural population: 0)
Houses: 23,923 (21,143 occupied: 2,936 owner occupied, 18,295 renter occupied)
| % of renters here: | 86% |
| State: | 33% |
Housing density: 6,181 houses/condos per square mile
Median price asked for vacant for-sale houses and condos in 2022: $97,273.
Median contract rent in 2022: $1,088 (lower quartile is $860, upper quartile is $1,346)
Median rent asked for vacant for-rent units in 2022: $1,629
Median gross rent in University, FL in 2022: $1,195
Housing units in University with a mortgage: 1,400 (83 second mortgage, 0 home equity loan, 45 both second mortgage and home equity loan)
Houses without a mortgage: 11
Median household income for houses/condos with a mortgage: $72,196
Median household income for apartments without a mortgage: $37,418
Median monthly housing costs: $1,137
Compare current foreclosures near University, FL:
| Photo | Address | Area | Beds / Baths | Price | Details |
|---|---|---|---|---|---|

|
#1
Cactus Needle Ln
Wesley Chapel, FL 33544
|
1,576 sq. feet
|
2 baths 3 beds |
$295,000
|
show details |

|
#2
Blue Magnolia Rd
Brandon, FL 33510
|
1,231 sq. feet
|
2 baths 2 beds |
$200,000
|
show details |

|
#3
Blazing Trail Way
Land O Lakes, FL 34639
|
2,486 sq. feet
|
3 baths 4 beds |
$452,400
|
show details |

|
#4
Oakridge Dr
Palm Harbor, FL 34685
|
2,344 sq. feet
|
3 baths 4 beds |
$710,000
|
show details |

|
#5
Bass St
Tampa, FL 33617
|
1,130 sq. feet
|
2 baths 3 beds |
show details | |

|
#6
S Valrico Rd
Valrico, FL 33594
|
3,568 sq. feet
|
2 baths 3 beds |
show details | |

|
#7
Oldgate Pl
Tampa, FL 33624
|
2,138 sq. feet
|
2 baths 3 beds |
show details | |

|
#8
N Oregon Ave
Tampa, FL 33604
|
1,421 sq. feet
|
1 baths 2 beds |
show details | |

|
#9
E Frierson Ave
Tampa, FL 33610
|
1,175 sq. feet
|
2 baths 4 beds |
show details | |

|
#10
Swenson Ter
Lutz, FL 33549
|
1,816 sq. feet
|
2 baths 3 beds |
show details |
| Photo | Address | Area | Beds / Baths | Price | Details |
|---|---|---|---|---|---|

|
#11
N Us Highway 41
Lutz, FL 33549
|
2,012 sq. feet
|
2 baths 3 beds |
show details | |

|
#12
Winners Cir
Odessa, FL 33556
|
3,662 sq. feet
|
3 baths 5 beds |
show details | |

|
#13
Orange Sunset Dr Unit 201
Tampa, FL 33618
|
644 sq. feet
|
1 baths 1 beds |
show details | |

|
#14
Dennison Dr
Tampa, FL 33619
|
1,716 sq. feet
|
2 baths 4 beds |
show details | |

|
#15
Bryan Oak Ave
Brandon, FL 33511
|
1,962 sq. feet
|
2 baths 3 beds |
show details | |

|
#16
N Gunlock Ave
Tampa, FL 33614
|
1,326 sq. feet
|
2 baths 3 beds |
show details | |

|
#17
N Whittier St
Tampa, FL 33617
|
1,609 sq. feet
|
2 baths 3 beds |
show details | |

|
#18
Hemingway Cir
Tampa, FL 33602
|
2,537 sq. feet
|
2 baths 3 beds |
show details | |

|
#19
N Cortez Ave
Tampa, FL 33614
|
962 sq. feet
|
1 baths 2 beds |
show details | |

|
#20
N 20th St
Lutz, FL 33549
|
1,678 sq. feet
|
2 baths 3 beds |
show details |
| Photo | Address | Area | Beds / Baths | Price | Details |
|---|---|---|---|---|---|

|
#21
Freeport Rd
Riverview, FL 33578
|
2,172 sq. feet
|
2 baths 3 beds |
show details | |

|
#22
W Nassau St
Tampa, FL 33607
|
1,066 sq. feet
|
1 baths 2 beds |
show details | |

|
#23
Sterling Manor Loop
Lutz, FL 33549
|
1,636 sq. feet
|
2 baths 3 beds |
show details | |

|
#24
Temple Park Dr
Tampa, FL 33637
|
1,234 sq. feet
|
2 baths 3 beds |
show details | |

|
#25
E Giddens Ave
Tampa, FL 33610
|
1,210 sq. feet
|
2 baths 2 beds |
show details | |

|
#26
Grasmere Dr
Land O Lakes, FL 34637
|
2,568 sq. feet
|
3 baths 4 beds |
show details | |

|
#27
Dewolf Rd
Brandon, FL 33511
|
1,494 sq. feet
|
2 baths 3 beds |
show details | |

|
#28
Abonado Rd
Tampa, FL 33615
|
1,588 sq. feet
|
2 baths 3 beds |
show details | |

|
#29
Arbor Side Dr
Tampa, FL 33647
|
3,393 sq. feet
|
3 baths 4 beds |
show details | |

|
#30
Fountain Ave
Tampa, FL 33634
|
1,159 sq. feet
|
2 baths 3 beds |
show details |
| Photo | Address | Area | Beds / Baths | Price | Details |
|---|---|---|---|---|---|

|
#31
Acapulco Dr
Riverview, FL 33578
|
1,511 sq. feet
|
2 baths 4 beds |
show details | |

|
#32
Myer St
Tampa, FL 33634
|
925 sq. feet
|
1 baths 2 beds |
show details | |

|
#33
Bismarck Palm Dr
Tampa, FL 33610
|
1,692 sq. feet
|
2 baths 2 beds |
show details | |

|
#34
Tamiami Ave
Tampa, FL 33647
|
3,557 sq. feet
|
4 baths 5 beds |
show details | |

|
#35
Lausberg Pl
Brandon, FL 33511
|
2,834 sq. feet
|
2 baths 4 beds |
show details | |

|
#36
White Lake Ct
Tampa, FL 33626
|
1,140 sq. feet
|
2 baths 2 beds |
show details | |

|
#37
W Arch St
Tampa, FL 33607
|
1,032 sq. feet
|
1 baths 2 beds |
show details | |

|
#38
Cedarhurst Ln
Tampa, FL 33625
|
2,336 sq. feet
|
2 baths 3 beds |
show details | |

|
#39
W Palmetto St
Tampa, FL 33607
|
1,428 sq. feet
|
2 baths 2 beds |
show details | |

|
#40
Arbor Run Dr Unit 23
Tampa, FL 33647
|
2,544 sq. feet
|
3 baths 4 beds |
show details |
| Photo | Address | Area | Beds / Baths | Price | Details |
|---|---|---|---|---|---|

|
#41
W Idlewild Ave
Tampa, FL 33634
|
1,193 sq. feet
|
2 baths 3 beds |
show details | |

|
#42
W Idlewild Ave
Tampa, FL 33634
|
1,495 sq. feet
|
2 baths 3 beds |
show details | |

|
#43
W Clifton St
Tampa, FL 33634
|
875 sq. feet
|
1 baths 2 beds |
show details | |

|
#44
Arbor Run Dr Unit 152
Tampa, FL 33647
|
2,416 sq. feet
|
3 baths 4 beds |
show details | |

|
#45
Nob Oak Ave
Tampa, FL 33647
|
2,776 sq. feet
|
3 baths 5 beds |
show details | |

|
#46
Somersby Dr
Riverview, FL 33578
|
1,784 sq. feet
|
2 baths 4 beds |
show details | |

|
#47
Fountain Ave
Tampa, FL 33634
|
1,388 sq. feet
|
2 baths 4 beds |
show details | |

|
#48
Towering Spruce Dr
Riverview, FL 33578
|
1,240 sq. feet
|
2 baths 2 beds |
show details | |

|
#49
Lindenhurst Dr
Wesley Chapel, FL 33544
|
1,722 sq. feet
|
2 baths 3 beds |
show details | |

|
Check over 1 million property listings on Foreclosure.com!
|
browse all offers | |||

Latest news about housing in University, FL collected exclusively by city-data.com from local newspapers, TV, and radio stations


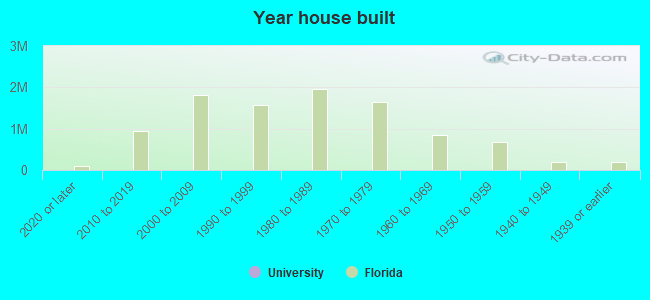
Median year apartment built: 1987
Household type by relationship:
Households: 50,645- Male householders: 9,317 (4,622 living alone), Female householders: 11,703 (4,997 living alone)
2,989 spouses (2,873 opposite-sex spouses), 1,783 unmarried partners, (1,712 opposite-sex unmarried partners), 11,307 children (10,905 natural, 198 adopted, 203 stepchildren), 1,094 grandchildren, 625 brothers or sisters, 848 parents, 72 foster children, 1,489 other relatives, 7,495 non-relatives
- In group quarters: 1,919
Size of family households: 2,676 2-persons, 2,134 3-persons, 1,617 4-persons, 742 5-persons, 480 6-persons, 213 7-or-more-persons.
Size of nonfamily households: 9,252 1-person, 2,385 2-persons, 767 3-persons, 665 4-persons, 230 5-persons.
2,833 married couples with children.
4,741 single-parent households (1,005 men, 3,736 women).
59.9% of residents of University speak English at home.
30.0% of residents speak Spanish at home (40% speak English very well, 19% speak English well, 19% speak English not well, 21% don't speak English at all).
5.9% of residents speak other Indo-European language at home (52% speak English very well, 34% speak English well, 6% speak English not well, 8% don't speak English at all).
3.3% of residents speak Asian or Pacific Island language at home (52% speak English very well, 30% speak English well, 11% speak English not well, 6% don't speak English at all).
1.8% of residents speak other language at home (69% speak English very well, 21% speak English well, 9% don't speak English at all).
Foreign born population: 12,849 (25.4%)
(25.0% of them are naturalized citizens)
| Here: | 5.3 |
| State: | 5.9 |
| Here: | 3.7 |
| State: | 4.2 |
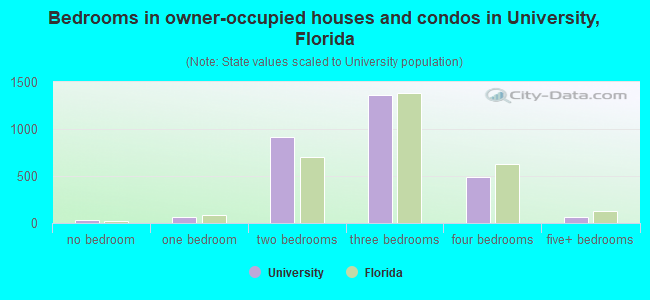
- Bedrooms in owner-occupied houses and condos in University, Florida
- 35no bedroom
- 671 bedroom
- 9142 bedrooms
- 1,3673 bedrooms
- 4864 bedrooms
- 685+ bedrooms
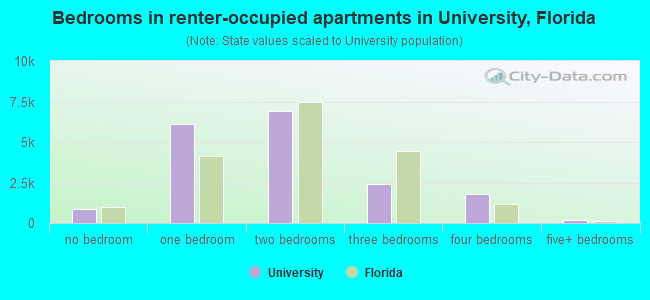
- Bedrooms in renter-occupied apartments in University, Florida
- 886no bedroom
- 6,1101 bedroom
- 6,8992 bedrooms
- 2,4133 bedrooms
- 1,8074 bedrooms
- 1825+ bedrooms
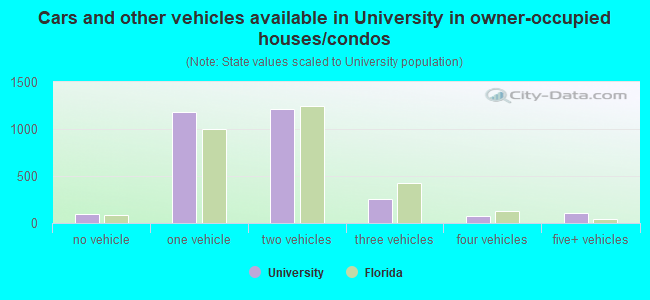
- Cars and other vehicles available in University in owner-occupied houses/condos
- 97no vehicle
- 1,1791 vehicle
- 1,2182 vehicles
- 2593 vehicles
- 794 vehicles
- 1045+ vehicles
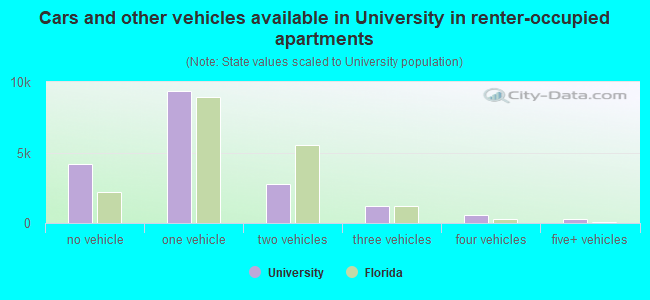
- Cars and other vehicles available in University in renter-occupied apartments
- 4,175no vehicle
- 9,3701 vehicle
- 2,7662 vehicles
- 1,1893 vehicles
- 5344 vehicles
- 2615+ vehicles
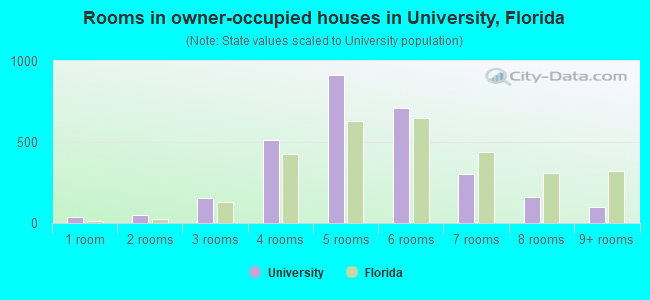
- Rooms in owner-occupied houses in University, Florida
- 351 room
- 482 rooms
- 1533 rooms
- 5144 rooms
- 9165 rooms
- 7076 rooms
- 3007 rooms
- 1628 rooms
- 1019+ rooms
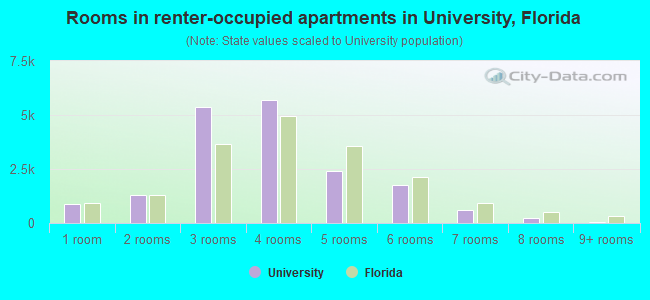
- Rooms in renter-occupied apartments in University, Florida
- 8861 room
- 1,3142 rooms
- 5,3563 rooms
- 5,6934 rooms
- 2,4055 rooms
- 1,7686 rooms
- 5807 rooms
- 2318 rooms
- 629+ rooms
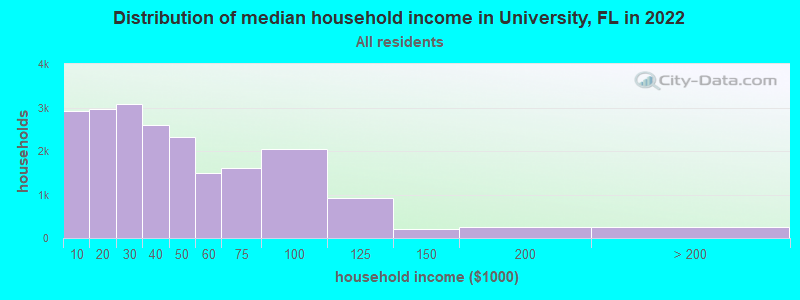
University, FL household income distribution

- 2,919Less than $10,000
- 2,972$10,000 to $19,999
- 3,079$20,000 to $29,999
- 2,595$30,000 to $39,999
- 2,318$40,000 to $49,999
- 1,483$50,000 to $59,999
- 1,598$60,000 to $74,999
- 2,057$75,000 to $99,999
- 924$100,000 to $124,999
- 205$125,000 to $149,999
- 248$150,000 to $199,999
- 260$200,000 or more
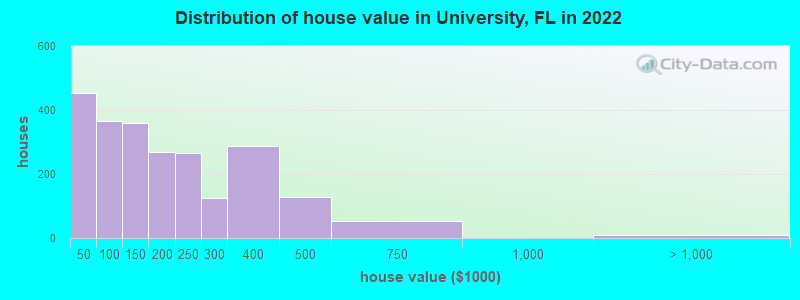
Home value of owner - occupied houses in 2022 in University, FL
-
- 28Less than $10,000
- 11$10,000 to $14,999
- 223$20,000 to $24,999
- 113$30,000 to $34,999
- 50$35,000 to $39,999
- 26$40,000 to $49,999
- 42$50,000 to $59,999
- 73$70,000 to $79,999
- 83$80,000 to $89,999
- 141$90,000 to $99,999
- 223$100,000 to $124,999
- 134$125,000 to $149,999
- 183$150,000 to $174,999
- 85$175,000 to $199,999
- 265$200,000 to $249,999
- 124$250,000 to $299,999
- 288$300,000 to $399,999
- 127$400,000 to $499,999
- 54$500,000 to $749,999
- 9$2,000,000 or more
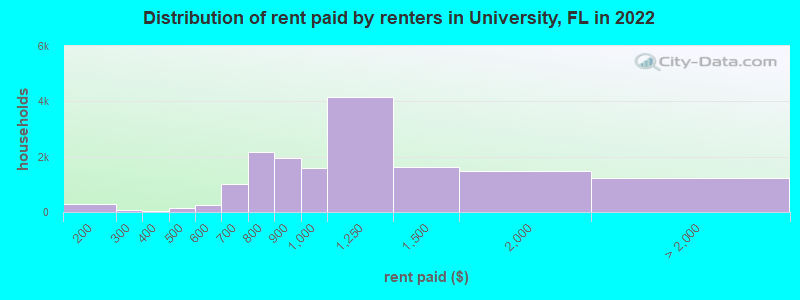
Rent paid by renters in 2022 in University, FL
-
- 32Less than $100
- 107$100 to $149
- 196$150 to $199
- 36$200 to $249
- 36$250 to $299
- 36$300 to $349
- 15$350 to $399
- 38$400 to $449
- 102$450 to $499
- 61$500 to $549
- 201$550 to $599
- 538$600 to $649
- 488$650 to $699
- 797$700 to $749
- 1,386$750 to $799
- 1,954$800 to $899
- 1,589$900 to $999
- 4,171$1,000 to $1,249
- 1,627$1,250 to $1,499
- 1,486$1,500 to $1,999
- 583$2,000 to $2,499
- 210$2,500 to $2,999
- 191$3,000 to $3,499
- 147$3,500 or more
- 85No cash rent
Percentage of workers working in this county: 88.4%
Number of people working at home: 2,919 (11.7% of all workers)
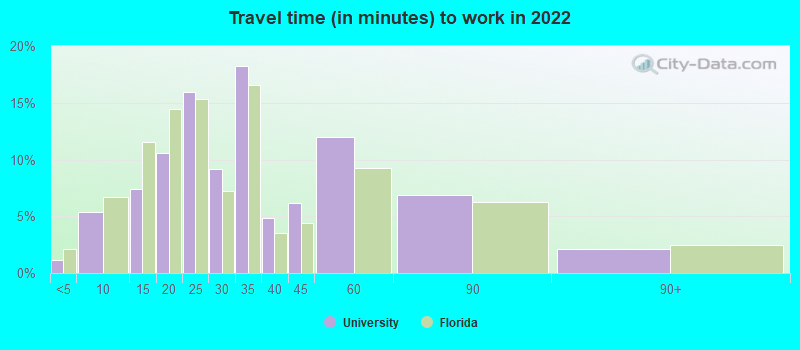
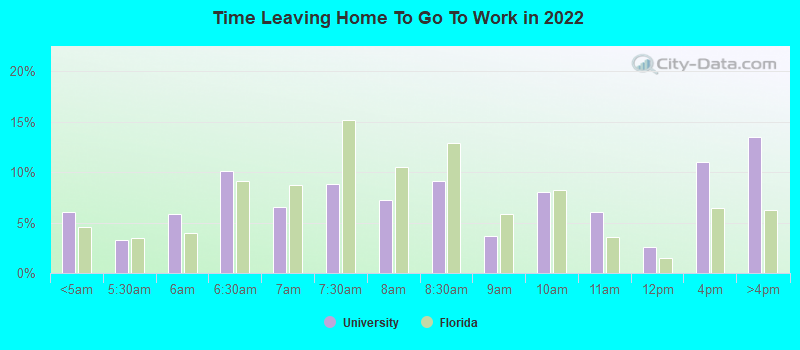
Travel time to work (commute)
- Less than 5 minutes: 125
- 5 to 9 minutes: 1,990
- 10 to 14 minutes: 2,426
- 15 to 19 minutes: 2,561
- 20 to 24 minutes: 3,810
- 25 to 29 minutes: 1,976
- 30 to 34 minutes: 3,150
- 35 to 39 minutes: 449
- 40 to 44 minutes: 1,181
- 45 to 59 minutes: 1,864
- 60 to 89 minutes: 1,389
- 90 or more minutes: 524
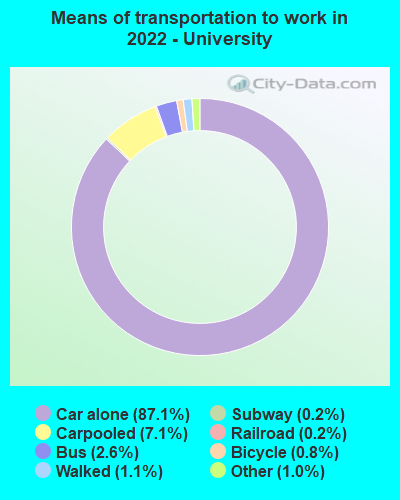
Means of transportation to work:
- Drove a car alone: 14,285 (71.9%)
- Carpooled: 1,325 (6.7%)
- Bus: 296 (1.5%)
- Subway or elevated rail: 12 (0.1%)
- Long-distance train or commuter rail: 26 (0.1%)
- Light rail, streetcar or trolley: 31 (0.2%)
- Taxi: 193 (1.0%)
- Bicycle: 140 (0.7%)
- Walked: 163 (0.8%)
- Worked at home: 2,919 (14.7%)
- Unemployment by race in 2022
- Unemployment rate for White non-Hispanic residents
- 6.8%Males
- 4.2%Females
- Unemployment rate for Black residents
- 6.1%Males
- 4.0%Females
- Unemployment rate for American Indian and Alaska Native residents
- 12.7%Females
- Unemployment rate for Asian residents
- 7.9%Males
- Unemployment rate for other race residents
- 0.5%Males
- 6.2%Females
- Unemployment rate for two or more race residents
- 3.2%Males
- 5.4%Females
- Unemployment rate for Hispanic or Latino residents
- 2.9%Males
- 6.5%Females
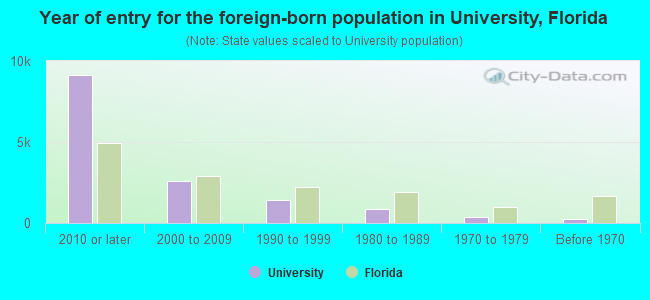
- Year of entry for the foreign-born population in University, Florida
- 9,1312010 or later
- 2,5652000 to 2009
- 1,4471990 to 1999
- 8601980 to 1989
- 3851970 to 1979
- 274Before 1970
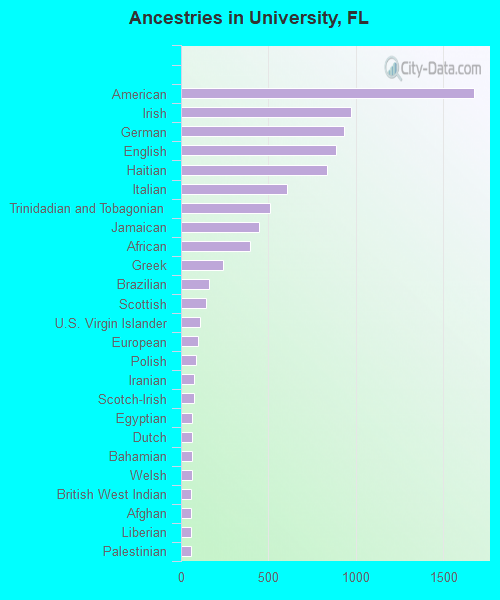
First ancestries reported:
- American: 1,678 (4.9%)
- Irish: 975 (2.9%)
- German: 933 (2.7%)
- English: 888 (2.6%)
- Haitian: 837 (2.5%)
- Italian: 604 (1.8%)
- Trinidadian and Tobagonian: 507 (1.5%)
- Jamaican: 444 (1.3%)
- African: 394 (1.2%)
- Greek: 239 (0.7%)
- Brazilian: 158 (0.5%)
- Scottish: 141 (0.4%)
- U.S. Virgin Islander: 111 (0.3%)
- European: 98 (0.3%)
- Polish: 88 (0.3%)
- Iranian: 74 (0.2%)
- Scotch-Irish: 72 (0.2%)
- Egyptian: 65 (0.2%)
- Dutch: 65 (0.2%)
- Bahamian: 62 (0.2%)
- Welsh: 61 (0.2%)
- British West Indian: 60 (0.2%)
- Afghan: 59 (0.2%)
- Liberian: 57 (0.2%)
- Palestinian: 55 (0.2%)
- Canadian: 55 (0.2%)
- Czechoslovakian: 48 (0.1%)
- French: 48 (0.1%)
- Russian: 42 (0.1%)
- Turkish: 36 (0.1%)
- Albanian: 36 (0.1%)
- Danish: 35 (0.1%)
- Iraqi: 34 (0.10%)
- Guyanese: 33 (0.10%)
- Nigerian: 26 (0.08%)
- French Canadian: 24 (0.07%)
- Senegalese: 23 (0.07%)
- West Indian: 23 (0.07%)
- Israeli: 21 (0.06%)
- Celtic: 19 (0.06%)
- South African: 18 (0.05%)
- Cape Verdean: 15 (0.04%)
- Croatian: 12 (0.04%)
- Jordanian: 10 (0.03%)
- Belizean: 10 (0.03%)
- Norwegian: 9 (0.03%)
- Moroccan: 6 (0.02%)
Most common places of birth for foreign-born residents (%):
| University: | 23.1% (2,848) |
| Florida: | 5.6% (257,152) |
| University: | 10.1% (1,244) |
| Florida: | 2.3% (107,160) |
| University: | 7.3% (905) |
| Florida: | 7.5% (342,375) |
| University: | 5.8% (711) |
| Florida: | 2.1% (94,349) |
| University: | 5.7% (703) |
| Florida: | 22.0% (1,006,576) |
| University: | 5.0% (620) |
| Florida: | 1.0% (43,642) |
| University: | 3.9% (481) |
| Florida: | 1.2% (56,071) |
| University: | 2.9% (363) |
| Florida: | 5.0% (227,319) |
| University: | 2.5% (313) |
| Florida: | 2.1% (96,693) |
| University: | 2.3% (283) |
| Florida: | 1.1% (49,838) |
| University: | 2.1% (262) |
| Florida: | 6.5% (298,669) |
| University: | 1.8% (227) |
| Florida: | 2.1% (97,632) |
| University: | 1.7% (208) |
| Florida: | 3.0% (137,727) |
| University: | 1.6% (200) |
| Florida: | 5.7% (262,042) |
| University: | 1.5% (191) |
| Florida: | 1.3% (60,604) |
Place of birth for U.S.-born residents:
- This state: 19,288
- Other state: 14,715
- Northeast: 6,199
- Midwest: 2,574
- South: 5,195
- West: 816
76.1% of University residents lived in the same house 1 years ago.
Out of people who lived in different houses, 35.4% lived in this county.
Out of people who lived in different counties, 65.6% lived in Florida.
| University: | 76.1% |
| State average: | 86.3% |
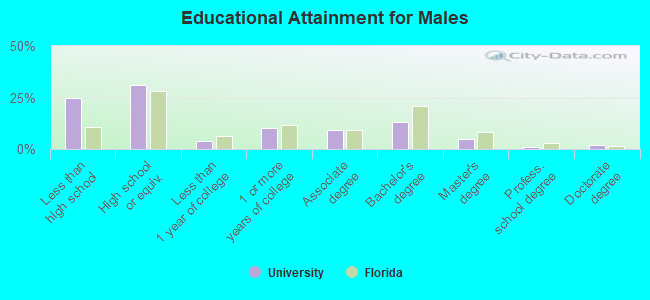
Education attainment for males 25 years and older:
- No schooling: 268
- Nursery to 4th grade: 93
- 5th and 6th grade: 718
- 7th and 8th grade: 277
- 9th grade: 635
- 10th grade: 510
- 11th grade: 276
- 12th grade, no diploma: 539
- High school graduate (or equivalency): 4,167
- Less than 1 year of college: 526
- Some college more than 1 year, no degree: 1,371
- Associate degree: 1,217
- Bachelor's degree: 1,771
- Master's degree: 652
- Professional school degree: 103
- Doctorate degree: 227
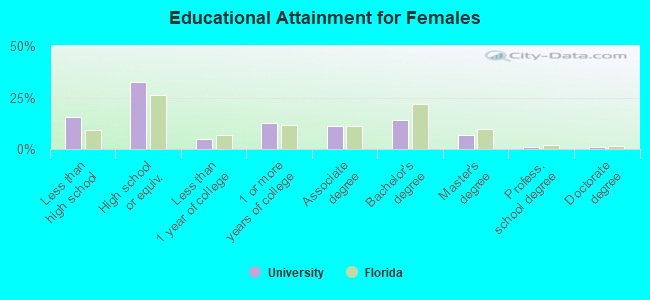
Education attainment for females 25 years and older:
- No schooling: 289
- Nursery to 4th grade: 60
- 5th and 6th grade: 423
- 7th and 8th grade: 198
- 9th grade: 201
- 10th grade: 285
- 11th grade: 246
- 12th grade, no diploma: 502
- High school graduate (or equivalency): 4,568
- Less than 1 year of college: 673
- Some college more than 1 year, no degree: 1,810
- Associate degree: 1,598
- Bachelor's degree: 1,991
- Master's degree: 932
- Professional school degree: 152
- Doctorate degree: 148
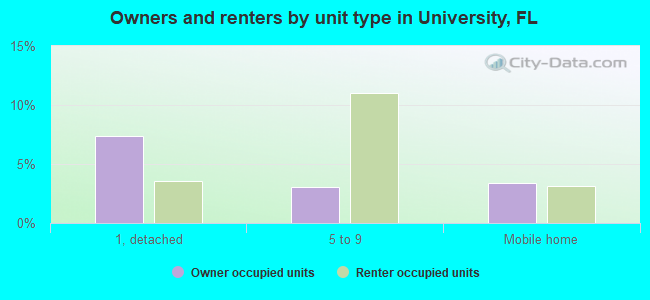
Housing units in structures:
- One, detached: 2,228
- One, attached: 1,178
- Two: 1,116
- 3 or 4: 2,606
- 5 to 9: 3,277
- 10 to 19: 3,664
- 20 to 49: 1,824
- 50 or more: 6,307
- Mobile homes: 1,719
- Boats, RVs, vans, etc.: 1
Median worth of mobile homes: $96,351
Housing units lacking complete kitchen facilities in 2022: 1.3%
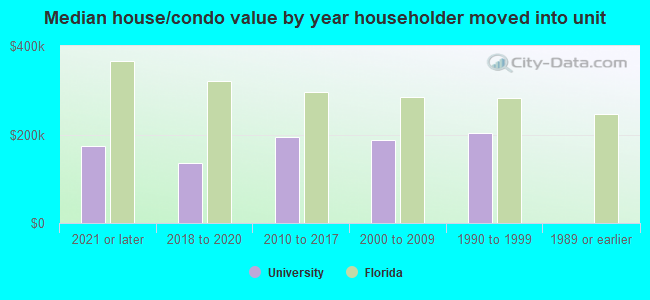
House/condo owner moved in on average 7 years ago
Renter moved in on average 3 years ago
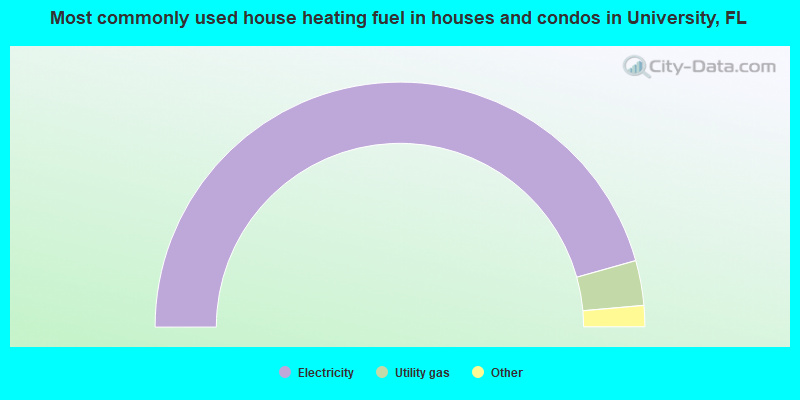
- 91.2%Electricity
- 5.9%Utility gas
- 1.5%No fuel used
- 1.3%Other fuel
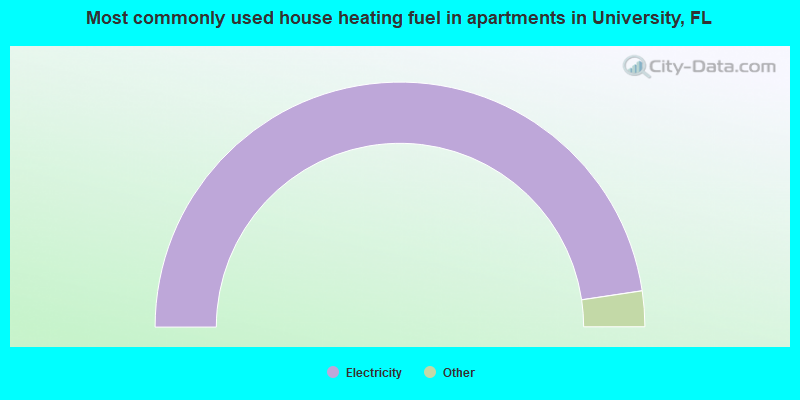
- 95.3%Electricity
- 2.9%Utility gas
- 0.8%No fuel used
- 0.8%Bottled, tank, or LP gas
- 0.1%Fuel oil, kerosene, etc.
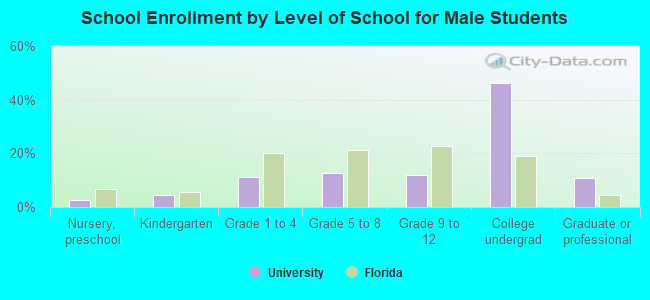
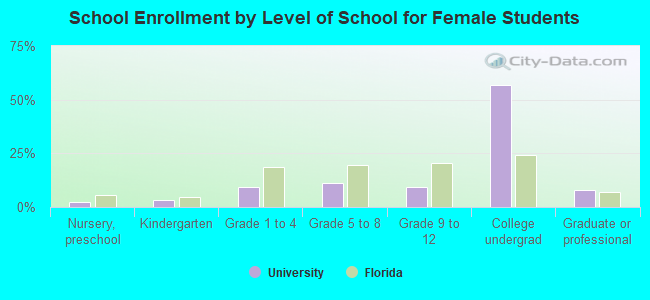
Private vs. public school enrollment:
| Here: | 10.2% |
| Florida: | 15.8% |
| Here: | 1.3% |
| Florida: | 12.9% |
| Here: | 13.5% |
| Florida: | 23.6% |