University Place, WA (Washington) Houses and Residents
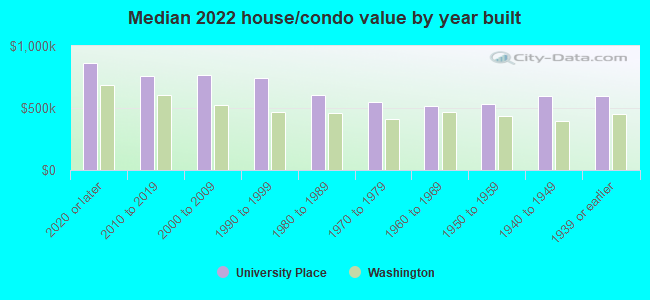
| University Place: | $617,591 |
| Washington: | $569,500 |
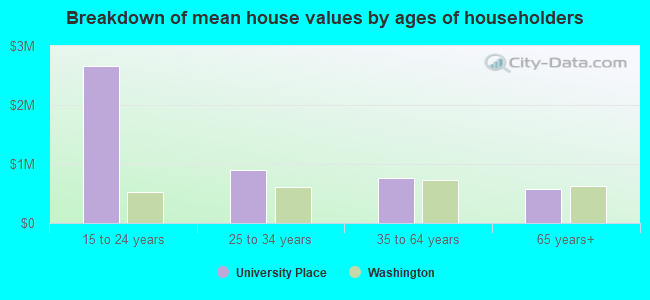
Mean price in 2022:
Detached houses: $659,394
Here: $659,394 State: $734,307 Townhouses or other attached units: $514,401
Here: $514,401 State: $657,697 In 2-unit structures: $802,283
Here: $802,283 State: $534,634 In 3-to-4-unit structures: $195,373
Here: $195,373 State: $510,239 In 5-or-more-unit structures: $216,702
Here: $216,702 State: $503,183 Mobile homes: $22,865
Here: $22,865 State: $218,362
Total population: 32,282 (Urban population: 30,120, Rural population: 0)
Houses: 14,788 (14,073 occupied: 8,215 owner occupied, 5,861 renter occupied)
| % of renters here: | 42% |
| State: | 36% |
Housing density: 1,763 houses/condos per square mile
Median price asked for vacant for-sale houses and condos in 2022: $768,023.
Median contract rent in 2022: $1,546 (lower quartile is $1,261, upper quartile is $1,809)
Median rent asked for vacant for-rent units in 2022: $1,912
Median gross rent in University Place, WA in 2022: $1,649
Housing units in University Place with a mortgage: 5,379 (633 second mortgage, 0 home equity loan, 525 both second mortgage and home equity loan)
Houses without a mortgage: 93
Median household income for houses/condos with a mortgage: $138,529
Median household income for apartments without a mortgage: $84,408
Median monthly housing costs: $1,710
Compare current foreclosures near University Place, WA:
| Photo | Address | Area | Beds / Baths | Price | Details |
|---|---|---|---|---|---|

|
#1
96th Ave W
University Place, WA 98467
|
1,774 sq. feet
|
2 baths 3 beds |
show details | |

|
#2
77th Avenue Ct W
University Place, WA 98467
|
1,984 sq. feet
|
2 baths 3 beds |
show details | |

|
#3
52nd Street Ct W
University Place, WA 98467
|
1,152 sq. feet
|
2 baths 3 beds |
show details | |

|
#4
98th Avenue Ct W
University Place, WA 98467
|
1,512 sq. feet
|
2 baths 3 beds |
show details | |

|
#5
48th Street Ct W # A
University Place, WA 98467
|
1,395 sq. feet
|
2 baths 2 beds |
show details | |

|
#6
59th Street Ct W Apt H12
University Place, WA 98467
|
- sq. feet
|
- baths - beds |
show details | |

|
#7
Bridgeport Way W Unit B
University Place, WA 98467
|
- sq. feet
|
- baths - beds |
show details | |

|
#8
Cirque Dr W Apt A
University Place, WA 98467
|
- sq. feet
|
- baths - beds |
show details | |

|
#9
57th Street Ct W
University Place, WA 98467
|
- sq. feet
|
- baths - beds |
show details | |

|
#10
E Harstine Heights Ln
Shelton, WA 98584
|
1,634 sq. feet
|
2 baths 3 beds |
$279,900
|
show details |
| Photo | Address | Area | Beds / Baths | Price | Details |
|---|---|---|---|---|---|

|
#11
97th Avenue Ct W
University Place, WA 98467
|
- sq. feet
|
- baths - beds |
show details | |

|
#12
18th Ave S Apt V201
Federal Way, WA 98003
|
1,200 sq. feet
|
2 baths 3 beds |
show details | |

|
#13
Commencement Bay Dr
Tacoma, WA 98407
|
1,314 sq. feet
|
2 baths 5 beds |
show details | |

|
#14
S Park Ave
Tacoma, WA 98418
|
- sq. feet
|
2 baths 4 beds |
show details | |

|
#15
105th Avenue Ct SW
Lakewood, WA 98498
|
1,148 sq. feet
|
1 baths 3 beds |
show details | |

|
#16
2nd Ave N
Auburn, WA 98001
|
1,690 sq. feet
|
1 baths 3 beds |
show details | |

|
#17
Bent Tree Ln
Pacific, WA 98047
|
1,810 sq. feet
|
2 baths 3 beds |
show details | |

|
#18
Kodiak Ave NE
Olympia, WA 98516
|
1,863 sq. feet
|
2 baths 4 beds |
show details | |

|
#19
Veterans Dr SW
Lakewood, WA 98498
|
1,495 sq. feet
|
1 baths 2 beds |
show details | |

|
#20
200th Street Ct E
Spanaway, WA 98387
|
1,689 sq. feet
|
2 baths 3 beds |
show details |
| Photo | Address | Area | Beds / Baths | Price | Details |
|---|---|---|---|---|---|

|
#21
S 74th St
Tacoma, WA 98408
|
1,248 sq. feet
|
1 baths 3 beds |
show details | |

|
#22
90th Ave E
Puyallup, WA 98375
|
1,818 sq. feet
|
2 baths 4 beds |
show details | |

|
#23
S 56th St
Tacoma, WA 98408
|
990 sq. feet
|
1 baths 2 beds |
show details | |

|
#24
Cochise Ln SW
Lakewood, WA 98499
|
- sq. feet
|
2 baths 3 beds |
show details | |

|
#25
108th Ave E
Puyallup, WA 98374
|
- sq. feet
|
2 baths 5 beds |
show details | |

|
#26
51st Ave S
Auburn, WA 98001
|
1,610 sq. feet
|
1 baths 3 beds |
show details | |

|
#27
Point View St NE
Olympia, WA 98516
|
1,630 sq. feet
|
1 baths 3 beds |
show details | |

|
#28
S Alaska St
Tacoma, WA 98408
|
1,987 sq. feet
|
1 baths 3 beds |
show details | |

|
#29
102nd St SW
Lakewood, WA 98498
|
1,414 sq. feet
|
1 baths 3 beds |
show details | |

|
#30
Villa Ln SW
Lakewood, WA 98499
|
1,916 sq. feet
|
2 baths 3 beds |
show details |
| Photo | Address | Area | Beds / Baths | Price | Details |
|---|---|---|---|---|---|

|
#31
82nd Avenue Ct E
Spanaway, WA 98387
|
1,974 sq. feet
|
3 baths 3 beds |
show details | |

|
#32
124th Avenue Ct E
Puyallup, WA 98374
|
924 sq. feet
|
3 baths 5 beds |
show details | |

|
#33
SW Oak Rd
Port Orchard, WA 98367
|
1,360 sq. feet
|
1 baths 3 beds |
show details | |

|
#34
S Junett St
Tacoma, WA 98409
|
1,416 sq. feet
|
1 baths 2 beds |
show details | |

|
#35
183rd St E
Puyallup, WA 98374
|
2,140 sq. feet
|
2 baths 3 beds |
show details | |

|
#36
S State St
Tacoma, WA 98409
|
1,200 sq. feet
|
1 baths 3 beds |
show details | |

|
#37
58th Pl S
Auburn, WA 98001
|
1,410 sq. feet
|
2 baths 3 beds |
show details | |

|
#38
N Union Ave
Tacoma, WA 98406
|
- sq. feet
|
1 baths 3 beds |
show details | |

|
#39
S 261st Pl
Seattle, WA 98198
|
1,730 sq. feet
|
1 baths 4 beds |
show details | |

|
#40
S 316th St
Auburn, WA 98001
|
2,010 sq. feet
|
2 baths 5 beds |
show details |
| Photo | Address | Area | Beds / Baths | Price | Details |
|---|---|---|---|---|---|

|
#41
119th Ave E
Puyallup, WA 98374
|
1,512 sq. feet
|
2 baths 3 beds |
show details | |

|
#42
S Trafton St
Tacoma, WA 98405
|
1,160 sq. feet
|
2 baths 3 beds |
show details | |

|
#43
N Tyler St
Tacoma, WA 98406
|
1,460 sq. feet
|
2 baths 3 beds |
show details | |

|
#44
47th Pl S
Auburn, WA 98001
|
970 sq. feet
|
1 baths 3 beds |
show details | |

|
#45
81st Ave SW
Vashon, WA 98070
|
1,270 sq. feet
|
1 baths 1 beds |
show details | |

|
#46
9th Avenue Ct SE
Puyallup, WA 98372
|
1,262 sq. feet
|
1 baths 3 beds |
show details | |

|
#47
Pacific Ave S
Pacific, WA 98047
|
1,000 sq. feet
|
1 baths 3 beds |
show details | |

|
#48
S M St
Tacoma, WA 98408
|
1,040 sq. feet
|
2 baths 2 beds |
show details | |

|
#49
19th Street Ct E
Puyallup, WA 98372
|
960 sq. feet
|
1 baths 3 beds |
show details | |

|
Check over 1 million property listings on Foreclosure.com!
|
browse all offers | |||


Median year apartment built: 1980
Household type by relationship:
Households: 35,012- Male householders: 6,898 (1,504 living alone), Female householders: 6,908 (2,330 living alone)
7,118 spouses (7,071 opposite-sex spouses), 1,153 unmarried partners, (980 opposite-sex unmarried partners), 10,424 children (9,660 natural, 438 adopted, 324 stepchildren), 404 grandchildren, 228 brothers or sisters, 638 parents, 0 foster children, 346 other relatives, 630 non-relatives
- In group quarters: 261
Size of family households: 4,099 2-persons, 1,918 3-persons, 1,876 4-persons, 909 5-persons, 239 6-persons, 65 7-or-more-persons.
Size of nonfamily households: 3,904 1-person, 925 2-persons, 108 3-persons, 9 4-persons, 9 6-persons.
6,081 married couples with children.
1,711 single-parent households (418 men, 1,293 women).
80.0% of residents of University Place speak English at home.
6.1% of residents speak Spanish at home (80% speak English very well, 14% speak English well, 5% speak English not well, 1% don't speak English at all).
4.7% of residents speak other Indo-European language at home (62% speak English very well, 20% speak English well, 17% speak English not well, 1% don't speak English at all).
7.6% of residents speak Asian or Pacific Island language at home (58% speak English very well, 28% speak English well, 14% speak English not well).
1.2% of residents speak other language at home (28% speak English very well, 25% speak English well, 30% speak English not well, 18% don't speak English at all).
Foreign born population: 5,309 (15.2%)
(59.7% of them are naturalized citizens)
| Here: | 6.6 |
| State: | 6.5 |
| Here: | 3.9 |
| State: | 3.9 |
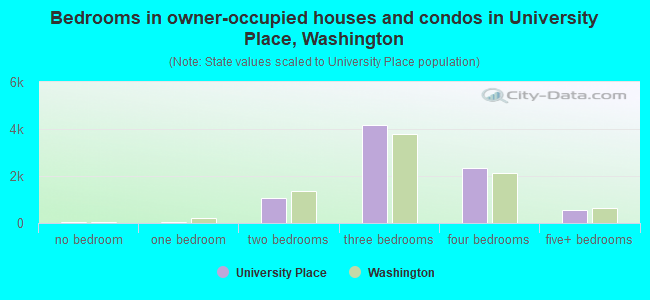
- Bedrooms in owner-occupied houses and condos in University Place, Washington
- 38no bedroom
- 441 bedroom
- 1,0832 bedrooms
- 4,1763 bedrooms
- 2,3324 bedrooms
- 5415+ bedrooms
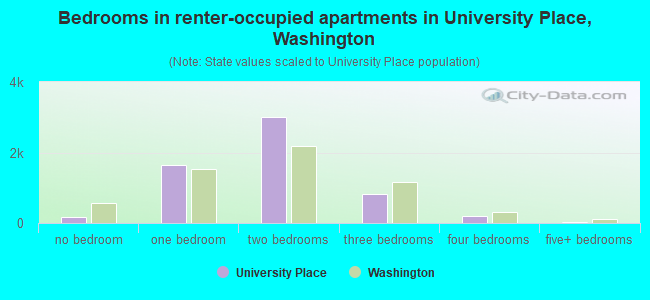
- Bedrooms in renter-occupied apartments in University Place, Washington
- 166no bedroom
- 1,6521 bedroom
- 3,0002 bedrooms
- 8143 bedrooms
- 2124 bedrooms
- 175+ bedrooms
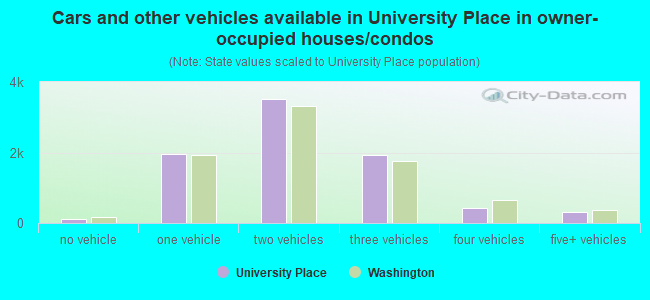
- Cars and other vehicles available in University Place in owner-occupied houses/condos
- 119no vehicle
- 1,9531 vehicle
- 3,5052 vehicles
- 1,9223 vehicles
- 4144 vehicles
- 3025+ vehicles
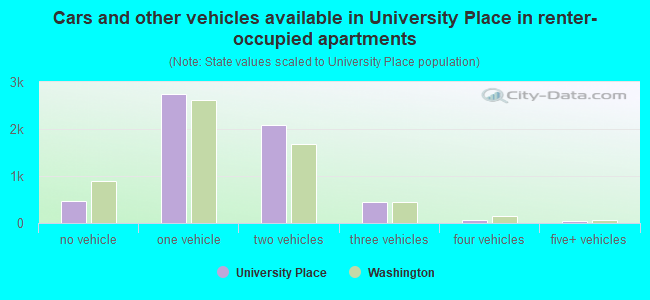
- Cars and other vehicles available in University Place in renter-occupied apartments
- 463no vehicle
- 2,7431 vehicle
- 2,0922 vehicles
- 4513 vehicles
- 664 vehicles
- 475+ vehicles
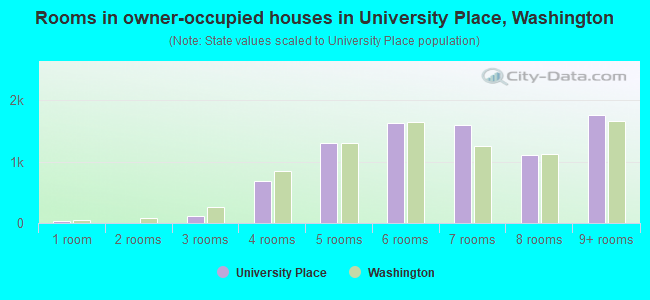
- Rooms in owner-occupied houses in University Place, Washington
- 381 room
- 02 rooms
- 1123 rooms
- 6844 rooms
- 1,2985 rooms
- 1,6226 rooms
- 1,5957 rooms
- 1,1088 rooms
- 1,7589+ rooms
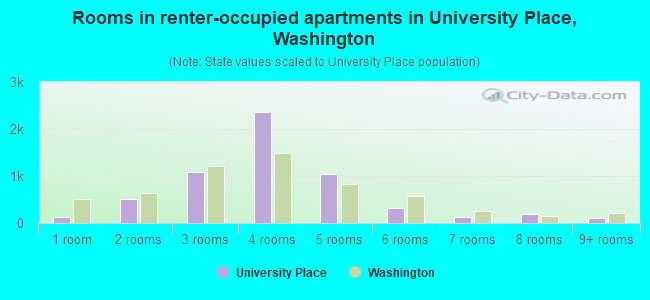
- Rooms in renter-occupied apartments in University Place, Washington
- 1351 room
- 5162 rooms
- 1,0773 rooms
- 2,3644 rooms
- 1,0375 rooms
- 3096 rooms
- 1227 rooms
- 1938 rooms
- 1079+ rooms
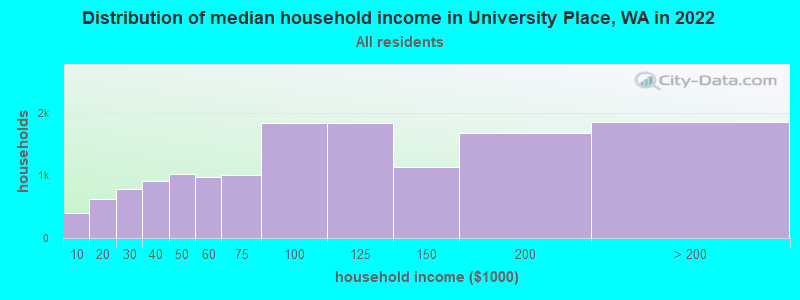
University Place, WA household income distribution

- 401Less than $10,000
- 624$10,000 to $19,999
- 781$20,000 to $29,999
- 904$30,000 to $39,999
- 1,028$40,000 to $49,999
- 980$50,000 to $59,999
- 1,000$60,000 to $74,999
- 1,837$75,000 to $99,999
- 1,837$100,000 to $124,999
- 1,126$125,000 to $149,999
- 1,672$150,000 to $199,999
- 1,850$200,000 or more
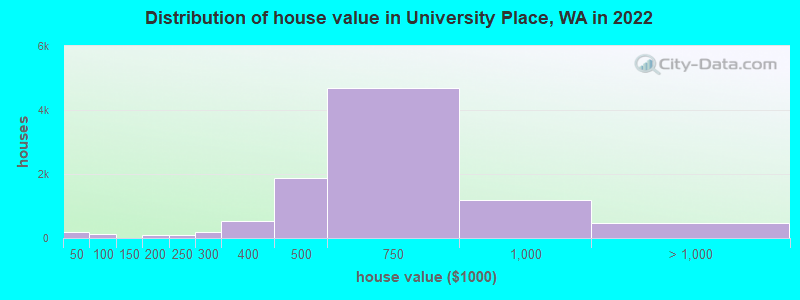
Home value of owner - occupied houses in 2022 in University Place, WA
-
- 36Less than $10,000
- 10$15,000 to $19,999
- 15$20,000 to $24,999
- 60$30,000 to $34,999
- 62$40,000 to $49,999
- 72$50,000 to $59,999
- 9$125,000 to $149,999
- 67$150,000 to $174,999
- 34$175,000 to $199,999
- 96$200,000 to $249,999
- 189$250,000 to $299,999
- 525$300,000 to $399,999
- 1,869$400,000 to $499,999
- 4,679$500,000 to $749,999
- 1,186$750,000 to $999,999
- 388$1,000,000 to $1,499,999
- 19$1,500,000 to $1,999,999
- 58$2,000,000 or more
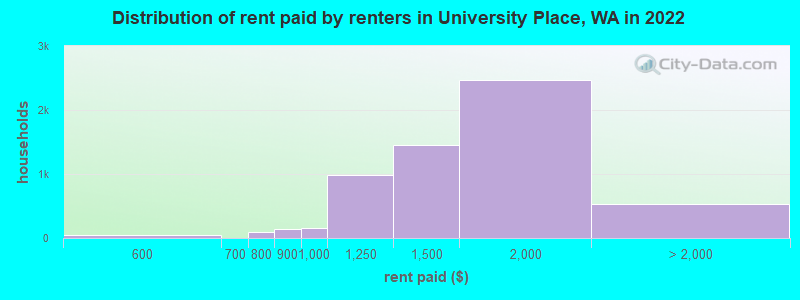
Rent paid by renters in 2022 in University Place, WA
-
- 13$150 to $199
- 9$250 to $299
- 12$300 to $349
- 18$500 to $549
- 22$550 to $599
- 21$700 to $749
- 70$750 to $799
- 142$800 to $899
- 156$900 to $999
- 983$1,000 to $1,249
- 1,446$1,250 to $1,499
- 2,460$1,500 to $1,999
- 250$2,000 to $2,499
- 175$2,500 to $2,999
- 69$3,000 to $3,499
- 42No cash rent
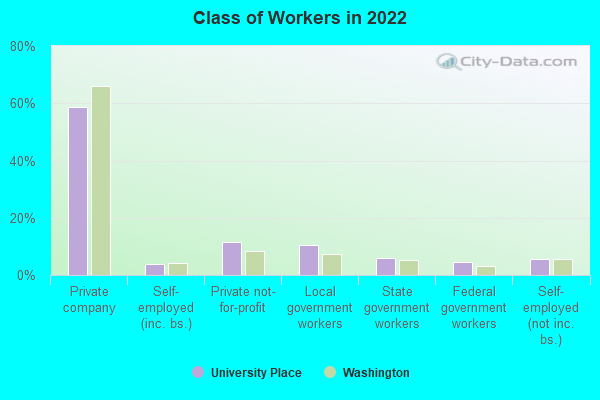
Percentage of workers working in this county: 85.9%
Number of people working at home: 3,027 (18.3% of all workers)

Travel time to work (commute)
- Less than 5 minutes: 203
- 5 to 9 minutes: 1,003
- 10 to 14 minutes: 2,309
- 15 to 19 minutes: 3,126
- 20 to 24 minutes: 1,827
- 25 to 29 minutes: 997
- 30 to 34 minutes: 1,480
- 35 to 39 minutes: 515
- 40 to 44 minutes: 376
- 45 to 59 minutes: 955
- 60 to 89 minutes: 796
- 90 or more minutes: 376
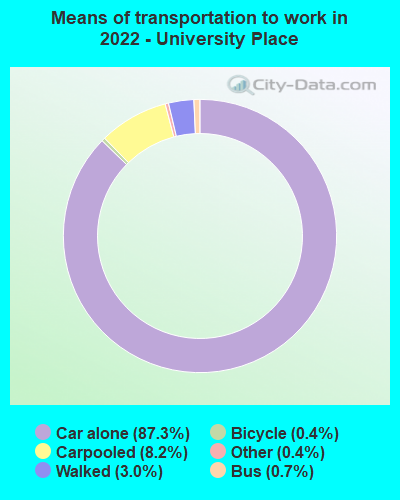
Means of transportation to work:
- Drove a car alone: 5,113 (60.3%)
- Carpooled: 498 (5.9%)
- Bus: 39 (0.5%)
- Taxi: 22 (0.3%)
- Bicycle: 30 (0.4%)
- Walked: 226 (2.7%)
- Worked at home: 3,027 (35.7%)
- Unemployment by race in 2022
- Unemployment rate for White non-Hispanic residents
- 3.8%Males
- 2.2%Females
- Unemployment rate for Black residents
- 2.4%Males
- 13.0%Females
- Unemployment rate for Asian residents
- 0.9%Males
- 2.0%Females
- Unemployment rate for other race residents
- 18.3%Males
- 9.8%Females
- Unemployment rate for two or more race residents
- 1.7%Males
- 0.6%Females
- Unemployment rate for Hispanic or Latino residents
- 8.3%Males
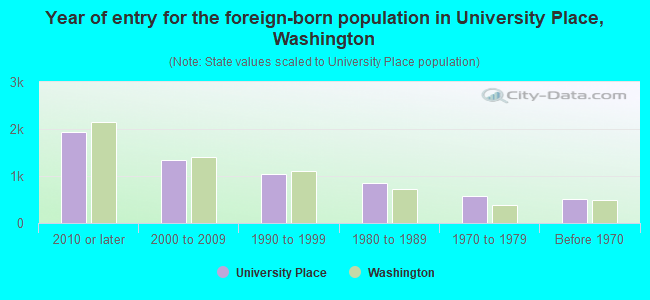
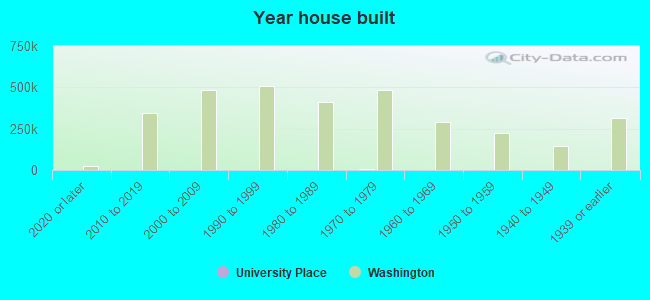
- Year of entry for the foreign-born population in University Place, Washington
- 1,9302010 or later
- 1,3302000 to 2009
- 1,0521990 to 1999
- 8541980 to 1989
- 5741970 to 1979
- 516Before 1970
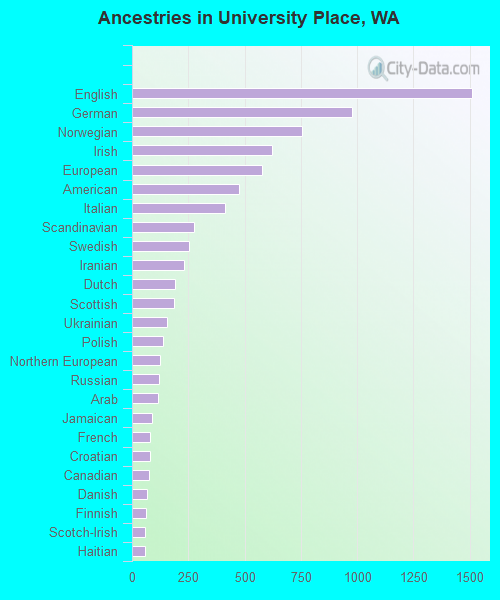
First ancestries reported:
- English: 1,511 (8.9%)
- German: 979 (5.7%)
- Norwegian: 757 (4.4%)
- Irish: 622 (3.6%)
- European: 576 (3.4%)
- American: 476 (2.8%)
- Italian: 413 (2.4%)
- Scandinavian: 277 (1.6%)
- Swedish: 253 (1.5%)
- Iranian: 231 (1.4%)
- Dutch: 191 (1.1%)
- Scottish: 188 (1.1%)
- Ukrainian: 154 (0.9%)
- Polish: 138 (0.8%)
- Northern European: 126 (0.7%)
- Russian: 119 (0.7%)
- Arab: 114 (0.7%)
- Jamaican: 89 (0.5%)
- French: 82 (0.5%)
- Croatian: 78 (0.5%)
- Canadian: 74 (0.4%)
- Danish: 66 (0.4%)
- Finnish: 64 (0.4%)
- Scotch-Irish: 59 (0.3%)
- Haitian: 57 (0.3%)
- African: 56 (0.3%)
- Greek: 51 (0.3%)
- Ugandan: 44 (0.3%)
- Swiss: 33 (0.2%)
- Romanian: 27 (0.2%)
- Iraqi: 24 (0.1%)
- French Canadian: 24 (0.1%)
- Austrian: 23 (0.1%)
- Welsh: 20 (0.1%)
- Icelander: 17 (0.10%)
- British: 17 (0.10%)
- Bulgarian: 16 (0.09%)
- Latvian: 15 (0.09%)
- Celtic: 15 (0.09%)
- Portuguese: 14 (0.08%)
- Czech: 12 (0.07%)
- Turkish: 12 (0.07%)
- Eastern European: 11 (0.06%)
- New Zealander: 8 (0.05%)
- Hungarian: 7 (0.04%)
Most common places of birth for foreign-born residents (%):
| University Place: | 18.4% (950) |
| Washington: | 4.3% (48,886) |
| University Place: | 12.9% (667) |
| Washington: | 6.3% (71,661) |
| University Place: | 7.5% (387) |
| Washington: | 21.1% (241,655) |
| University Place: | 6.3% (323) |
| Washington: | 7.4% (84,470) |
| University Place: | 5.6% (291) |
| Washington: | 5.4% (62,003) |
| University Place: | 5.1% (261) |
| Washington: | 0.9% (10,499) |
| University Place: | 4.7% (244) |
| Washington: | 4.1% (47,238) |
| University Place: | 3.7% (191) |
| Washington: | 0.6% (6,294) |
| University Place: | 3.4% (174) |
| Washington: | 3.1% (35,872) |
| University Place: | 3.1% (162) |
| Washington: | 8.9% (101,353) |
| University Place: | 2.8% (145) |
| Washington: | 0.5% (5,640) |
| University Place: | 2.0% (101) |
| Washington: | 1.1% (12,735) |
| University Place: | 1.9% (100) |
| Washington: | 0.1% (652) |
| University Place: | 1.7% (88) |
| Washington: | 0.0% (456) |
| University Place: | 1.6% (83) |
| Washington: | 1.6% (17,761) |
Place of birth for U.S.-born residents:
- This state: 17,715
- Other state: 11,192
- Northeast: 1,534
- Midwest: 2,240
- South: 2,523
- West: 4,907
85.8% of University Place residents lived in the same house 1 years ago.
Out of people who lived in different houses, 36.6% lived in this county.
Out of people who lived in different counties, 57.2% lived in Washington.
| University Place: | 85.8% |
| State average: | 85.2% |
Education attainment for males 25 years and older:
- No schooling: 101
- Nursery to 4th grade: 25
- 5th and 6th grade: 22
- 7th and 8th grade: 12
- 9th grade: 23
- 10th grade: 48
- 11th grade: 8
- 12th grade, no diploma: 162
- High school graduate (or equivalency): 2,393
- Less than 1 year of college: 1,059
- Some college more than 1 year, no degree: 1,533
- Associate degree: 1,106
- Bachelor's degree: 2,752
- Master's degree: 1,291
- Professional school degree: 436
- Doctorate degree: 364

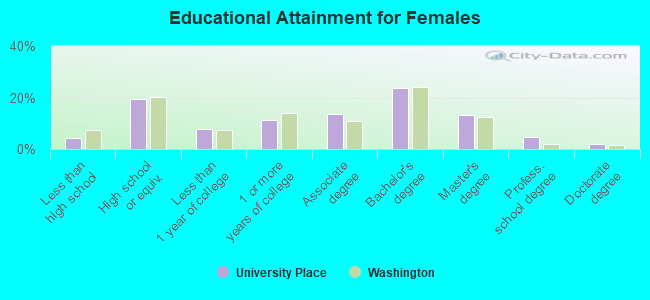
Education attainment for females 25 years and older:
- No schooling: 180
- Nursery to 4th grade: 11
- 5th and 6th grade: 42
- 7th and 8th grade: 0
- 9th grade: 14
- 10th grade: 107
- 11th grade: 76
- 12th grade, no diploma: 117
- High school graduate (or equivalency): 2,459
- Less than 1 year of college: 955
- Some college more than 1 year, no degree: 1,401
- Associate degree: 1,705
- Bachelor's degree: 2,987
- Master's degree: 1,664
- Professional school degree: 608
- Doctorate degree: 230


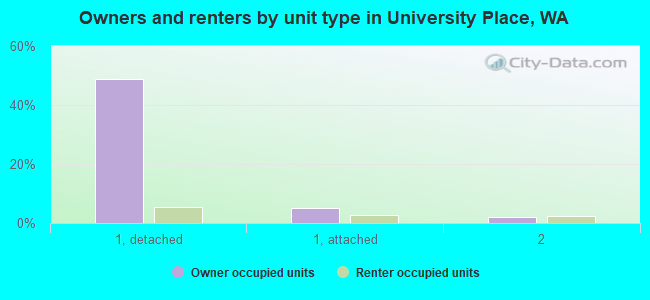
Housing units in structures:
- One, detached: 7,969
- One, attached: 990
- Two: 616
- 3 or 4: 1,217
- 5 to 9: 1,020
- 10 to 19: 1,160
- 20 to 49: 650
- 50 or more: 1,013
- Mobile homes: 87
- Boats, RVs, vans, etc.: 62
Median worth of mobile homes: $26,323
Housing units lacking complete kitchen facilities in 2022: 1.6%
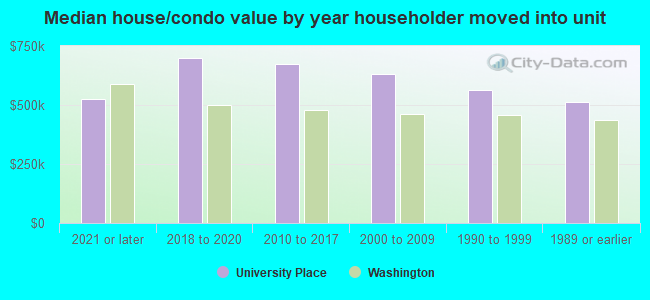
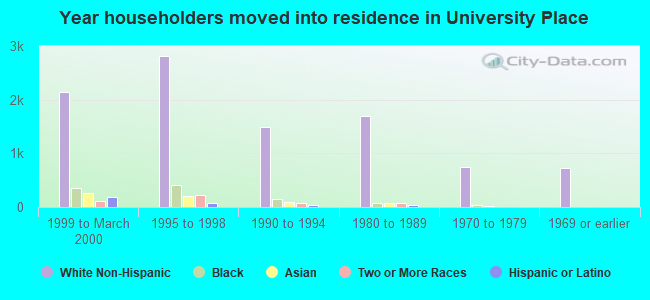
House/condo owner moved in on average 14 years ago
Renter moved in on average 4 years ago
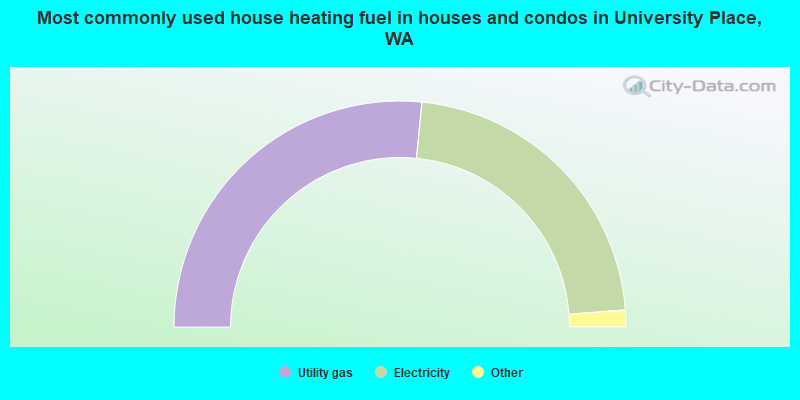
- 53.1%Utility gas
- 44.5%Electricity
- 1.1%Bottled, tank, or LP gas
- 0.8%Fuel oil, kerosene, etc.
- 0.2%Other fuel
- 0.2%Wood
- 0.2%No fuel used
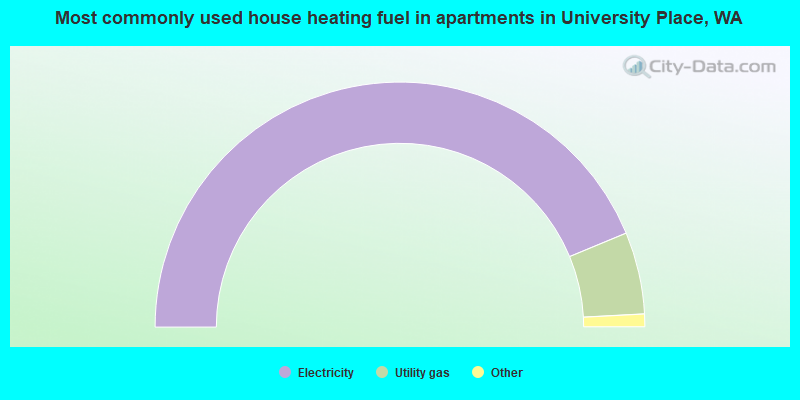
- 87.5%Electricity
- 10.8%Utility gas
- 0.8%Bottled, tank, or LP gas
- 0.5%No fuel used
- 0.2%Fuel oil, kerosene, etc.
- 0.2%Other fuel
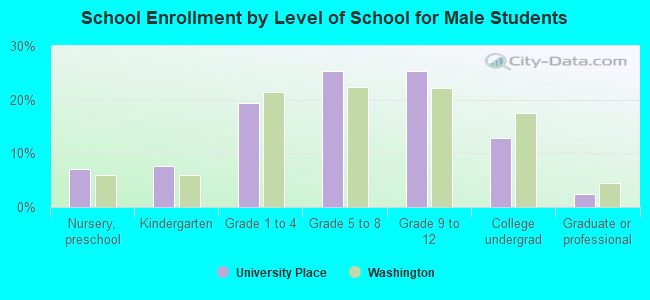
Private vs. public school enrollment:
| Here: | 9.5% |
| Washington: | 12.4% |
| Here: | 11.6% |
| Washington: | 9.2% |
| Here: | 20.5% |
| Washington: | 16.5% |