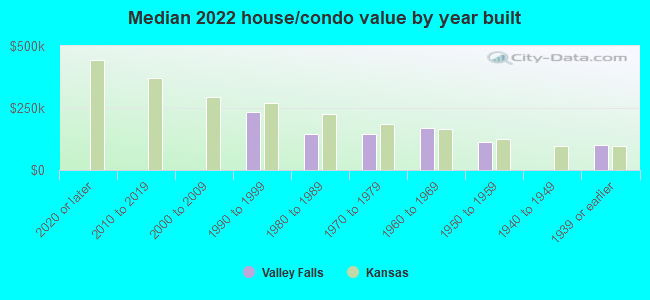
Valley Falls, KS (Kansas) Houses and Residents
| Valley Falls: | $127,583 |
| Kansas: | $206,600 |
Mean price in 2022:
Detached houses: $157,538
Here: $157,538 State: $264,181 Mobile homes: $21,613
Here: $21,613 State: $74,712
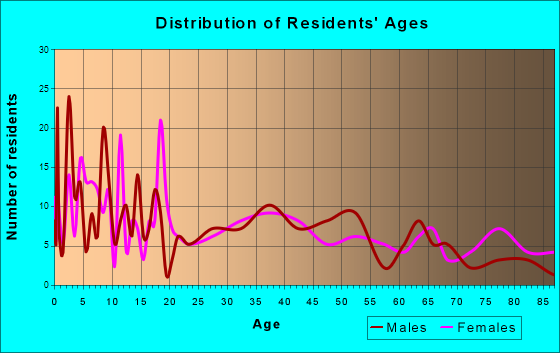
Total population: 1,158 (Urban population: 0, Rural population: 1,252 (all nonfarm))
Houses: 644 (586 occupied: 332 owner occupied, 260 renter occupied)
| % of renters here: | 44% |
| State: | 32% |
Housing density: 864 houses/condos per square mile
Median price asked for vacant for-sale houses and condos in 2022 in this county: $140,148.
Median contract rent in 2022: $580 (lower quartile is $552, upper quartile is $669)
Median rent asked for vacant for-rent units in 2022: $646
Median gross rent in Valley Falls, KS in 2022: $724
Housing units in Valley Falls with a mortgage: 187 (2 second mortgage, 0 home equity loan, 2 both second mortgage and home equity loan)
Houses without a mortgage: 4
Median household income for houses/condos with a mortgage: $86,553
Median household income for apartments without a mortgage: $51,625
Median monthly housing costs: $728
Compare current foreclosures near Valley Falls, KS:
| Photo | Address | Area | Beds / Baths | Price | Details |
|---|---|---|---|---|---|

|
#1
Walnut St
Valley Falls, KS 66088
|
920 sq. feet
|
1 baths 2 beds |
show details | |

|
#2
Oak St
Valley Falls, KS 66088
|
- sq. feet
|
- baths - beds |
show details | |

|
#3
12th St
Valley Falls, KS 66088
|
- sq. feet
|
- baths - beds |
show details | |

|
#4
Vermont Ave
Holton, KS 66436
|
1,796 sq. feet
|
2 baths 3 beds |
$37,900
|
show details |

|
#5
Overbrook Ln
Ozawkie, KS 66070
|
3,547 sq. feet
|
3 baths 5 beds |
show details | |

|
#6
Seabury St
Effingham, KS 66023
|
1,568 sq. feet
|
2 baths 3 beds |
show details | |

|
#7
NW 58th St
Topeka, KS 66617
|
816 sq. feet
|
1 baths 2 beds |
show details | |

|
#8
NE Edgewood Dr
Topeka, KS 66617
|
1,739 sq. feet
|
3 baths 4 beds |
show details | |

|
#9
NE 59th Ter
Topeka, KS 66617
|
1,365 sq. feet
|
2 baths 3 beds |
show details | |

|
#10
NE 62nd St
Topeka, KS 66617
|
2,844 sq. feet
|
3 baths 4 beds |
show details |
| Photo | Address | Area | Beds / Baths | Price | Details |
|---|---|---|---|---|---|

|
#11
102nd Rd
Hoyt, KS 66440
|
1,654 sq. feet
|
2 baths 4 beds |
show details | |

|
#12
102nd Rd
Hoyt, KS 66440
|
852 sq. feet
|
1 baths 2 beds |
show details | |

|
#13
Mckeage Ave
Hoyt, KS 66440
|
2,292 sq. feet
|
2 baths 4 beds |
show details | |

|
#14
123rd Ln
Hoyt, KS 66440
|
1,288 sq. feet
|
2 baths 3 beds |
show details | |

|
#15
George St
Effingham, KS 66023
|
1,224 sq. feet
|
1 baths 3 beds |
show details | |

|
#16
NE Edgewood Dr
Topeka, KS 66617
|
1,388 sq. feet
|
2 baths 3 beds |
show details | |

|
#17
Rock Creek Dr
Ozawkie, KS 66070
|
1,344 sq. feet
|
1 baths 2 beds |
show details | |

|
#18
W4 Rd
Holton, KS 66436
|
1,741 sq. feet
|
1 baths 2 beds |
show details | |

|
#19
Ridgeview Dr
Ozawkie, KS 66070
|
1,625 sq. feet
|
1 baths 2 beds |
show details | |

|
#20
Cherokee St
Oskaloosa, KS 66066
|
1,158 sq. feet
|
1 baths 2 beds |
show details |
| Photo | Address | Area | Beds / Baths | Price | Details |
|---|---|---|---|---|---|

|
#21
Prairie Bend Rd
Meriden, KS 66512
|
1,479 sq. feet
|
2 baths 3 beds |
show details | |

|
#22
Delaware Dr
Ozawkie, KS 66070
|
2,160 sq. feet
|
2 baths 3 beds |
show details | |

|
#23
Jesse James Rd
Ozawkie, KS 66070
|
1,350 sq. feet
|
1 baths 3 beds |
show details | |

|
#24
Delaware Dr
Ozawkie, KS 66070
|
1,136 sq. feet
|
1 baths 3 beds |
show details | |

|
#25
Walnut St
Nortonville, KS 66060
|
1,021 sq. feet
|
1 baths 2 beds |
show details | |

|
#26
New Jersey Ave
Holton, KS 66436
|
- sq. feet
|
- baths - beds |
show details | |

|
#27
Butler Rd
Grantville, KS 66429
|
- sq. feet
|
- baths - beds |
show details | |

|
#28
Parkview Ct
Holton, KS 66436
|
- sq. feet
|
- baths - beds |
show details | |

|
#29
Hamilton St
Oskaloosa, KS 66066
|
- sq. feet
|
- baths - beds |
show details | |

|
#30
N Taggart Ave
Nortonville, KS 66060
|
- sq. feet
|
- baths - beds |
show details |
| Photo | Address | Area | Beds / Baths | Price | Details |
|---|---|---|---|---|---|

|
#31
K16 Hwy
Mc Louth, KS 66054
|
- sq. feet
|
- baths - beds |
show details | |

|
#32
NW Rochester Rd
Topeka, KS 66617
|
- sq. feet
|
- baths - beds |
show details | |

|
#33
Highland Ave
Hoyt, KS 66440
|
- sq. feet
|
- baths - beds |
show details | |

|
#34
Central Ave
Hoyt, KS 66440
|
- sq. feet
|
- baths - beds |
show details | |

|
#35
E Clark St
Mayetta, KS 66509
|
- sq. feet
|
- baths - beds |
show details | |

|
#36
Kimberly Dr
Ozawkie, KS 66070
|
- sq. feet
|
- baths - beds |
show details | |

|
#37
Mcpherson Rd
Cummings, KS 66016
|
- sq. feet
|
- baths - beds |
show details | |

|
#38
S Rd
Mayetta, KS 66509
|
- sq. feet
|
- baths - beds |
show details | |

|
Check over 1 million property listings on Foreclosure.com!
|
browse all offers | |||


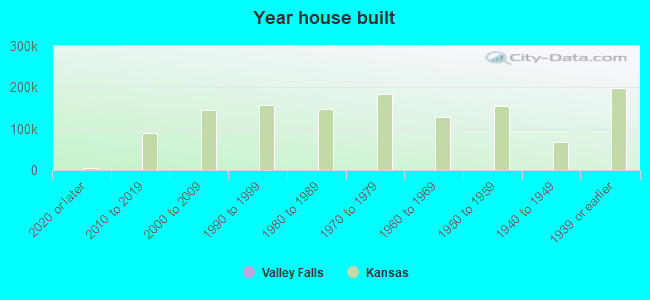
Median year apartment built: 2000
Household type by relationship:
Households: 1,192- Male householders: 160 (28 living alone), Female householders: 420 (224 living alone)
217 spouses (217 opposite-sex spouses), 9 unmarried partners, (9 opposite-sex unmarried partners), 268 children (261 natural, 0 adopted, 7 stepchildren), 0 grandchildren, 32 brothers or sisters, 6 parents, 0 foster children, 0 other relatives, 10 non-relatives
- In group quarters: 70
Size of family households: 176 2-persons, 78 3-persons, 55 4-persons, 5 5-persons.
Size of nonfamily households: 262 1-person, 15 2-persons.
147 married couples with children.
64 single-parent households (15 men, 49 women).
98.3% of residents of Valley Falls speak English at home.
2.0% of residents speak Spanish at home (83% speak English very well, 17% speak English well).
0.2% of residents speak other Indo-European language at home (100% speak English very well).
Foreign born population: 9 (0.8%)
(33.3% of them are naturalized citizens)
| Here: | 7.0 |
| State: | 6.9 |
| Here: | 5.0 |
| State: | 4.4 |
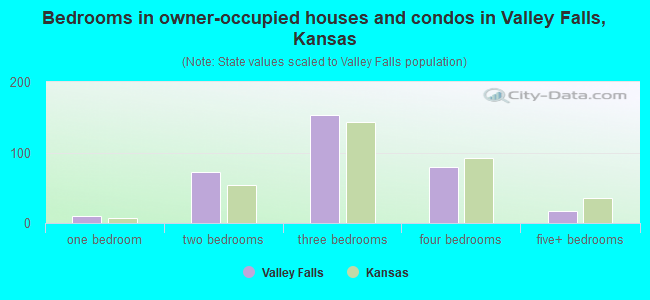
- Bedrooms in owner-occupied houses and condos in Valley Falls, Kansas
- 0no bedroom
- 101 bedroom
- 722 bedrooms
- 1533 bedrooms
- 804 bedrooms
- 175+ bedrooms
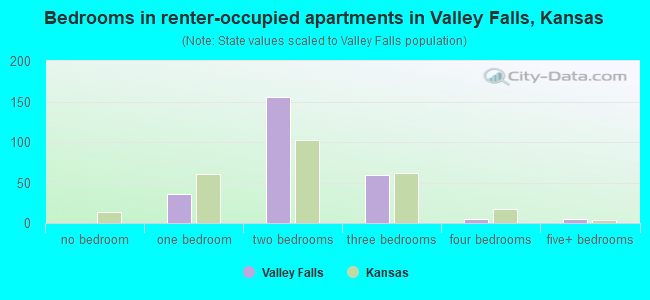
- Bedrooms in renter-occupied apartments in Valley Falls, Kansas
- 0no bedroom
- 361 bedroom
- 1562 bedrooms
- 593 bedrooms
- 54 bedrooms
- 55+ bedrooms
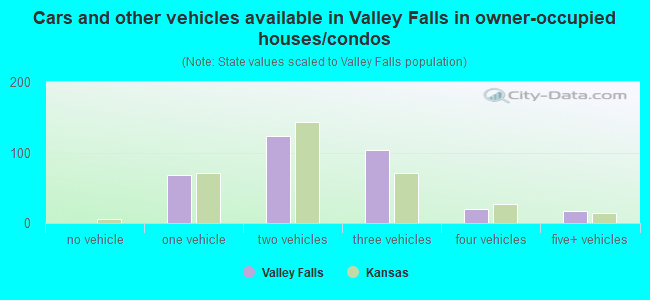
- Cars and other vehicles available in Valley Falls in owner-occupied houses/condos
- 0no vehicle
- 681 vehicle
- 1242 vehicles
- 1033 vehicles
- 204 vehicles
- 175+ vehicles
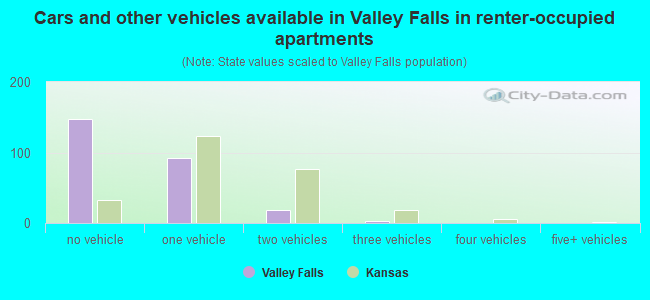
- Cars and other vehicles available in Valley Falls in renter-occupied apartments
- 147no vehicle
- 921 vehicle
- 182 vehicles
- 33 vehicles
- 04 vehicles
- 05+ vehicles
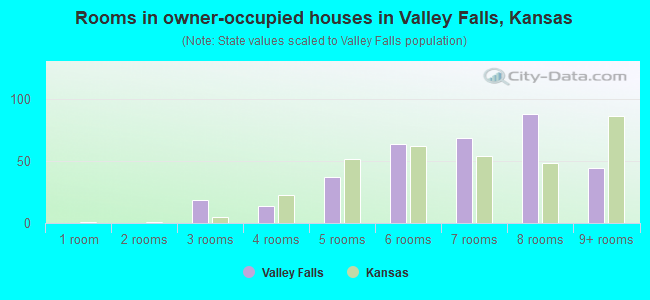
- Rooms in owner-occupied houses in Valley Falls, Kansas
- 01 room
- 02 rooms
- 183 rooms
- 134 rooms
- 375 rooms
- 636 rooms
- 697 rooms
- 888 rooms
- 449+ rooms
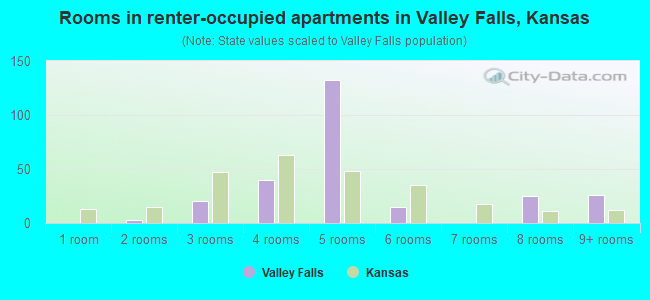
- Rooms in renter-occupied apartments in Valley Falls, Kansas
- 01 room
- 32 rooms
- 203 rooms
- 404 rooms
- 1325 rooms
- 156 rooms
- 07 rooms
- 258 rooms
- 269+ rooms
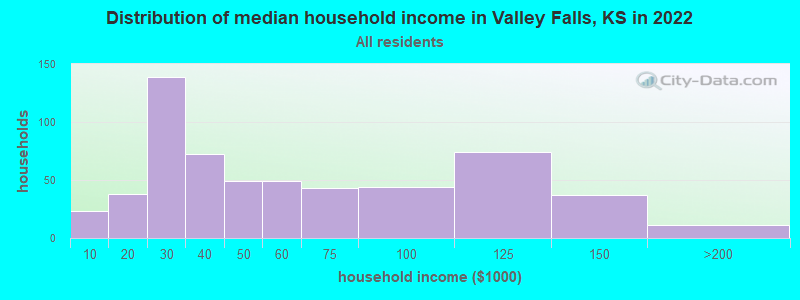
Valley Falls, KS household income distribution

- 23Less than $10,000
- 38$10,000 to $19,999
- 139$20,000 to $29,999
- 72$30,000 to $39,999
- 49$40,000 to $49,999
- 49$50,000 to $59,999
- 43$60,000 to $74,999
- 44$75,000 to $99,999
- 74$100,000 to $124,999
- 37$125,000 to $149,999
- 11$150,000 to $199,999
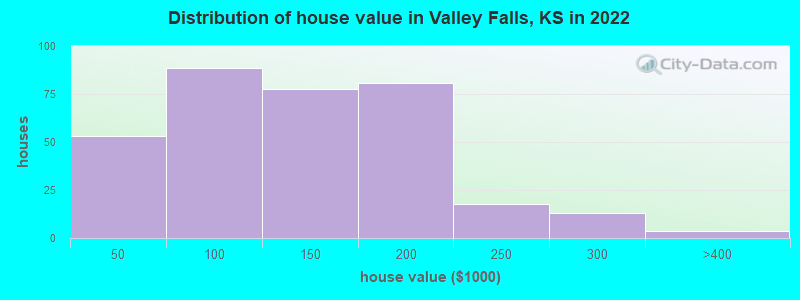
Home value of owner - occupied houses in 2022 in Valley Falls, KS
-
- 4$10,000 to $14,999
- 5$15,000 to $19,999
- 5$20,000 to $24,999
- 12$30,000 to $34,999
- 6$35,000 to $39,999
- 18$40,000 to $49,999
- 6$50,000 to $59,999
- 23$60,000 to $69,999
- 28$80,000 to $89,999
- 11$90,000 to $99,999
- 52$100,000 to $124,999
- 25$125,000 to $149,999
- 66$150,000 to $174,999
- 14$175,000 to $199,999
- 17$200,000 to $249,999
- 13$250,000 to $299,999
- 3$300,000 to $399,999
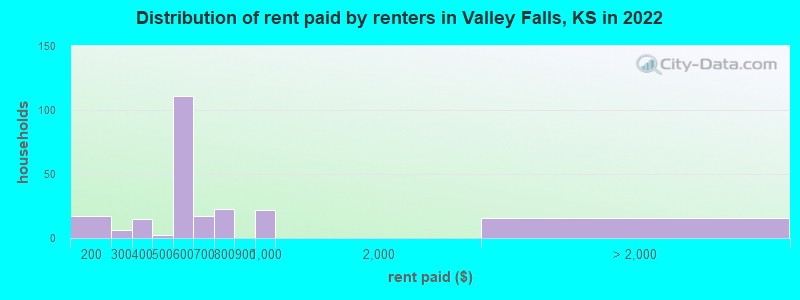
Rent paid by renters in 2022 in Valley Falls, KS
-
- 3$100 to $149
- 13$150 to $199
- 5$250 to $299
- 8$300 to $349
- 7$350 to $399
- 1$450 to $499
- 18$500 to $549
- 92$550 to $599
- 7$600 to $649
- 9$650 to $699
- 22$700 to $749
- 22$900 to $999
- 7$2,500 to $2,999
- 8No cash rent
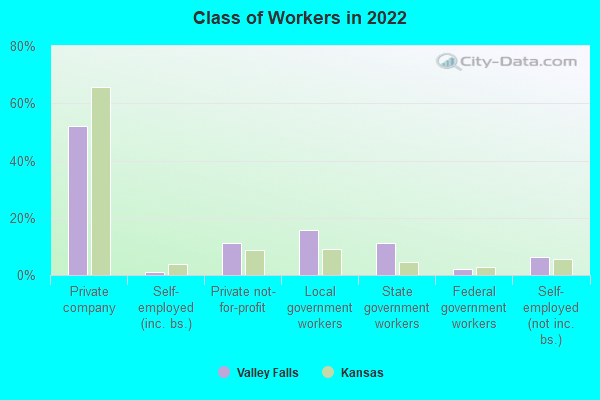
Percentage of workers working in this county: 42.4%
Number of people working at home: 62 (11.1% of all workers)
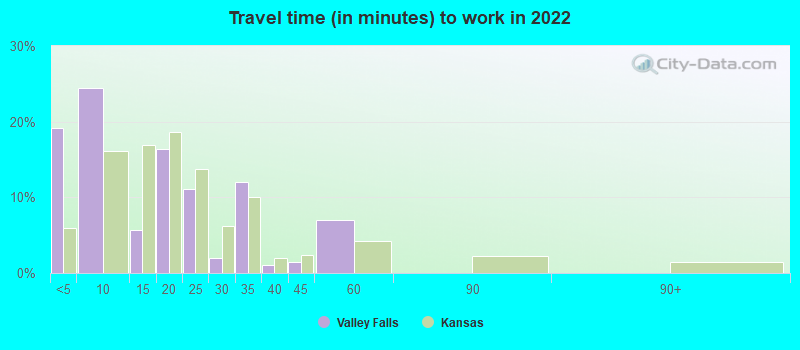
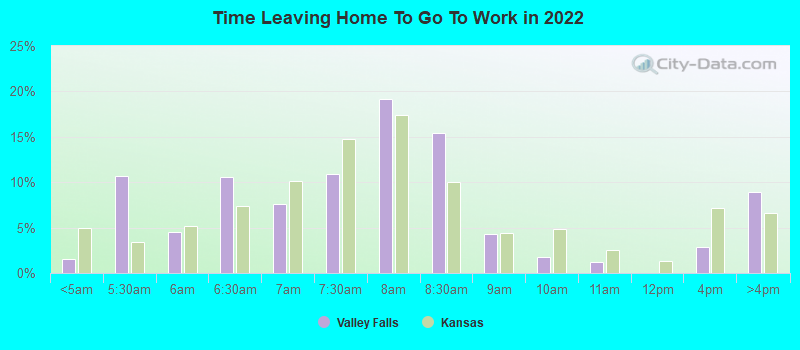
Travel time to work (commute)
- Less than 5 minutes: 66
- 5 to 9 minutes: 92
- 10 to 14 minutes: 0
- 15 to 19 minutes: 41
- 20 to 24 minutes: 7
- 25 to 29 minutes: 6
- 30 to 34 minutes: 102
- 35 to 39 minutes: 47
- 40 to 44 minutes: 65
- 45 to 59 minutes: 37
- 60 to 89 minutes: 11
- 90 or more minutes: 5
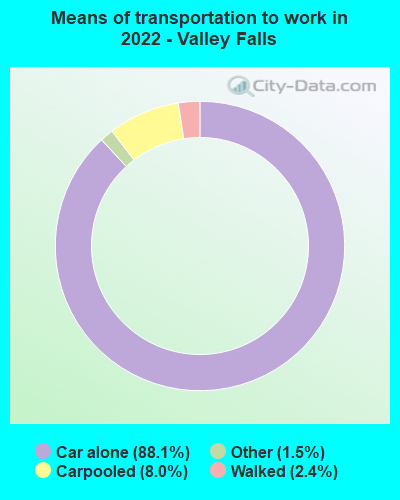
Means of transportation to work:
- Drove a car alone: 353 (76.1%)
- Carpooled: 32 (6.9%)
- Taxi: 6 (1.3%)
- Walked: 10 (2.2%)
- Worked at home: 62 (13.4%)
- Unemployment by race in 2022
- Unemployment rate for White non-Hispanic residents
- 4.1%Males
- 1.5%Females
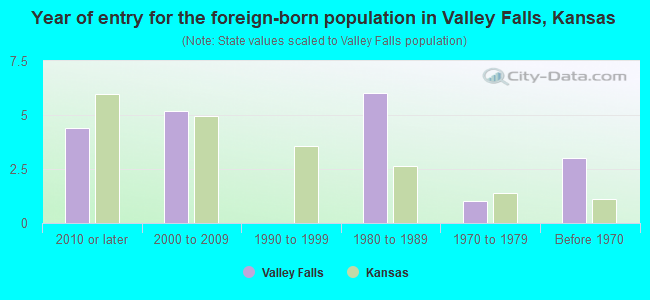
- Year of entry for the foreign-born population in Valley Falls, Kansas
- 42010 or later
- 52000 to 2009
- 01990 to 1999
- 61980 to 1989
- 11970 to 1979
- 3Before 1970
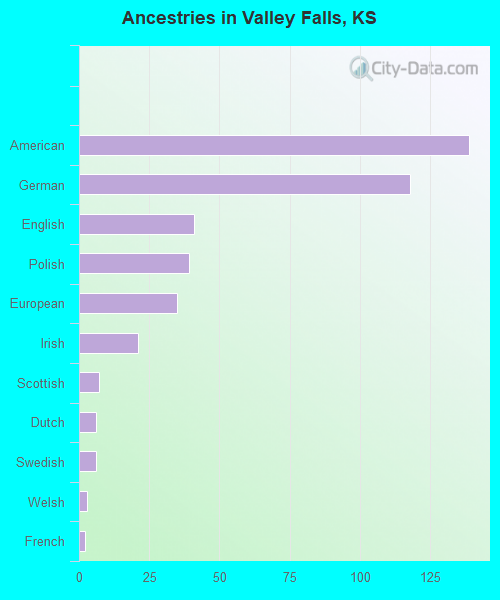
First ancestries reported:
- American: 139 (28.8%)
- German: 118 (24.5%)
- English: 41 (8.5%)
- Polish: 39 (8.1%)
- European: 35 (7.3%)
- Irish: 21 (4.4%)
- Scottish: 7 (1.5%)
- Dutch: 6 (1.2%)
- Swedish: 6 (1.2%)
- Welsh: 3 (0.6%)
- French: 2 (0.4%)
Most common places of birth for foreign-born residents (%):
| Valley Falls: | 44.4% (4) |
| Kansas: | 39.2% (81,282) |
| Valley Falls: | 33.3% (3) |
| Kansas: | 0.8% (1,646) |
Place of birth for U.S.-born residents:
- This state: 948
- Other state: 235
- Northeast: 5
- Midwest: 138
- South: 64
- West: 25
80.8% of Valley Falls residents lived in the same house 1 years ago.
Out of people who lived in different houses, 23.1% lived in this county.
Out of people who lived in different counties, 65.9% lived in Kansas.
| Valley Falls: | 80.8% |
| State average: | 85.3% |
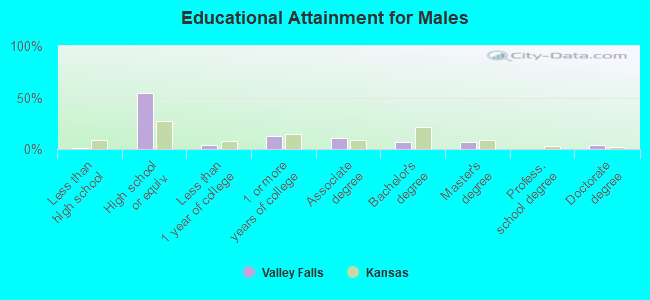
Education attainment for males 25 years and older:
- No schooling: 0
- Nursery to 4th grade: 0
- 5th and 6th grade: 0
- 7th and 8th grade: 0
- 9th grade: 0
- 10th grade: 0
- 11th grade: 1
- 12th grade, no diploma: 1
- High school graduate (or equivalency): 175
- Less than 1 year of college: 13
- Some college more than 1 year, no degree: 40
- Associate degree: 35
- Bachelor's degree: 21
- Master's degree: 23
- Professional school degree: 0
- Doctorate degree: 11
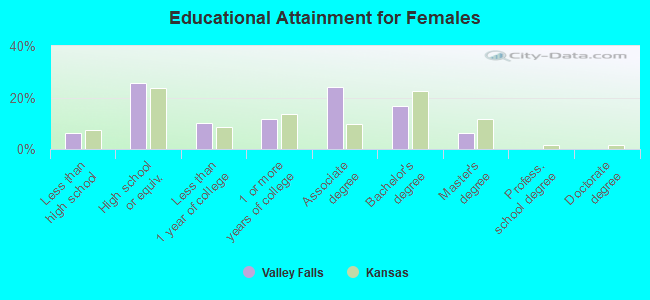
Education attainment for females 25 years and older:
- No schooling: 3
- Nursery to 4th grade: 0
- 5th and 6th grade: 0
- 7th and 8th grade: 19
- 9th grade: 3
- 10th grade: 6
- 11th grade: 5
- 12th grade, no diploma: 0
- High school graduate (or equivalency): 150
- Less than 1 year of college: 58
- Some college more than 1 year, no degree: 68
- Associate degree: 140
- Bachelor's degree: 97
- Master's degree: 36
- Professional school degree: 0
- Doctorate degree: 0
Housing units in structures:
- One, detached: 462
- Two: 139
- 3 or 4: 8
- 10 to 19: 4
- 20 to 49: 15
- Mobile homes: 16
Housing units lacking complete kitchen facilities in 2022: 1.1%
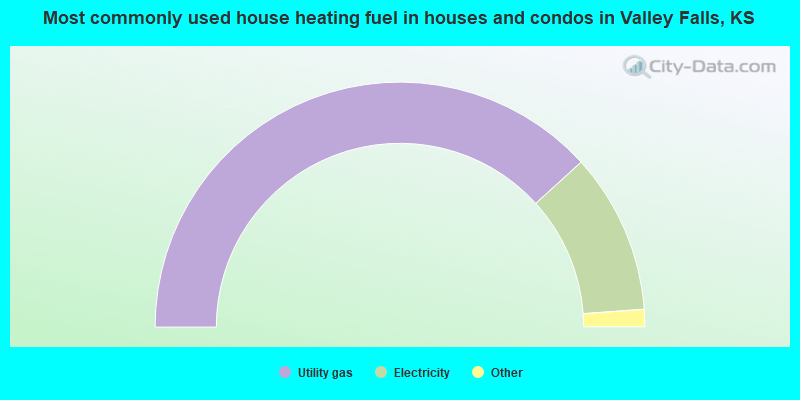
- 76.6%Utility gas
- 21.2%Electricity
- 1.2%Wood
- 0.9%Bottled, tank, or LP gas
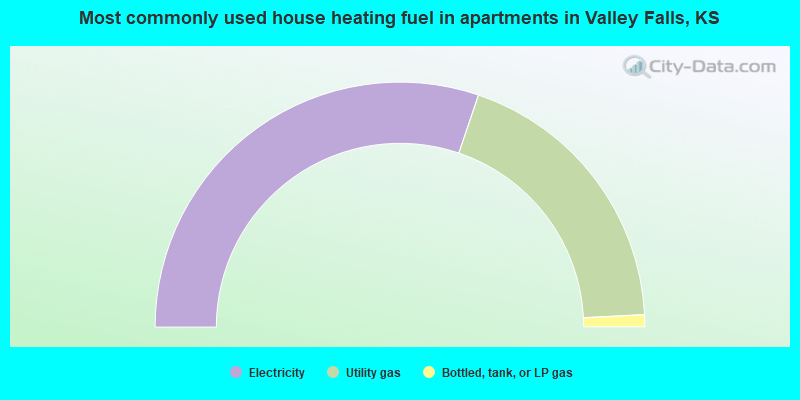
- 60.4%Electricity
- 38.0%Utility gas
- 1.6%Bottled, tank, or LP gas
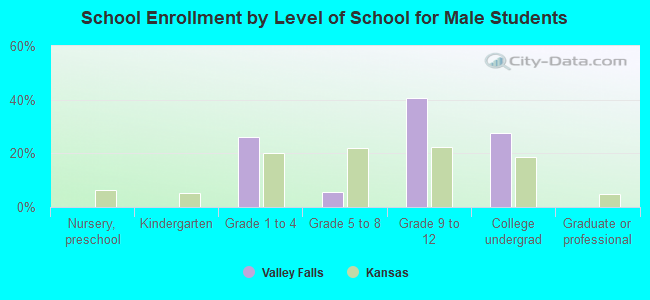
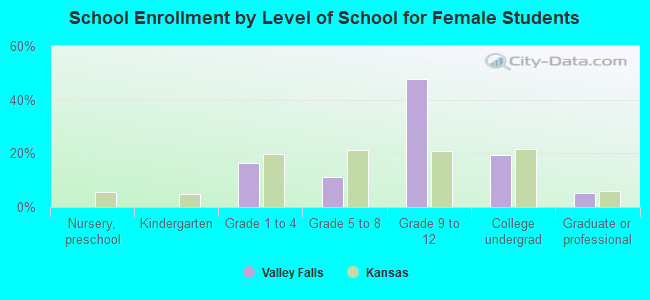
Private vs. public school enrollment:
| Here: | 30.5% |
| Kansas: | 14.1% |
| Here: | 0.0% |
| Kansas: | 10.8% |
| Here: | 0.0% |
| Kansas: | 15.4% |