Washington, DC (District of Columbia) Houses and Residents
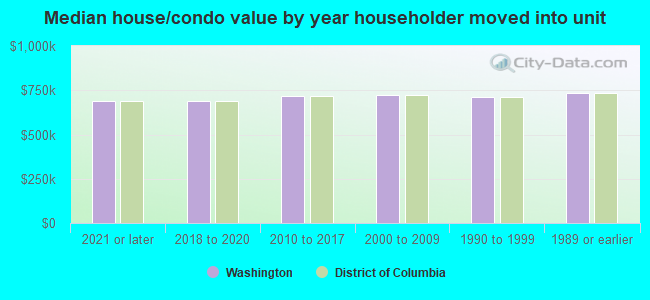
| Washington: | $711,100 |
| District of Columbia: | $711,100 |
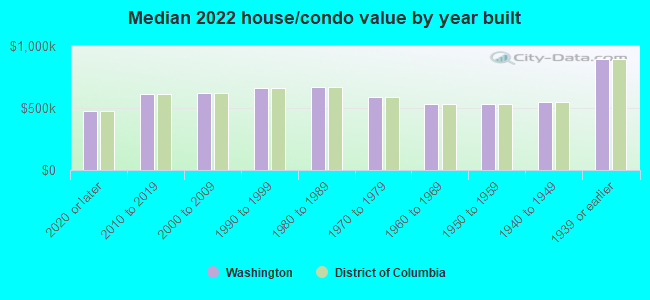
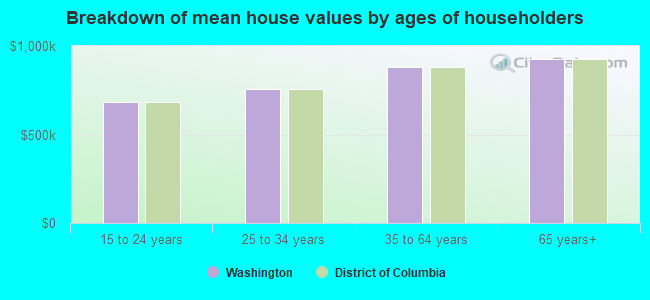
Mean price in 2022:
Detached houses: $1,228,031
Here: $1,228,031 State: $1,228,031 Townhouses or other attached units: $898,544
Here: $898,544 State: $898,544 In 2-unit structures: $898,746
Here: $898,746 State: $898,746 In 3-to-4-unit structures: $622,146
Here: $622,146 State: $622,146 In 5-or-more-unit structures: $614,699
Here: $614,699 State: $614,699
Total population: 658,893 (Urban population: 572,059, Rural population: 0)
Houses: 360,862 (326,970 occupied: 134,120 owner occupied, 192,850 renter occupied)
| % of renters here: | 59% |
| State: | 59% |
Housing density: 5,877 houses/condos per square mile
Median price asked for vacant for-sale houses and condos in 2022: $858,835.
Median contract rent in 2022: $1,768 (lower quartile is $1,195, upper quartile is over $2,000)
Median rent asked for vacant for-rent units in 2022: $2,445
Median gross rent in Washington, DC in 2022: $1,843
Housing units in Washington with a mortgage: 99,094 (11,375 second mortgage, 671 home equity loan, 8,086 both second mortgage and home equity loan)
Houses without a mortgage: 1,614
Median household income for houses/condos with a mortgage: $171,105
Median household income for apartments without a mortgage: $109,361
Median monthly housing costs: $1,976
Compare current foreclosures in Washington, DC:
| Photo | Address | Area | Beds / Baths | Price | Details |
|---|---|---|---|---|---|

|
#1
19th St NW
Washington, DC 20036
|
2,515 sq. feet
|
6 baths 8 beds |
$1,684,800
|
show details |

|
#2
17th St NW Apt 504
Washington, DC 20009
|
800 sq. feet
|
1 baths 1 beds |
$419,900
|
show details |

|
#3
Eastern Ave NE
Washington, DC 20011
|
1,024 sq. feet
|
1 baths 3 beds |
$395,000
|
show details |

|
#4
Cathedral Ave NW Apt 108
Washington, DC 20016
|
765 sq. feet
|
1 baths 1 beds |
$279,900
|
show details |

|
#5
Delaware Ave SW Apt N720
Washington, DC 20024
|
- sq. feet
|
1 baths 1 beds |
$155,000
|
show details |

|
#6
T St SE Apt 3
Washington, DC 20020
|
- sq. feet
|
2 baths 4 beds |
$339,900
|
show details |

|
#7
4th St NE Apt 2
Washington, DC 20002
|
1,061 sq. feet
|
2 baths 2 beds |
show details | |

|
#8
Southern Ave SE
Washington, DC 20019
|
1,024 sq. feet
|
1 baths 3 beds |
show details | |

|
#9
Kalmia Rd NW
Washington, DC 20012
|
2,382 sq. feet
|
4 baths 4 beds |
show details | |

|
#10
Bowen Rd SE Apt 403
Washington, DC 20020
|
930 sq. feet
|
1 baths 2 beds |
show details |
| Photo | Address | Area | Beds / Baths | Price | Details |
|---|---|---|---|---|---|

|
#11
Barnaby St SE
Washington, DC 20032
|
2,092 sq. feet
|
2 baths 4 beds |
show details | |

|
#12
Connecticut Ave NW Apt 606
Washington, DC 20008
|
160 sq. feet
|
1 baths 1 beds |
show details | |

|
#13
Wahler Pl SE
Washington, DC 20032
|
1,364 sq. feet
|
2 baths 3 beds |
show details | |

|
#14
Ridge Rd SE
Washington, DC 20019
|
720 sq. feet
|
2 baths 1 beds |
show details | |

|
#15
Oklahoma Ave NE Apt 203
Washington, DC 20002
|
- sq. feet
|
1 baths 1 beds |
show details | |

|
#16
T Pl SE
Washington, DC 20020
|
900 sq. feet
|
2 baths 2 beds |
show details | |

|
#17
Astor Pl SE
Washington, DC 20019
|
2,516 sq. feet
|
4 baths 4 beds |
show details | |

|
#18
46th St SE
Washington, DC 20019
|
1,232 sq. feet
|
2 baths 3 beds |
show details | |

|
#19
Cathedral Ave NW Apt 404w
Washington, DC 20016
|
803 sq. feet
|
1 baths 1 beds |
show details | |

|
#20
Underwood Pl NW
Washington, DC 20012
|
1,088 sq. feet
|
3 baths 3 beds |
show details |
| Photo | Address | Area | Beds / Baths | Price | Details |
|---|---|---|---|---|---|

|
#21
Fern Pl NW
Washington, DC 20012
|
1,920 sq. feet
|
1 baths 4 beds |
show details | |

|
#22
1918 M Street NE
Washington, DC 20002
|
5,487 sq. feet
|
12 baths 18 beds |
show details | |

|
#23
Dubois Pl SE
Washington, DC 20019
|
1,024 sq. feet
|
2 baths 3 beds |
show details | |

|
#24
Sargent Rd NE
Washington, DC 20017
|
1,360 sq. feet
|
2 baths 3 beds |
show details | |

|
#25
Ord St NE
Washington, DC 20019
|
2,888 sq. feet
|
2 baths 4 beds |
show details | |

|
#26
Branch Ave SE
Washington, DC 20019
|
992 sq. feet
|
1 baths 3 beds |
show details | |

|
#27
49th St NE
Washington, DC 20019
|
1,355 sq. feet
|
1 baths 3 beds |
show details | |

|
#28
Good Hope Rd SE Apt 207
Washington, DC 20020
|
- sq. feet
|
1 baths 1 beds |
show details | |

|
#29
Highwood Pl SE
Washington, DC 20020
|
1,576 sq. feet
|
3 baths 3 beds |
show details | |

|
#30
N Capitol St NE
Washington, DC 20011
|
1,240 sq. feet
|
2 baths 3 beds |
show details |
| Photo | Address | Area | Beds / Baths | Price | Details |
|---|---|---|---|---|---|

|
#31
Sudbury Ln NW
Washington, DC 20012
|
3,520 sq. feet
|
4 baths 5 beds |
show details | |

|
#32
Edson Pl NE
Washington, DC 20019
|
1,315 sq. feet
|
1 baths 4 beds |
show details | |

|
#33
Alaska Ave NW
Washington, DC 20012
|
1,768 sq. feet
|
2 baths 3 beds |
show details | |

|
#34
Corcoran St NW
Washington, DC 20009
|
1,708 sq. feet
|
1 baths 3 beds |
show details | |

|
#35
41st St SE
Washington, DC 20020
|
1,160 sq. feet
|
1 baths 3 beds |
show details | |

|
#36
Oglethorpe St NE
Washington, DC 20011
|
1,123 sq. feet
|
1 baths 3 beds |
show details | |

|
#37
2nd St NE
Washington, DC 20002
|
1,202 sq. feet
|
2 baths 2 beds |
show details | |

|
#38
Highwood Dr SE
Washington, DC 20020
|
1,600 sq. feet
|
1 baths 3 beds |
show details | |

|
#39
Redwood Ter NW
Washington, DC 20012
|
2,599 sq. feet
|
4 baths 4 beds |
show details | |

|
#40
I St NE
Washington, DC 20002
|
1,310 sq. feet
|
1 baths 3 beds |
show details |
| Photo | Address | Area | Beds / Baths | Price | Details |
|---|---|---|---|---|---|

|
#41
29th St NW
Washington, DC 20015
|
1,508 sq. feet
|
3 baths 4 beds |
show details | |

|
#42
Eastern Ave NE
Washington, DC 20011
|
1,682 sq. feet
|
2 baths 3 beds |
show details | |

|
#43
33rd St NE
Washington, DC 20019
|
832 sq. feet
|
1 baths 2 beds |
show details | |

|
#44
Dahlia St NW
Washington, DC 20012
|
1,296 sq. feet
|
1 baths 5 beds |
show details | |

|
#45
Mckinley St NW
Washington, DC 20015
|
1,894 sq. feet
|
2 baths 3 beds |
show details | |

|
#46
Illinois Ave NW
Washington, DC 20011
|
1,680 sq. feet
|
2 baths 4 beds |
show details | |

|
#47
Central Ave SE
Washington, DC 20019
|
996 sq. feet
|
1 baths 2 beds |
show details | |

|
#48
Barnaby St SE
Washington, DC 20032
|
1,646 sq. feet
|
2 baths 3 beds |
show details | |

|
#49
16th St SE
Washington, DC 20003
|
960 sq. feet
|
1 baths 3 beds |
show details | |

|
Check over 1 million property listings on Foreclosure.com!
|
browse all offers | |||

Latest news about housing in Washington, DC collected exclusively by city-data.com from local newspapers, TV, and radio stations


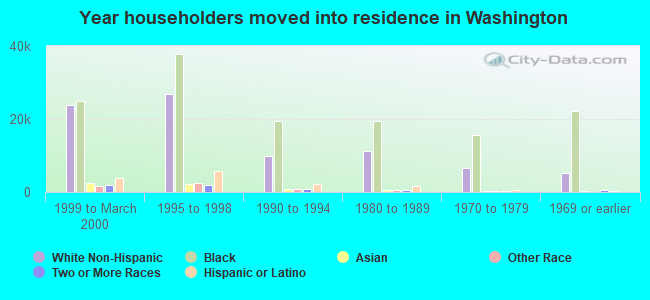
Median year apartment built: 1969
Household type by relationship:
Households: 671,803- Male householders: 146,838 (71,513 living alone), Female householders: 180,132 (87,327 living alone)
77,514 spouses (71,463 opposite-sex spouses), 29,825 unmarried partners, (24,026 opposite-sex unmarried partners), 137,000 children (132,171 natural, 2,667 adopted, 2,162 stepchildren), 17,226 grandchildren, 7,507 brothers or sisters, 3,846 parents, 260 foster children, 6,774 other relatives, 26,906 non-relatives
- In group quarters: 37,975
Size of family households: 62,095 2-persons, 27,149 3-persons, 21,075 4-persons, 8,212 5-persons, 3,455 6-persons, 1,882 7-or-more-persons.
Size of nonfamily households: 158,840 1-person, 37,049 2-persons, 3,972 3-persons, 1,659 4-persons, 1,041 5-persons, 382 6-persons, 159 7-or-more-persons.
60,153 married couples with children.
46,421 single-parent households (4,439 men, 41,982 women).
79.4% of residents of Washington speak English at home.
9.4% of residents speak Spanish at home (75% speak English very well, 13% speak English well, 10% speak English not well, 2% don't speak English at all).
5.1% of residents speak other Indo-European language at home (89% speak English very well, 8% speak English well, 2% speak English not well).
2.4% of residents speak Asian or Pacific Island language at home (74% speak English very well, 20% speak English well, 5% speak English not well, 1% don't speak English at all).
3.6% of residents speak other language at home (55% speak English very well, 28% speak English well, 15% speak English not well, 2% don't speak English at all).
Foreign born population: 99,898 (14.9%)
(50.9% of them are naturalized citizens)
| Here: | 5.9 |
| State: | 5.9 |
| Here: | 3.2 |
| State: | 3.2 |
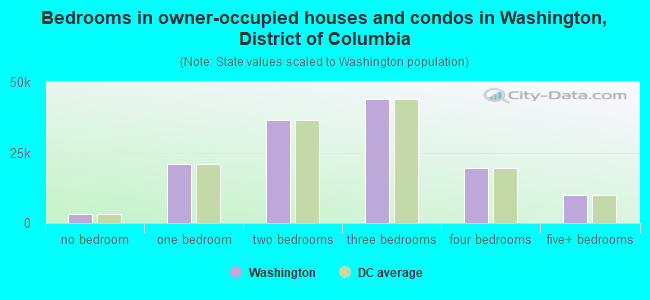
- Bedrooms in owner-occupied houses and condos in Washington, District of Columbia
- 3,212no bedroom
- 20,9291 bedroom
- 36,4182 bedrooms
- 44,1163 bedrooms
- 19,6204 bedrooms
- 9,8255+ bedrooms
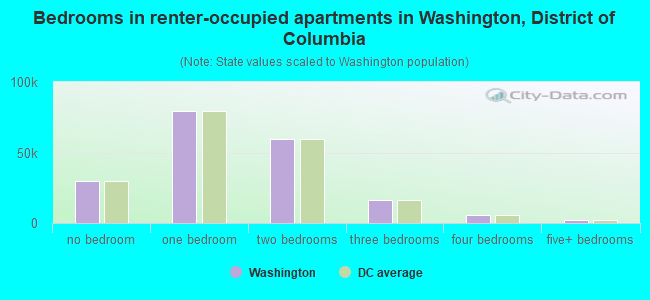
- Bedrooms in renter-occupied apartments in Washington, District of Columbia
- 29,620no bedroom
- 79,2721 bedroom
- 59,8592 bedrooms
- 16,6663 bedrooms
- 5,5714 bedrooms
- 1,8625+ bedrooms
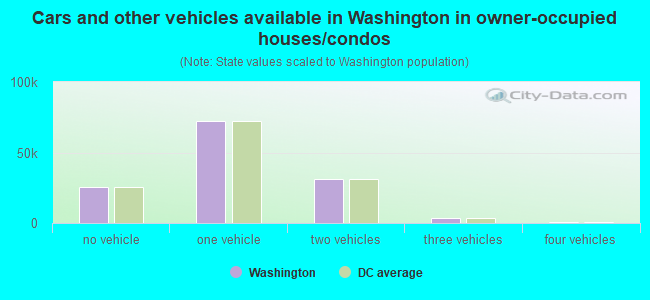
- Cars and other vehicles available in Washington in owner-occupied houses/condos
- 25,381no vehicle
- 72,3361 vehicle
- 31,1992 vehicles
- 3,8663 vehicles
- 9714 vehicles
- 3675+ vehicles
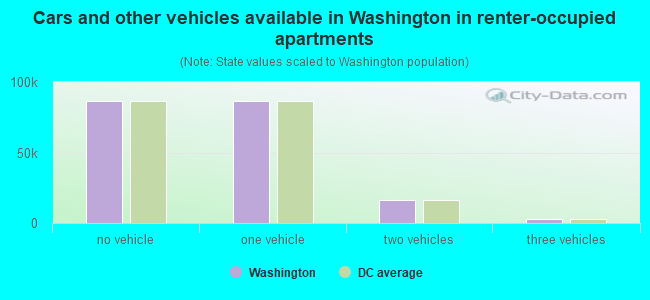
- Cars and other vehicles available in Washington in renter-occupied apartments
- 86,857no vehicle
- 86,4691 vehicle
- 16,1472 vehicles
- 2,7173 vehicles
- 4254 vehicles
- 2355+ vehicles
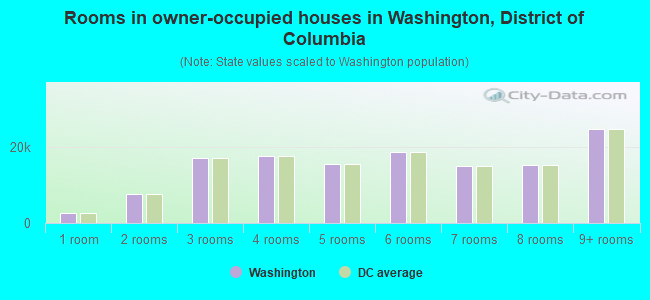
- Rooms in owner-occupied houses in Washington, District of Columbia
- 2,5631 room
- 7,6642 rooms
- 17,0943 rooms
- 17,5874 rooms
- 15,4775 rooms
- 18,6716 rooms
- 15,0607 rooms
- 15,2578 rooms
- 24,7479+ rooms
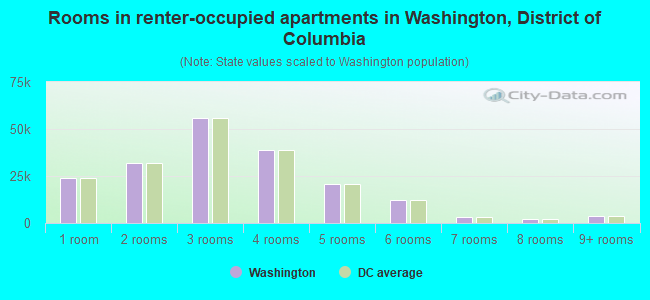
- Rooms in renter-occupied apartments in Washington, District of Columbia
- 23,8521 room
- 31,8272 rooms
- 55,6443 rooms
- 39,0664 rooms
- 20,5445 rooms
- 12,2006 rooms
- 3,4557 rooms
- 2,3078 rooms
- 3,9559+ rooms
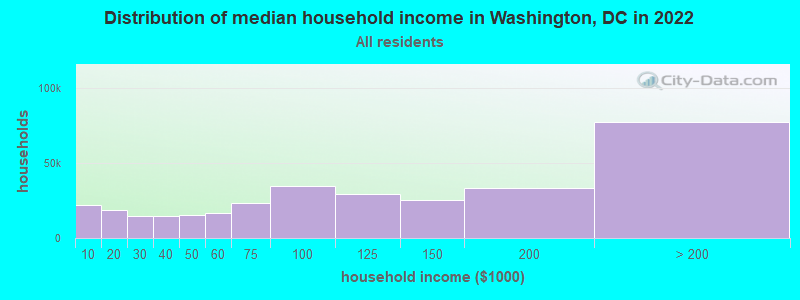
Washington, DC household income distribution

- 22,335Less than $10,000
- 18,853$10,000 to $19,999
- 14,865$20,000 to $29,999
- 14,792$30,000 to $39,999
- 15,388$40,000 to $49,999
- 16,687$50,000 to $59,999
- 23,613$60,000 to $74,999
- 34,933$75,000 to $99,999
- 29,164$100,000 to $124,999
- 25,245$125,000 to $149,999
- 33,533$150,000 to $199,999
- 77,562$200,000 or more
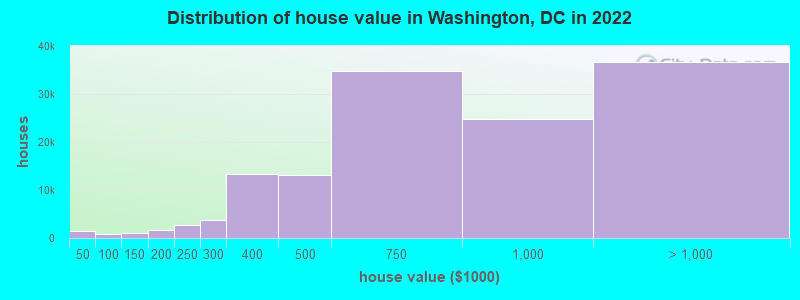
Home value of owner - occupied houses in 2022 in Washington, DC
-
- 836Less than $10,000
- 119$20,000 to $24,999
- 111$25,000 to $29,999
- 59$30,000 to $34,999
- 49$35,000 to $39,999
- 229$40,000 to $49,999
- 100$50,000 to $59,999
- 267$60,000 to $69,999
- 167$70,000 to $79,999
- 902$100,000 to $124,999
- 125$125,000 to $149,999
- 1,270$150,000 to $174,999
- 496$175,000 to $199,999
- 2,786$200,000 to $249,999
- 3,839$250,000 to $299,999
- 13,235$300,000 to $399,999
- 13,101$400,000 to $499,999
- 34,788$500,000 to $749,999
- 24,882$750,000 to $999,999
- 20,718$1,000,000 to $1,499,999
- 8,542$1,500,000 to $1,999,999
- 7,499$2,000,000 or more
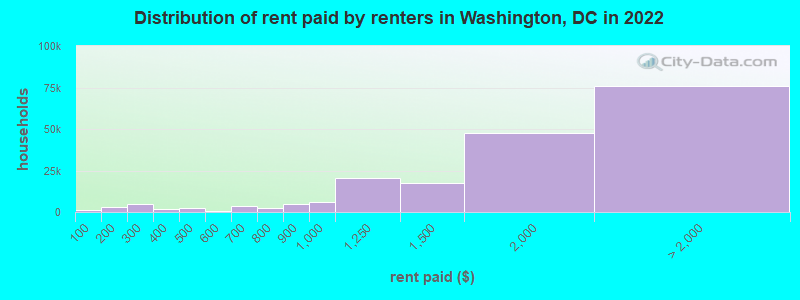
Rent paid by renters in 2022 in Washington, DC
-
- 1,482Less than $100
- 1,473$100 to $149
- 1,712$150 to $199
- 2,366$200 to $249
- 2,555$250 to $299
- 1,027$300 to $349
- 645$350 to $399
- 1,825$400 to $449
- 694$450 to $499
- 510$500 to $549
- 277$550 to $599
- 2,023$600 to $649
- 1,731$650 to $699
- 1,577$700 to $749
- 655$750 to $799
- 4,594$800 to $899
- 6,088$900 to $999
- 20,455$1,000 to $1,249
- 17,181$1,250 to $1,499
- 47,786$1,500 to $1,999
- 26,071$2,000 to $2,499
- 20,798$2,500 to $2,999
- 11,998$3,000 to $3,499
- 13,356$3,500 or more
- 3,971No cash rent

Percentage of workers working in this county: 83.9%
Number of people working at home: 126,259 (33.8% of all workers)

Travel time to work (commute)
- Less than 5 minutes: 3,396
- 5 to 9 minutes: 11,082
- 10 to 14 minutes: 14,942
- 15 to 19 minutes: 30,187
- 20 to 24 minutes: 35,867
- 25 to 29 minutes: 21,105
- 30 to 34 minutes: 53,343
- 35 to 39 minutes: 11,753
- 40 to 44 minutes: 15,987
- 45 to 59 minutes: 30,831
- 60 to 89 minutes: 15,843
- 90 or more minutes: 3,348

Means of transportation to work:
- Drove a car alone: 315,829 (45.6%)
- Carpooled: 45,462 (6.6%)
- Bus: 43,620 (6.3%)
- Subway or elevated rail: 83,205 (12.0%)
- Long-distance train or commuter rail: 10,732 (1.5%)
- Light rail, streetcar or trolley: 1,588 (0.2%)
- Ferryboat: 45 (0.0%)
- Taxi: 15,077 (2.2%)
- Bicycle: 12,831 (1.9%)
- Walked: 38,447 (5.5%)
- Worked at home: 126,259 (18.2%)
- Unemployment by race in 2022
- Unemployment rate for White non-Hispanic residents
- 2.7%Males
- 2.6%Females
- Unemployment rate for Black residents
- 10.6%Males
- 9.1%Females
- Unemployment rate for American Indian and Alaska Native residents
- 4.0%Males
- Unemployment rate for Asian residents
- 4.4%Males
- 1.5%Females
- Unemployment rate for other race residents
- 5.9%Males
- 7.3%Females
- Unemployment rate for two or more race residents
- 5.2%Males
- 1.0%Females
- Unemployment rate for Hispanic or Latino residents
- 2.9%Males
- 2.1%Females
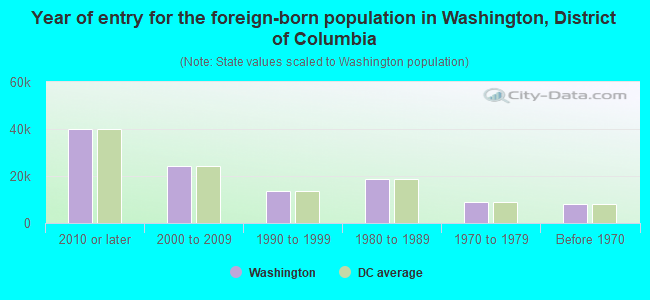
- Year of entry for the foreign-born population in Washington, District of Columbia
- 40,0772010 or later
- 24,1722000 to 2009
- 13,5081990 to 1999
- 18,7121980 to 1989
- 9,0711970 to 1979
- 8,245Before 1970
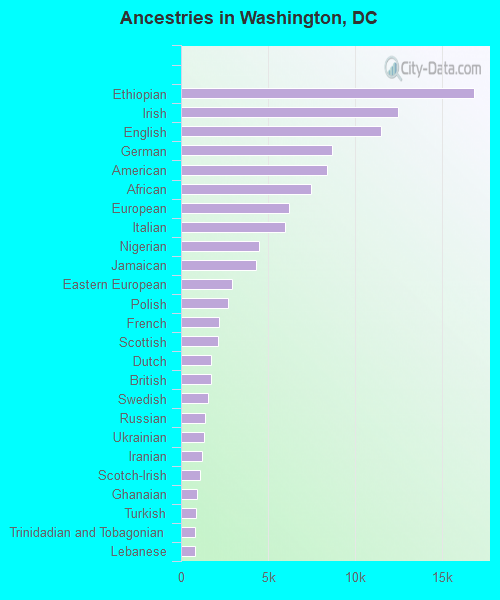
First ancestries reported:
- Ethiopian: 16,852 (4.5%)
- Irish: 12,495 (3.3%)
- English: 11,502 (3.1%)
- German: 8,665 (2.3%)
- American: 8,411 (2.2%)
- African: 7,487 (2.0%)
- European: 6,218 (1.7%)
- Italian: 5,981 (1.6%)
- Nigerian: 4,503 (1.2%)
- Jamaican: 4,337 (1.2%)
- Eastern European: 2,937 (0.8%)
- Polish: 2,703 (0.7%)
- French: 2,211 (0.6%)
- Scottish: 2,151 (0.6%)
- Dutch: 1,750 (0.5%)
- British: 1,707 (0.5%)
- Swedish: 1,543 (0.4%)
- Russian: 1,388 (0.4%)
- Ukrainian: 1,304 (0.3%)
- Iranian: 1,224 (0.3%)
- Scotch-Irish: 1,076 (0.3%)
- Ghanaian: 903 (0.2%)
- Turkish: 842 (0.2%)
- Trinidadian and Tobagonian: 830 (0.2%)
- Lebanese: 812 (0.2%)
- Haitian: 799 (0.2%)
- Hungarian: 714 (0.2%)
- Greek: 626 (0.2%)
- Norwegian: 615 (0.2%)
- Czech: 602 (0.2%)
- Scandinavian: 585 (0.2%)
- Arab: 574 (0.2%)
- West Indian: 553 (0.1%)
- Canadian: 535 (0.1%)
- Romanian: 506 (0.1%)
- Palestinian: 485 (0.1%)
- Lithuanian: 444 (0.1%)
- Kenyan: 441 (0.1%)
- Slovene: 401 (0.1%)
- Guyanese: 392 (0.1%)
- Slovak: 390 (0.1%)
- Brazilian: 384 (0.1%)
- Northern European: 383 (0.1%)
- Swiss: 376 (0.10%)
- British West Indian: 362 (0.10%)
- Egyptian: 347 (0.09%)
- Austrian: 317 (0.08%)
- French Canadian: 310 (0.08%)
- Portuguese: 277 (0.07%)
- South African: 266 (0.07%)
- Armenian: 260 (0.07%)
- Moroccan: 251 (0.07%)
- Danish: 221 (0.06%)
- Welsh: 213 (0.06%)
- Albanian: 206 (0.05%)
- Israeli: 201 (0.05%)
- Liberian: 195 (0.05%)
- Belizean: 162 (0.04%)
- Macedonian: 159 (0.04%)
- Serbian: 147 (0.04%)
- Afghan: 143 (0.04%)
- Croatian: 142 (0.04%)
- Ugandan: 133 (0.04%)
- Estonian: 130 (0.03%)
- Slavic: 127 (0.03%)
- Sierra Leonean: 122 (0.03%)
- Barbadian: 110 (0.03%)
- Australian: 109 (0.03%)
- Latvian: 93 (0.02%)
- Syrian: 88 (0.02%)
- Czechoslovakian: 83 (0.02%)
- Cypriot: 75 (0.02%)
- Finnish: 75 (0.02%)
- Bulgarian: 58 (0.02%)
- Pennsylvania German: 56 (0.01%)
- Cape Verdean: 48 (0.01%)
- Celtic: 35 (0.01%)
- Belgian: 21 (0.01%)
Most common places of birth for foreign-born residents (%):
| Washington: | 11.4% (10,441) |
| District of Columbia: | 11.6% (10,447) |
| Washington: | 7.5% (6,883) |
| District of Columbia: | 7.2% (6,470) |
| Washington: | 3.6% (3,345) |
| District of Columbia: | 3.7% (3,373) |
| Washington: | 3.6% (3,270) |
| District of Columbia: | 3.6% (3,264) |
| Washington: | 3.5% (3,209) |
| District of Columbia: | 3.4% (3,088) |
| Washington: | 3.4% (3,125) |
| District of Columbia: | 3.2% (2,899) |
| Washington: | 2.7% (2,526) |
| District of Columbia: | 2.7% (2,468) |
| Washington: | 2.7% (2,511) |
| District of Columbia: | 2.6% (2,332) |
| Washington: | 2.3% (2,121) |
| District of Columbia: | 2.3% (2,028) |
| Washington: | 2.3% (2,104) |
| District of Columbia: | 2.3% (2,083) |
| Washington: | 2.3% (2,075) |
| District of Columbia: | 2.3% (2,077) |
| Washington: | 2.2% (2,021) |
| District of Columbia: | 2.1% (1,852) |
| Washington: | 2.1% (1,954) |
| District of Columbia: | 1.9% (1,685) |
| Washington: | 1.8% (1,695) |
| District of Columbia: | 1.8% (1,632) |
| Washington: | 1.8% (1,674) |
| District of Columbia: | 2.0% (1,773) |
| Washington: | 1.7% (1,589) |
| District of Columbia: | 1.8% (1,612) |
| Washington: | 1.7% (1,522) |
| District of Columbia: | 1.7% (1,494) |
| Washington: | 1.6% (1,505) |
| District of Columbia: | 1.7% (1,508) |
| Washington: | 1.6% (1,499) |
| District of Columbia: | 1.3% (1,166) |
| Washington: | 1.6% (1,482) |
| District of Columbia: | 1.5% (1,324) |
| Washington: | 1.6% (1,482) |
| District of Columbia: | 1.7% (1,503) |
| Washington: | 1.6% (1,449) |
| District of Columbia: | 1.6% (1,465) |
| Washington: | 1.5% (1,408) |
| District of Columbia: | 1.5% (1,377) |
Place of birth for U.S.-born residents:
- This state: 227,795
- Other state: 330,290
- Northeast: 96,453
- Midwest: 55,044
- South: 139,433
- West: 39,360
78.0% of Washington residents lived in the same house 1 years ago.
Out of people who lived in different houses, 34.0% lived in this county.
Out of people who lived in different counties, 0.0% lived in District of Columbia.
| Washington: | 78.0% |
| State average: | 78.0% |
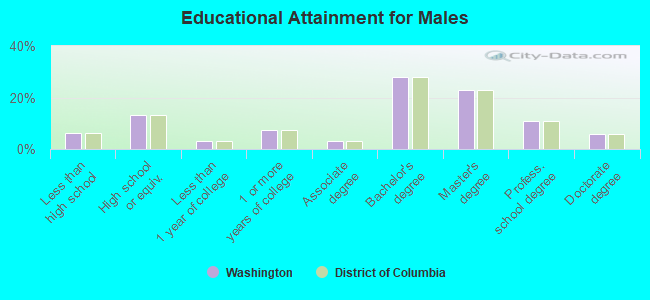
Education attainment for males 25 years and older:
- No schooling: 1,436
- Nursery to 4th grade: 1,205
- 5th and 6th grade: 988
- 7th and 8th grade: 931
- 9th grade: 1,443
- 10th grade: 2,208
- 11th grade: 3,209
- 12th grade, no diploma: 2,638
- High school graduate (or equivalency): 29,698
- Less than 1 year of college: 7,014
- Some college more than 1 year, no degree: 16,323
- Associate degree: 7,163
- Bachelor's degree: 63,048
- Master's degree: 51,822
- Professional school degree: 24,357
- Doctorate degree: 12,754
Education attainment for females 25 years and older:
- No schooling: 2,601
- Nursery to 4th grade: 413
- 5th and 6th grade: 1,281
- 7th and 8th grade: 1,348
- 9th grade: 3,442
- 10th grade: 1,658
- 11th grade: 2,613
- 12th grade, no diploma: 2,941
- High school graduate (or equivalency): 34,845
- Less than 1 year of college: 8,854
- Some college more than 1 year, no degree: 22,894
- Associate degree: 8,811
- Bachelor's degree: 63,630
- Master's degree: 63,269
- Professional school degree: 22,737
- Doctorate degree: 11,657

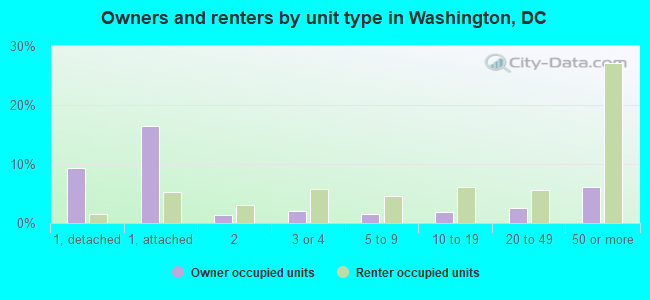
Housing units in structures:
- One, detached: 38,073
- One, attached: 77,994
- Two: 15,929
- 3 or 4: 27,583
- 5 to 9: 23,180
- 10 to 19: 28,402
- 20 to 49: 28,597
- 50 or more: 121,104
Housing units lacking complete kitchen facilities in 2022: 1.3%
House/condo owner moved in on average 9 years ago
Renter moved in on average 2 years ago
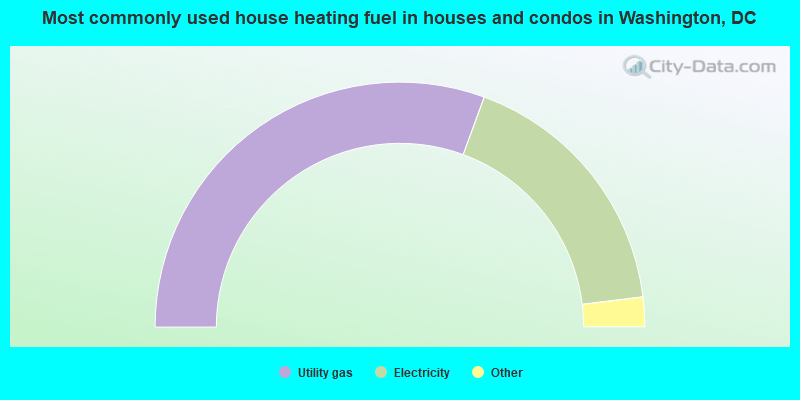
- 61.2%Utility gas
- 34.9%Electricity
- 1.2%Bottled, tank, or LP gas
- 0.8%No fuel used
- 0.7%Other fuel
- 0.7%Fuel oil, kerosene, etc.
- 0.5%Solar energy
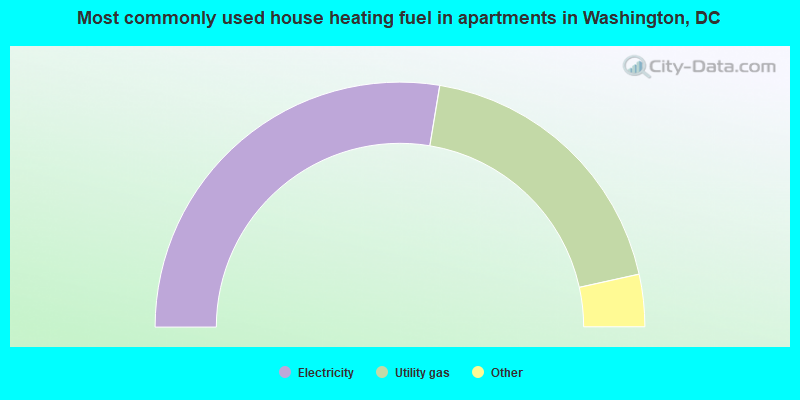
- 55.2%Electricity
- 37.9%Utility gas
- 3.6%No fuel used
- 1.4%Bottled, tank, or LP gas
- 0.8%Other fuel
- 0.8%Fuel oil, kerosene, etc.
- 0.2%Solar energy
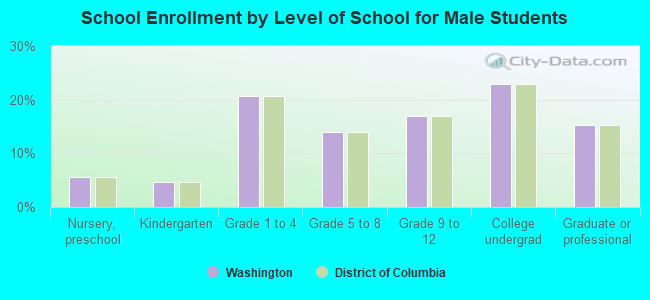
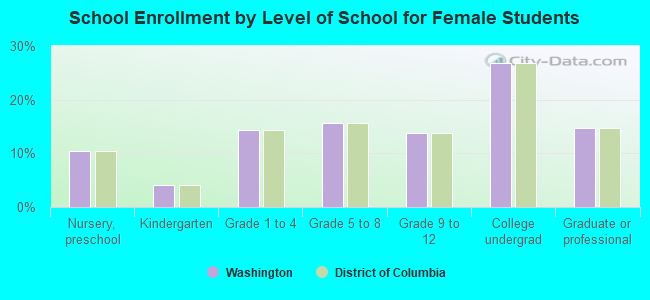
Private vs. public school enrollment:
| Here: | 22.5% |
| District of Columbia: | 22.5% |
| Here: | 21.7% |
| District of Columbia: | 21.7% |
| Here: | 75.9% |
| District of Columbia: | 75.9% |