Washington, UT (Utah) Houses and Residents
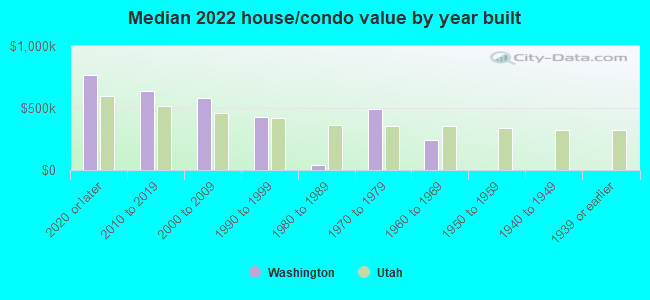
| Washington: | $561,821 |
| Utah: | $499,500 |
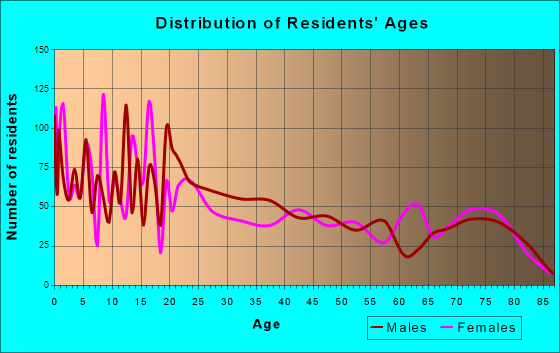
Total population: 23,360 (Urban population: 6,084, Rural population: 2,214 (all nonfarm))
Houses: 12,856 (10,616 occupied: 8,116 owner occupied, 2,793 renter occupied)
| % of renters here: | 26% |
| State: | 29% |
Housing density: 408 houses/condos per square mile
Median price asked for vacant for-sale houses and condos in 2022: $1,082,682.
Median contract rent in 2022: $1,412 (lower quartile is $1,079, upper quartile is $1,885)
Median rent asked for vacant for-rent units in 2022: $4,275
Median gross rent in Washington, UT in 2022: $1,544
Housing units in Washington with a mortgage: 5,267 (1,418 second mortgage, 116 home equity loan, 986 both second mortgage and home equity loan)
Houses without a mortgage: 0
Median household income for houses/condos with a mortgage: $120,784
Median household income for apartments without a mortgage: $66,241
Median monthly housing costs: $1,397
Compare current foreclosures near Washington, UT:
| Photo | Address | Area | Beds / Baths | Price | Details |
|---|---|---|---|---|---|

|
#1
E Fourteen Fairway Dr
Washington, UT 84780
|
1,284 sq. feet
|
2 baths 2 beds |
show details | |

|
#2
Bluff View Dr Unit 96
Washington, UT 84780
|
1,868 sq. feet
|
3 baths 3 beds |
show details | |

|
#3
E Telegraph St Lot 64
Washington, UT 84780
|
408 sq. feet
|
1 baths 1 beds |
show details | |

|
#4
N 1100 E Unit 189
Washington, UT 84780
|
1,035 sq. feet
|
2 baths 2 beds |
show details | |

|
#5
W Washington Palms Way
Washington, UT 84780
|
1,733 sq. feet
|
2 baths 3 beds |
show details | |

|
#6
Quail Ridge Dr
Washington, UT 84780
|
1,354 sq. feet
|
2 baths 3 beds |
show details | |

|
#7
W Blue Mountain Rd
Washington, UT 84780
|
4,177 sq. feet
|
3 baths 4 beds |
show details | |

|
#8
Alamosa Dr
Washington, UT 84780
|
1,749 sq. feet
|
3 baths 5 beds |
show details | |

|
#9
E Bulloch St, Unit 3
Washington, UT 84780
|
- sq. feet
|
- baths - beds |
show details | |

|
#10
W 200 S, Unit 111
Washington, UT 84780
|
- sq. feet
|
- baths - beds |
show details |
| Photo | Address | Area | Beds / Baths | Price | Details |
|---|---|---|---|---|---|

|
#11
N Sand Sage Ave
Washington, UT 84780
|
- sq. feet
|
- baths - beds |
show details | |

|
#12
N Viatranquila
Washington, UT 84780
|
- sq. feet
|
- baths - beds |
show details | |

|
#13
N Creek Ridge Dr
Washington, UT 84780
|
- sq. feet
|
- baths - beds |
show details | |

|
#14
W 200 S, Unit 123
Washington, UT 84780
|
- sq. feet
|
- baths - beds |
show details | |

|
#15
S Goose Creek Dr
Washington, UT 84780
|
- sq. feet
|
- baths - beds |
show details | |

|
#16
N Red Stone Rd, Apt E304
Washington, UT 84780
|
- sq. feet
|
- baths - beds |
show details | |

|
#17
E Cheyenne Way
Washington, UT 84780
|
- sq. feet
|
- baths - beds |
show details | |

|
#18
Buena Vista Blvd Unit 120
Washington, UT 84780
|
- sq. feet
|
- baths - beds |
show details | |

|
#19
West 2530 South
Washington, UT 84780
|
- sq. feet
|
- baths - beds |
show details | |

|
#20
E Bulloch St, Unit 23
Washington, UT 84780
|
- sq. feet
|
- baths - beds |
show details |
| Photo | Address | Area | Beds / Baths | Price | Details |
|---|---|---|---|---|---|

|
#21
S Orange Grove Dr
Washington, UT 84780
|
- sq. feet
|
- baths - beds |
show details | |

|
#22
S Ripple Rock Dr
Washington, UT 84780
|
- sq. feet
|
- baths - beds |
show details | |

|
#23
1060 E
Saint George, UT 84770
|
1,128 sq. feet
|
2 baths 3 beds |
show details | |

|
#24
W 2440 S
Hurricane, UT 84737
|
2,513 sq. feet
|
3 baths 5 beds |
show details | |

|
#25
N 1950 W
Saint George, UT 84770
|
1,808 sq. feet
|
2 baths 3 beds |
show details | |

|
#26
W 650 North Cir
Saint George, UT 84770
|
1,230 sq. feet
|
2 baths 3 beds |
show details | |

|
#27
W 975 N
Saint George, UT 84770
|
1,396 sq. feet
|
2 baths 4 beds |
show details | |

|
#28
W 1200 N
Saint George, UT 84770
|
1,275 sq. feet
|
2 baths 3 beds |
show details | |

|
#29
N Cascade Canyon Dr
Saint George, UT 84770
|
3,596 sq. feet
|
3 baths 3 beds |
show details | |

|
#30
N 1280 W
Saint George, UT 84770
|
1,713 sq. feet
|
2 baths 3 beds |
show details |
| Photo | Address | Area | Beds / Baths | Price | Details |
|---|---|---|---|---|---|

|
#31
N Great Basin Dr
Saint George, UT 84770
|
1,966 sq. feet
|
2 baths 3 beds |
show details | |

|
#32
W 750 N
Saint George, UT 84770
|
1,561 sq. feet
|
2 baths 4 beds |
show details | |

|
#33
W 580 N
Saint George, UT 84770
|
1,824 sq. feet
|
2 baths 3 beds |
show details | |

|
#34
N 1300 W
Saint George, UT 84770
|
1,756 sq. feet
|
2 baths 3 beds |
show details | |

|
#35
Balboa Way
Saint George, UT 84770
|
2,388 sq. feet
|
3 baths 4 beds |
show details | |

|
#36
S Hidden Valley Dr Unit 203
Saint George, UT 84790
|
1,430 sq. feet
|
2 baths 3 beds |
show details | |

|
#37
S Hidden Valley Dr Unit 174
Saint George, UT 84790
|
1,430 sq. feet
|
2 baths 3 beds |
show details | |

|
#38
Escalante Dr
Saint George, UT 84790
|
1,794 sq. feet
|
2 baths 3 beds |
show details | |

|
#39
Escalante Dr
Saint George, UT 84790
|
3,592 sq. feet
|
3 baths 6 beds |
show details | |

|
#40
E 710 S
Ivins, UT 84738
|
1,415 sq. feet
|
2 baths 3 beds |
show details |
| Photo | Address | Area | Beds / Baths | Price | Details |
|---|---|---|---|---|---|

|
#41
N 2200 W
Saint George, UT 84770
|
1,568 sq. feet
|
2 baths 3 beds |
show details | |

|
#42
S 320 E
Ivins, UT 84738
|
1,108 sq. feet
|
2 baths 3 beds |
show details | |

|
#43
W 500 N
La Verkin, UT 84745
|
4,185 sq. feet
|
5 baths 5 beds |
show details | |

|
#44
W 200 N
La Verkin, UT 84745
|
1,266 sq. feet
|
2 baths 3 beds |
show details | |

|
#45
N 560 W
La Verkin, UT 84745
|
1,735 sq. feet
|
2 baths 4 beds |
show details | |

|
#46
N 120 E
Hurricane, UT 84737
|
1,542 sq. feet
|
2 baths 3 beds |
show details | |

|
#47
E 100 N
Ivins, UT 84738
|
1,137 sq. feet
|
2 baths 3 beds |
show details | |

|
#48
W 175 N
Hurricane, UT 84737
|
1,357 sq. feet
|
2 baths 3 beds |
show details | |

|
#49
Ridge Rim Way
Saint George, UT 84770
|
1,200 sq. feet
|
2 baths 3 beds |
show details | |

|
Check over 1 million property listings on Foreclosure.com!
|
browse all offers | |||

Latest news about housing in Washington, UT collected exclusively by city-data.com from local newspapers, TV, and radio stations

 | Bought a home in St George.. (19 replies) |
| Is St. George getting really bad? (52 replies) |
| cost of apartments in STG (1 reply) |
| Small home living (6 replies) |
| Neighborhoods/real estate to see when we come, New construction (3 replies) |
| Ivins City Municipal Elections....The Growth Issue (1 reply) |
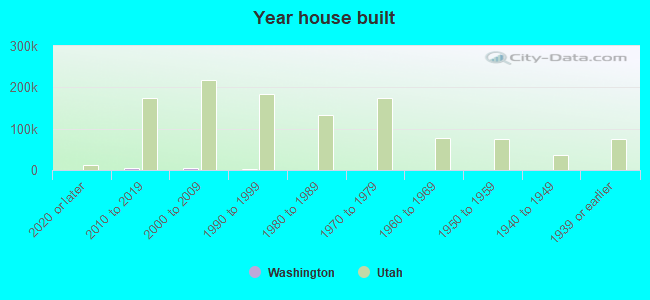
Median year apartment built: 2002
Household type by relationship:
Households: 31,449- Male householders: 5,309 (570 living alone), Female householders: 5,190 (1,373 living alone)
7,443 spouses (7,425 opposite-sex spouses), 260 unmarried partners, (260 opposite-sex unmarried partners), 10,487 children (9,984 natural, 87 adopted, 415 stepchildren), 512 grandchildren, 666 brothers or sisters, 709 parents, 0 foster children, 170 other relatives, 663 non-relatives
- In group quarters: 35
Size of family households: 3,279 2-persons, 2,085 3-persons, 1,420 4-persons, 998 5-persons, 581 6-persons, 286 7-or-more-persons.
Size of nonfamily households: 1,972 1-person, 285 2-persons, 95 3-persons, 11 4-persons, 11 5-persons.
7,045 married couples with children.
611 single-parent households (436 men, 175 women).
89.7% of residents of Washington speak English at home.
8.0% of residents speak Spanish at home (72% speak English very well, 21% speak English well, 7% speak English not well).
1.1% of residents speak other Indo-European language at home (65% speak English very well, 35% speak English well).
1.4% of residents speak Asian or Pacific Island language at home (76% speak English very well, 24% speak English well).
Foreign born population: 1,791 (5.7%)
(33.1% of them are naturalized citizens)
| Here: | 6.3 |
| State: | 7.6 |
| Here: | 4.8 |
| State: | 4.3 |
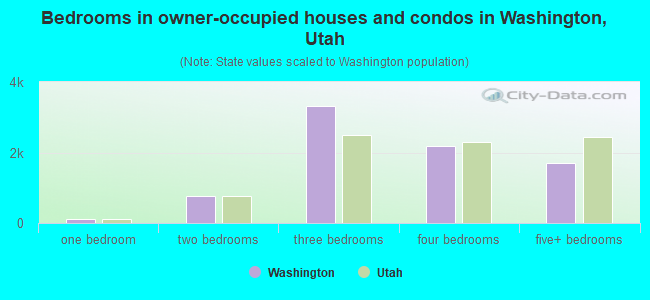
- Bedrooms in owner-occupied houses and condos in Washington, Utah
- 11no bedroom
- 1141 bedroom
- 7682 bedrooms
- 3,3163 bedrooms
- 2,1944 bedrooms
- 1,7135+ bedrooms
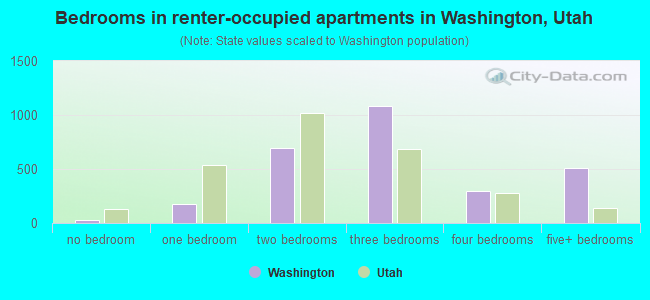
- Bedrooms in renter-occupied apartments in Washington, Utah
- 28no bedroom
- 1741 bedroom
- 6992 bedrooms
- 1,0813 bedrooms
- 2984 bedrooms
- 5135+ bedrooms
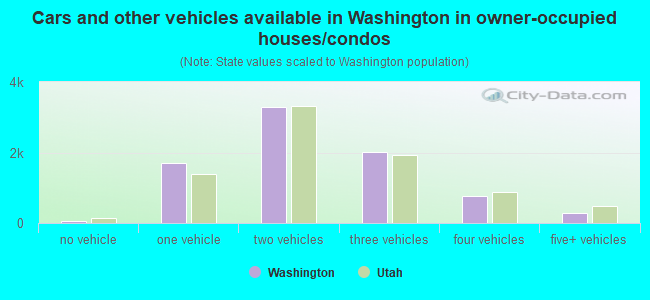
- Cars and other vehicles available in Washington in owner-occupied houses/condos
- 65no vehicle
- 1,7021 vehicle
- 3,2842 vehicles
- 2,0073 vehicles
- 7794 vehicles
- 2805+ vehicles
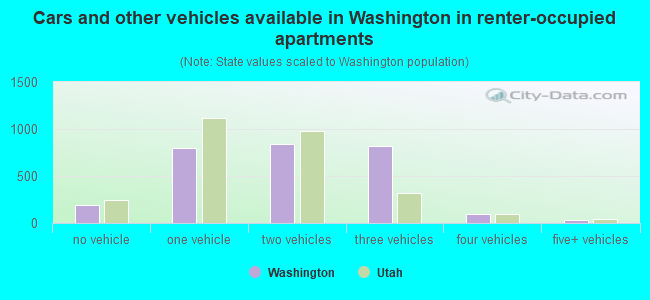
- Cars and other vehicles available in Washington in renter-occupied apartments
- 196no vehicle
- 7981 vehicle
- 8392 vehicles
- 8233 vehicles
- 1014 vehicles
- 375+ vehicles
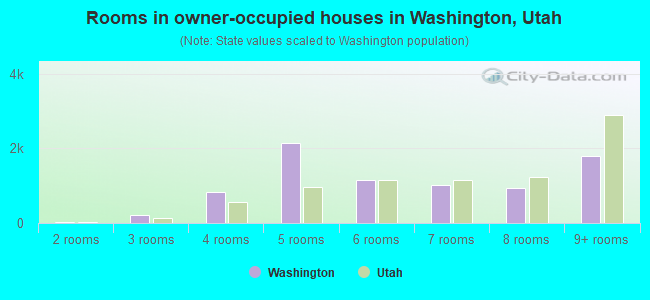
- Rooms in owner-occupied houses in Washington, Utah
- 111 room
- 182 rooms
- 2223 rooms
- 8234 rooms
- 2,1435 rooms
- 1,1426 rooms
- 1,0277 rooms
- 9378 rooms
- 1,7959+ rooms
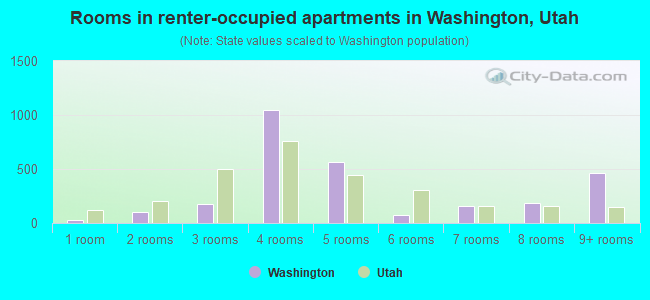
- Rooms in renter-occupied apartments in Washington, Utah
- 281 room
- 1012 rooms
- 1763 rooms
- 1,0434 rooms
- 5645 rooms
- 736 rooms
- 1597 rooms
- 1858 rooms
- 4659+ rooms
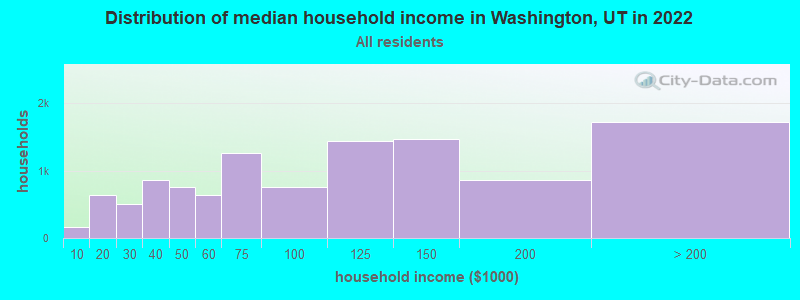
Washington, UT household income distribution

- 159Less than $10,000
- 632$10,000 to $19,999
- 504$20,000 to $29,999
- 859$30,000 to $39,999
- 762$40,000 to $49,999
- 643$50,000 to $59,999
- 1,259$60,000 to $74,999
- 759$75,000 to $99,999
- 1,445$100,000 to $124,999
- 1,464$125,000 to $149,999
- 865$150,000 to $199,999
- 1,723$200,000 or more
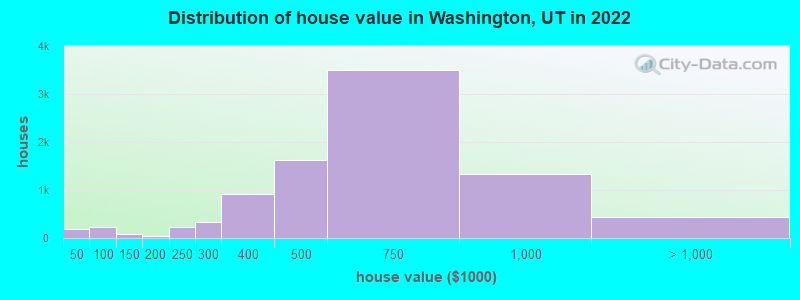
Home value of owner - occupied houses in 2022 in Washington, UT
-
- 17Less than $10,000
- 24$30,000 to $34,999
- 140$35,000 to $39,999
- 5$40,000 to $49,999
- 157$50,000 to $59,999
- 16$60,000 to $69,999
- 30$80,000 to $89,999
- 19$90,000 to $99,999
- 74$100,000 to $124,999
- 10$125,000 to $149,999
- 50$150,000 to $174,999
- 220$200,000 to $249,999
- 334$250,000 to $299,999
- 919$300,000 to $399,999
- 1,617$400,000 to $499,999
- 3,492$500,000 to $749,999
- 1,324$750,000 to $999,999
- 271$1,000,000 to $1,499,999
- 120$1,500,000 to $1,999,999
- 50$2,000,000 or more
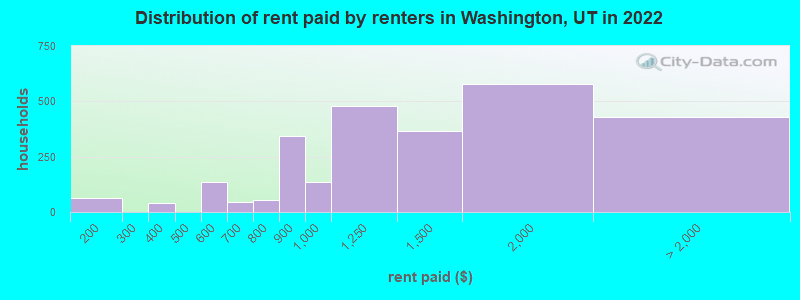
Rent paid by renters in 2022 in Washington, UT
-
- 62$100 to $149
- 39$300 to $349
- 56$500 to $549
- 78$550 to $599
- 27$600 to $649
- 17$650 to $699
- 38$700 to $749
- 13$750 to $799
- 344$800 to $899
- 134$900 to $999
- 481$1,000 to $1,249
- 367$1,250 to $1,499
- 579$1,500 to $1,999
- 316$2,000 to $2,499
- 28$2,500 to $2,999
- 82No cash rent
Percentage of workers working in this county: 95.8%
Number of people working at home: 1,688 (11.2% of all workers)
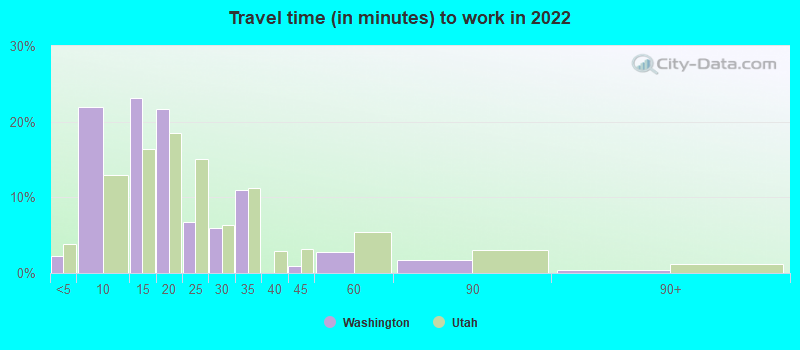
Travel time to work (commute)
- Less than 5 minutes: 445
- 5 to 9 minutes: 2,182
- 10 to 14 minutes: 3,588
- 15 to 19 minutes: 3,104
- 20 to 24 minutes: 1,810
- 25 to 29 minutes: 502
- 30 to 34 minutes: 781
- 35 to 39 minutes: 0
- 40 to 44 minutes: 64
- 45 to 59 minutes: 238
- 60 to 89 minutes: 195
- 90 or more minutes: 60
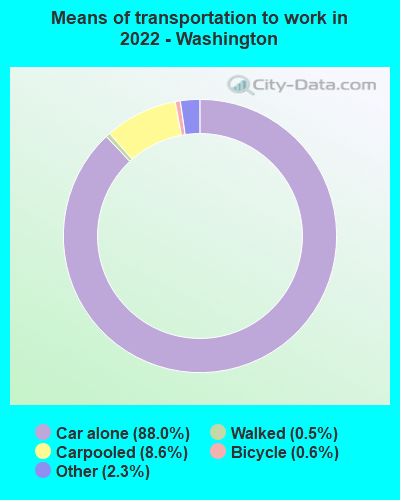
Means of transportation to work:
- Drove a car alone: 5,226 (68.3%)
- Carpooled: 548 (7.2%)
- Taxi: 115 (1.5%)
- Bicycle: 47 (0.6%)
- Walked: 35 (0.5%)
- Worked at home: 1,688 (22.1%)
- Unemployment by race in 2022
- Unemployment rate for White non-Hispanic residents
- 0.6%Males
- 0.9%Females
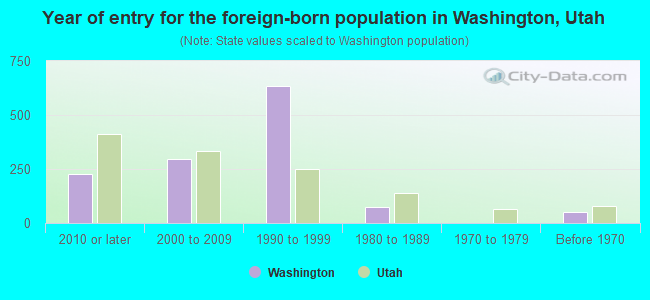
- Year of entry for the foreign-born population in Washington, Utah
- 2292010 or later
- 2952000 to 2009
- 6341990 to 1999
- 741980 to 1989
- 01970 to 1979
- 49Before 1970
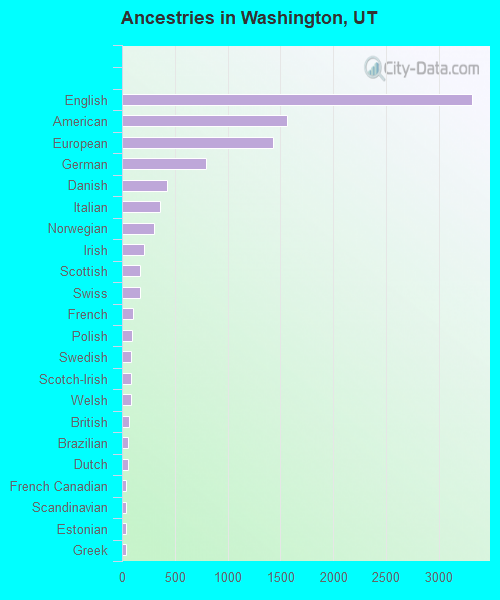
First ancestries reported:
- English: 3,312 (23.6%)
- American: 1,564 (11.2%)
- European: 1,429 (10.2%)
- German: 795 (5.7%)
- Danish: 430 (3.1%)
- Italian: 359 (2.6%)
- Norwegian: 307 (2.2%)
- Irish: 209 (1.5%)
- Scottish: 175 (1.2%)
- Swiss: 175 (1.2%)
- French: 103 (0.7%)
- Polish: 93 (0.7%)
- Swedish: 90 (0.6%)
- Scotch-Irish: 88 (0.6%)
- Welsh: 88 (0.6%)
- British: 67 (0.5%)
- Brazilian: 56 (0.4%)
- Dutch: 56 (0.4%)
- French Canadian: 37 (0.3%)
- Scandinavian: 37 (0.3%)
- Estonian: 35 (0.2%)
- Greek: 34 (0.2%)
- Canadian: 26 (0.2%)
- Austrian: 21 (0.1%)
- Slovene: 11 (0.08%)
Most common places of birth for foreign-born residents (%):
| Washington: | 43.4% (672) |
| Utah: | 36.1% (99,740) |
| Washington: | 8.5% (131) |
| Utah: | 2.0% (5,555) |
| Washington: | 8.3% (129) |
| Utah: | 2.9% (8,017) |
| Washington: | 6.8% (105) |
| Utah: | 2.8% (7,644) |
| Washington: | 6.5% (101) |
| Utah: | 2.1% (5,902) |
| Washington: | 5.3% (82) |
| Utah: | 2.3% (6,468) |
| Washington: | 5.1% (79) |
| Utah: | 3.0% (8,341) |
| Washington: | 3.4% (52) |
| Utah: | 2.7% (7,472) |
| Washington: | 2.3% (35) |
| Utah: | 0.2% (570) |
| Washington: | 2.0% (31) |
| Utah: | 3.2% (8,804) |
| Washington: | 1.8% (28) |
| Utah: | 0.7% (2,014) |
Place of birth for U.S.-born residents:
- This state: 17,339
- Other state: 12,071
- Northeast: 1,387
- Midwest: 1,409
- South: 1,485
- West: 7,791
86.8% of Washington residents lived in the same house 1 years ago.
Out of people who lived in different houses, 37.1% lived in this county.
Out of people who lived in different counties, 65.6% lived in Utah.
| Washington: | 86.8% |
| State average: | 85.7% |
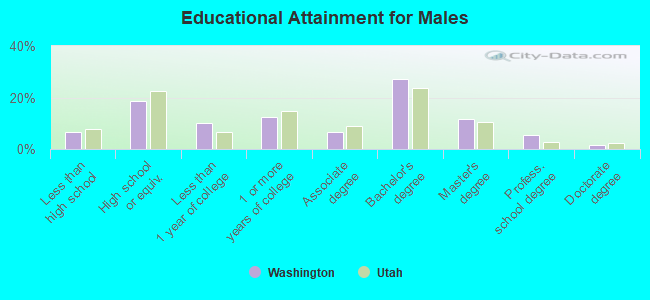
Education attainment for males 25 years and older:
- No schooling: 122
- Nursery to 4th grade: 0
- 5th and 6th grade: 27
- 7th and 8th grade: 6
- 9th grade: 79
- 10th grade: 29
- 11th grade: 80
- 12th grade, no diploma: 300
- High school graduate (or equivalency): 1,854
- Less than 1 year of college: 989
- Some college more than 1 year, no degree: 1,236
- Associate degree: 646
- Bachelor's degree: 2,693
- Master's degree: 1,175
- Professional school degree: 558
- Doctorate degree: 168
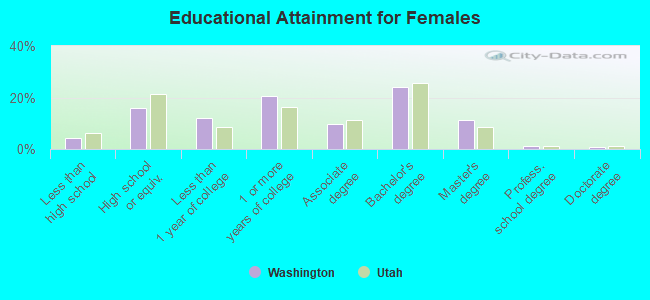
Education attainment for females 25 years and older:
- No schooling: 218
- Nursery to 4th grade: 0
- 5th and 6th grade: 9
- 7th and 8th grade: 8
- 9th grade: 25
- 10th grade: 23
- 11th grade: 70
- 12th grade, no diploma: 127
- High school graduate (or equivalency): 1,735
- Less than 1 year of college: 1,289
- Some college more than 1 year, no degree: 2,248
- Associate degree: 1,068
- Bachelor's degree: 2,590
- Master's degree: 1,237
- Professional school degree: 118
- Doctorate degree: 75
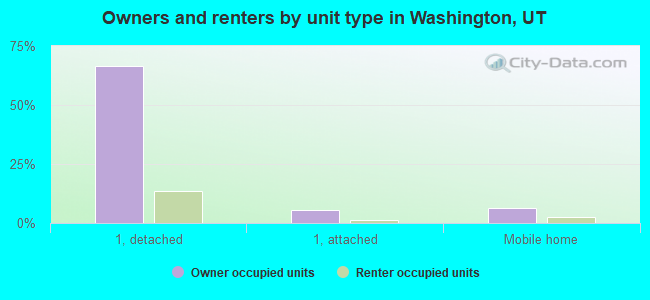
Housing units in structures:
- One, detached: 9,709
- One, attached: 851
- Two: 210
- 3 or 4: 468
- 5 to 9: 213
- 10 to 19: 254
- 20 to 49: 142
- 50 or more: 26
- Mobile homes: 979
Median worth of mobile homes: $72,465
Housing units lacking complete kitchen facilities in 2022: 1.9%
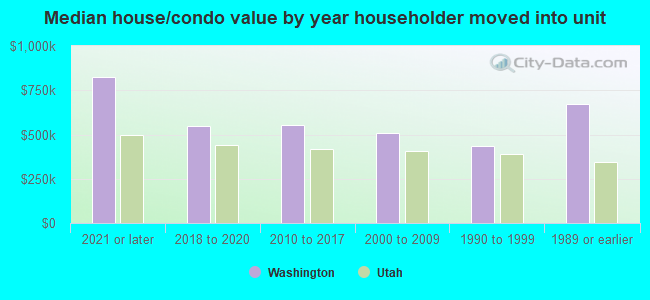
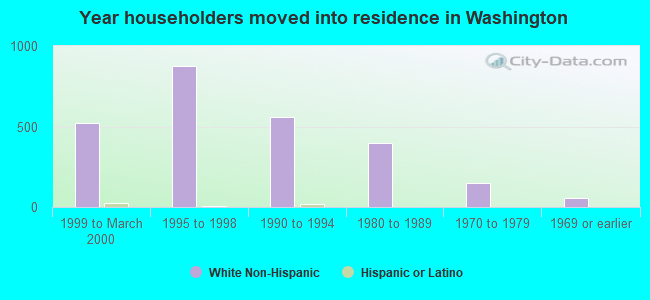
House/condo owner moved in on average 6 years ago
Renter moved in on average 4 years ago
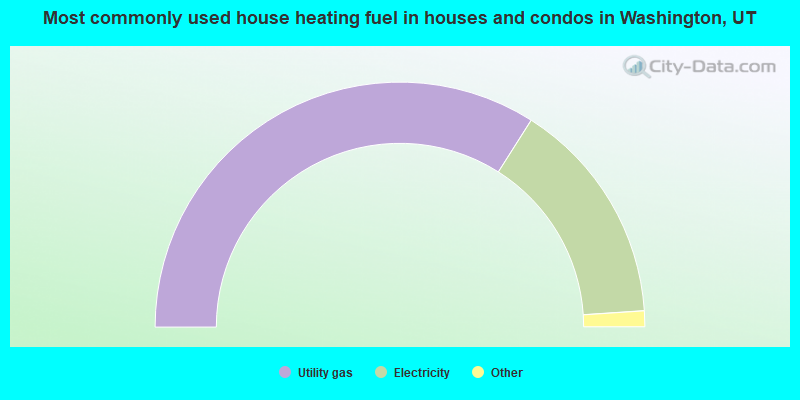
- 68.0%Utility gas
- 29.9%Electricity
- 0.9%Bottled, tank, or LP gas
- 0.5%Solar energy
- 0.5%No fuel used
- 0.1%Wood
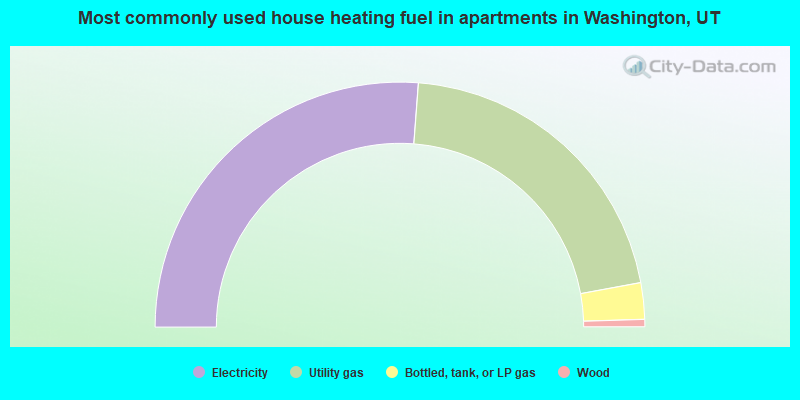
- 52.4%Electricity
- 41.8%Utility gas
- 4.8%Bottled, tank, or LP gas
- 1.0%Wood
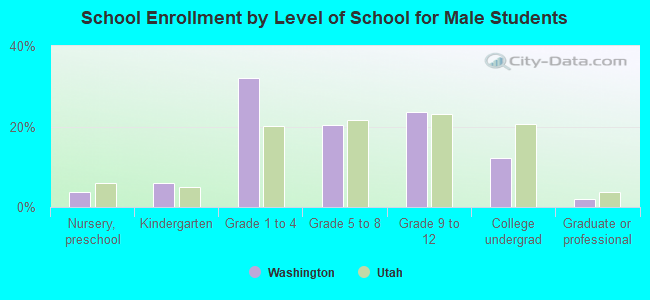
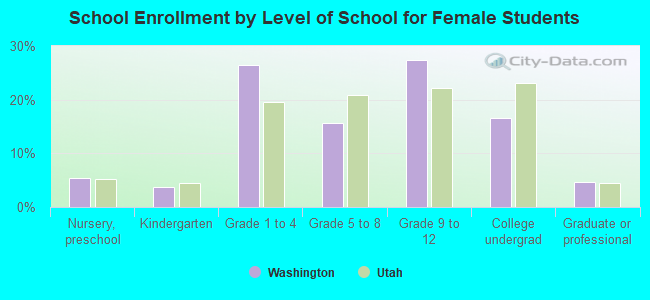
Private vs. public school enrollment:
| Here: | 7.5% |
| Utah: | 7.2% |
| Here: | 8.6% |
| Utah: | 5.3% |
| Here: | 12.1% |
| Utah: | 26.7% |