Watauga, TX (Texas) Houses and Residents
| Watauga: | $242,782 |
| Texas: | $275,400 |
Mean price in 2022:
Detached houses: $200,566
Here: $200,566 State: $369,058 Townhouses or other attached units: $227,397
Here: $227,397 State: $327,631 Mobile homes: $105,143
Here: $105,143 State: $124,413
Total population: 24,345 (Urban population: 21,848, Rural population: 0)
Houses: 8,400 (8,131 occupied: 6,293 owner occupied, 1,864 renter occupied)
| % of renters here: | 23% |
| State: | 38% |
Housing density: 2,016 houses/condos per square mile
Median price asked for vacant for-sale houses and condos in 2022: $787,063.
Median contract rent in 2022: $1,591 (lower quartile is $1,248, upper quartile is $1,877)
Median rent asked for vacant for-rent units in 2022: $2,519
Median gross rent in Watauga, TX in 2022: $1,791
Housing units in Watauga with a mortgage: 3,999 (145 second mortgage, 0 home equity loan, 85 both second mortgage and home equity loan)
Houses without a mortgage: 80
Median household income for houses/condos with a mortgage: $102,577
Median household income for apartments without a mortgage: $68,681
Median monthly housing costs: $1,475
Compare current foreclosures near Watauga, TX:
| Photo | Address | Area | Beds / Baths | Price | Details |
|---|---|---|---|---|---|

|
#1
Roberts Cir
Arlington, TX 76010
|
3,030 sq. feet
|
4 baths 8 beds |
show details | |

|
#2
Mims St
Fort Worth, TX 76112
|
1,674 sq. feet
|
2 baths 3 beds |
show details | |

|
#3
Mistletoe Dr
Argyle, TX 76226
|
3,796 sq. feet
|
4 baths 4 beds |
show details | |

|
#4
13th St
Argyle, TX 76226
|
3,817 sq. feet
|
4 baths 5 beds |
show details | |

|
#5
Roky Ct
Fort Worth, TX 76114
|
2,322 sq. feet
|
4 baths 4 beds |
show details | |

|
#6
Fernwood Dr
Arlington, TX 76001
|
1,293 sq. feet
|
2 baths 3 beds |
show details | |

|
#7
Carrier Pl
Grand Prairie, TX 75050
|
2,099 sq. feet
|
2 baths 3 beds |
show details | |

|
#8
W 7th St Apt 2512
Fort Worth, TX 76107
|
1,263 sq. feet
|
2 baths 1 beds |
show details | |

|
#9
Cooper Creek Street
Fort Worth, TX 76179
|
3,335 sq. feet
|
3 baths 5 beds |
show details | |

|
#10
Oak Haven Dr
Fort Worth, TX 76119
|
2,029 sq. feet
|
1 baths 2 beds |
show details |
| Photo | Address | Area | Beds / Baths | Price | Details |
|---|---|---|---|---|---|

|
#11
Gill St
Fort Worth, TX 76131
|
1,120 sq. feet
|
1 baths 3 beds |
show details | |

|
#12
Westcliff Rd S
Fort Worth, TX 76109
|
2,259 sq. feet
|
2 baths 3 beds |
show details | |

|
#13
Bowles Ct
Kennedale, TX 76060
|
1,075 sq. feet
|
2 baths 3 beds |
show details | |

|
#14
Solano Ct
Arlington, TX 76017
|
1,594 sq. feet
|
2 baths 3 beds |
show details | |

|
#15
Big Horn Way
Fort Worth, TX 76137
|
3,237 sq. feet
|
3 baths 5 beds |
show details | |

|
#16
Overbrook Dr
Arlington, TX 76014
|
1,527 sq. feet
|
2 baths 3 beds |
show details | |

|
#17
Bursey Rd
North Richland Hills, TX 76182
|
2,696 sq. feet
|
3 baths 4 beds |
show details | |

|
#18
Maceo Ln
Fort Worth, TX 76112
|
1,892 sq. feet
|
1 baths 3 beds |
show details | |

|
#19
Fair Field Dr
Grapevine, TX 76051
|
2,779 sq. feet
|
2 baths 3 beds |
show details | |

|
#20
Darlington Trl
Fort Worth, TX 76131
|
3,152 sq. feet
|
3 baths 4 beds |
show details |
| Photo | Address | Area | Beds / Baths | Price | Details |
|---|---|---|---|---|---|

|
#21
Meadowlark Dr
Rhome, TX 76078
|
1,782 sq. feet
|
2 baths 4 beds |
show details | |

|
#22
Gillespie Drive
Justin, TX 76247
|
- sq. feet
|
2 baths 3 beds |
show details | |

|
#23
Willow Park St
Fort Worth, TX 76118
|
1,177 sq. feet
|
2 baths 3 beds |
show details | |

|
#24
Whittlesey Rd
Fort Worth, TX 76119
|
1,744 sq. feet
|
1 baths 3 beds |
show details | |

|
#25
Whittlesey Rd
Fort Worth, TX 76119
|
1,744 sq. feet
|
1 baths 3 beds |
show details | |

|
#26
Rebel Rd
Fort Worth, TX 76140
|
1,532 sq. feet
|
2 baths 3 beds |
show details | |

|
#27
Chestnut Ln
Fort Worth, TX 76179
|
- sq. feet
|
3 baths 4 beds |
show details | |

|
#28
Van Natta Ln
Fort Worth, TX 76112
|
1,772 sq. feet
|
1 baths 3 beds |
show details | |

|
#29
Arbor Lake Rd
Rhome, TX 76078
|
- sq. feet
|
2 baths 4 beds |
show details | |

|
#30
Chambers Creek Dr
Fort Worth, TX 76140
|
1,833 sq. feet
|
2 baths 3 beds |
show details |
| Photo | Address | Area | Beds / Baths | Price | Details |
|---|---|---|---|---|---|

|
#31
Leather Strap Dr
Haslet, TX 76052
|
3,021 sq. feet
|
2 baths 4 beds |
show details | |

|
#32
Bridle Ave
Fort Worth, TX 76108
|
1,372 sq. feet
|
1 baths 3 beds |
show details | |

|
#33
Haverly Court
Keller, TX 76244
|
3,279 sq. feet
|
3 baths 4 beds |
show details | |

|
#34
Trail Edge Dr
Grapevine, TX 76051
|
1,600 sq. feet
|
2 baths 3 beds |
show details | |

|
#35
Elinor St
Fort Worth, TX 76111
|
672 sq. feet
|
1 baths 3 beds |
show details | |

|
#36
Frances Ann Ct
Haslet, TX 76052
|
2,632 sq. feet
|
2 baths 3 beds |
show details | |

|
#37
Glengate Ct
Arlington, TX 76016
|
1,052 sq. feet
|
2 baths 3 beds |
show details | |

|
#38
Beach Dr
Azle, TX 76020
|
1,843 sq. feet
|
2 baths 4 beds |
show details | |

|
#39
Norris Valley Dr
Fort Worth, TX 76135
|
1,032 sq. feet
|
2 baths 3 beds |
show details | |

|
#40
Montclair Dr
Fort Worth, TX 76103
|
1,428 sq. feet
|
3 baths 4 beds |
show details |
| Photo | Address | Area | Beds / Baths | Price | Details |
|---|---|---|---|---|---|

|
#41
Mims St
Fort Worth, TX 76112
|
1,674 sq. feet
|
2 baths 3 beds |
show details | |

|
#42
Fort Hunt Dr
Arlington, TX 76016
|
1,523 sq. feet
|
2 baths 3 beds |
show details | |

|
#43
Harney Dr
Keller, TX 76244
|
2,027 sq. feet
|
2 baths 4 beds |
show details | |

|
#44
Maria Dr
Fort Worth, TX 76108
|
1,572 sq. feet
|
2 baths 4 beds |
show details | |

|
#45
Regina Ct
Colleyville, TX 76034
|
3,703 sq. feet
|
4 baths 5 beds |
show details | |

|
#46
Mcconnell Dr
Fort Worth, TX 76134
|
1,029 sq. feet
|
1 baths 3 beds |
show details | |

|
#47
Holt St
Fort Worth, TX 76103
|
2,455 sq. feet
|
2 baths 4 beds |
show details | |

|
#48
Middleglen Ct
Haslet, TX 76052
|
3,376 sq. feet
|
2 baths 3 beds |
show details | |

|
#49
Lake Country Dr
Fort Worth, TX 76179
|
4,820 sq. feet
|
3 baths 4 beds |
show details | |

|
Check over 1 million property listings on Foreclosure.com!
|
browse all offers | |||

Latest news about housing in Watauga, TX collected exclusively by city-data.com from local newspapers, TV, and radio stations

 | Homebuilders in TX - the best & the worst. (34 replies) |
| Recent Relocation, Looking for Safe Neighborhoods with Small Houses (10 replies) |
| Are there any cities without highways? (48 replies) |
| Who’s waiting to jump in the real estate market? (28 replies) |
| Expensive housing pushing back family plans (11 replies) |
| Is it possible to find rental housing that meets this criteria? (8 replies) |
Median year apartment built: 1986
Household type by relationship:
Households: 23,962- Male householders: 3,989 (535 living alone), Female householders: 3,986 (650 living alone)
4,776 spouses (4,738 opposite-sex spouses), 670 unmarried partners, (646 opposite-sex unmarried partners), 7,407 children (6,797 natural, 116 adopted, 493 stepchildren), 620 grandchildren, 474 brothers or sisters, 314 parents, 0 foster children, 718 other relatives, 902 non-relatives
- In group quarters: 100
Size of family households: 2,467 2-persons, 1,416 3-persons, 1,099 4-persons, 680 5-persons, 187 6-persons, 238 7-or-more-persons.
Size of nonfamily households: 1,283 1-person, 612 2-persons, 56 3-persons, 44 4-persons.
3,794 married couples with children.
1,025 single-parent households (476 men, 549 women).
80.3% of residents of Watauga speak English at home.
15.3% of residents speak Spanish at home (61% speak English very well, 25% speak English well, 12% speak English not well, 1% don't speak English at all).
0.4% of residents speak other Indo-European language at home (87% speak English very well, 13% speak English not well).
3.2% of residents speak Asian or Pacific Island language at home (72% speak English very well, 13% speak English well, 9% speak English not well, 6% don't speak English at all).
0.2% of residents speak other language at home (69% speak English very well, 31% speak English well).
Foreign born population: 2,403 (10.0%)
(54.7% of them are naturalized citizens)
| Here: | 5.7 |
| State: | 6.3 |
| Here: | 5.2 |
| State: | 4.0 |
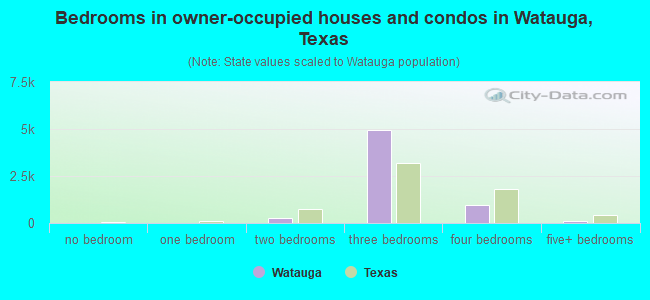
- Bedrooms in owner-occupied houses and condos in Watauga, Texas
- 23no bedroom
- 01 bedroom
- 2692 bedrooms
- 4,9693 bedrooms
- 9374 bedrooms
- 965+ bedrooms
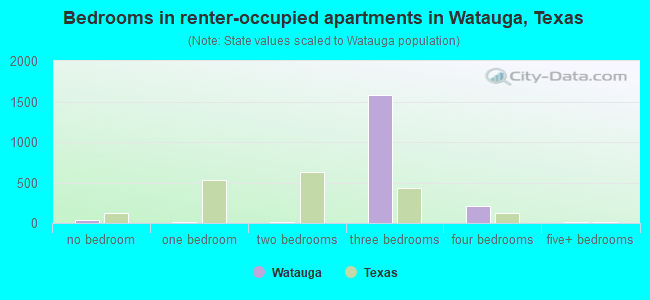
- Bedrooms in renter-occupied apartments in Watauga, Texas
- 33no bedroom
- 141 bedroom
- 132 bedrooms
- 1,5763 bedrooms
- 2144 bedrooms
- 155+ bedrooms
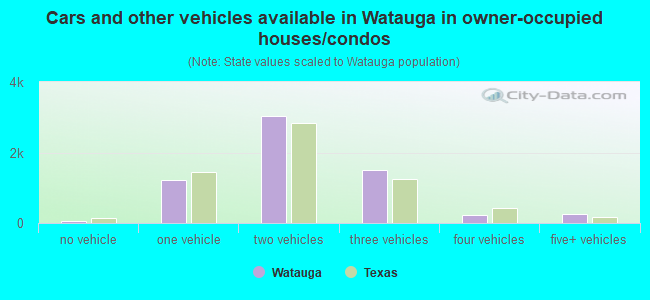
- Cars and other vehicles available in Watauga in owner-occupied houses/condos
- 55no vehicle
- 1,2301 vehicle
- 3,0432 vehicles
- 1,4963 vehicles
- 2144 vehicles
- 2555+ vehicles
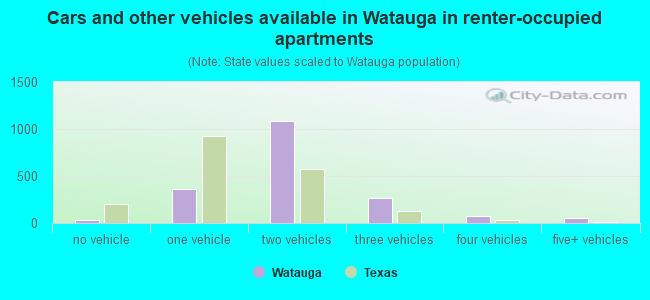
- Cars and other vehicles available in Watauga in renter-occupied apartments
- 33no vehicle
- 3581 vehicle
- 1,0812 vehicles
- 2623 vehicles
- 794 vehicles
- 515+ vehicles
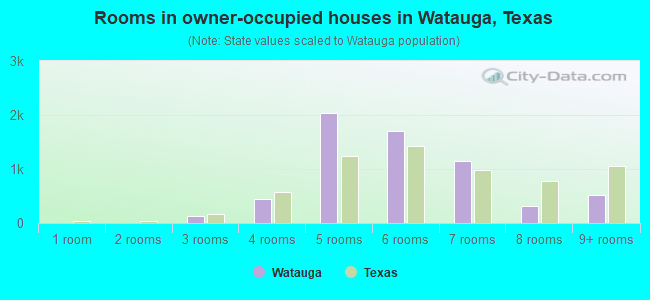
- Rooms in owner-occupied houses in Watauga, Texas
- 51 room
- 02 rooms
- 1263 rooms
- 4414 rooms
- 2,0455 rooms
- 1,6966 rooms
- 1,1477 rooms
- 3238 rooms
- 5109+ rooms
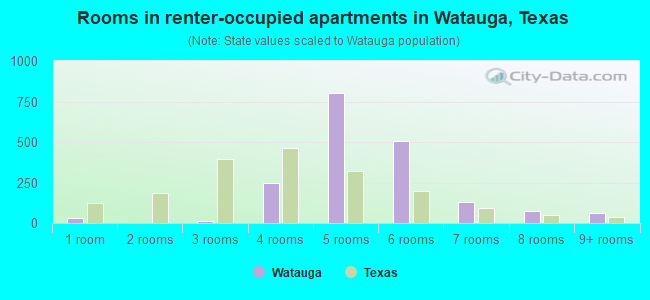
- Rooms in renter-occupied apartments in Watauga, Texas
- 331 room
- 02 rooms
- 143 rooms
- 2474 rooms
- 8015 rooms
- 5076 rooms
- 1287 rooms
- 728 rooms
- 639+ rooms
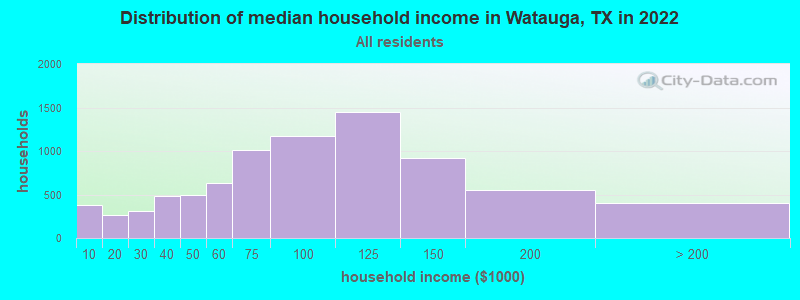
Watauga, TX household income distribution

- 381Less than $10,000
- 267$10,000 to $19,999
- 307$20,000 to $29,999
- 485$30,000 to $39,999
- 497$40,000 to $49,999
- 633$50,000 to $59,999
- 1,008$60,000 to $74,999
- 1,172$75,000 to $99,999
- 1,454$100,000 to $124,999
- 921$125,000 to $149,999
- 550$150,000 to $199,999
- 398$200,000 or more
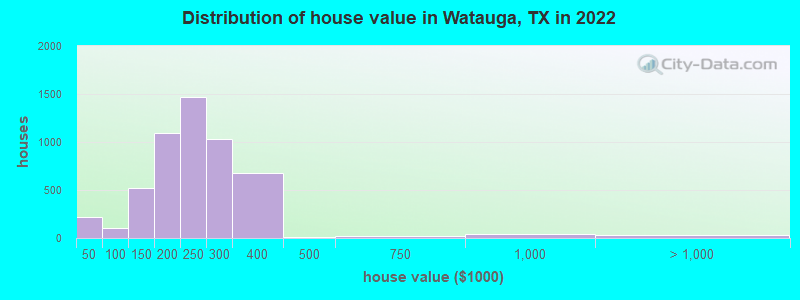
Home value of owner - occupied houses in 2022 in Watauga, TX
-
- 68Less than $10,000
- 31$10,000 to $14,999
- 58$15,000 to $19,999
- 10$20,000 to $24,999
- 48$25,000 to $29,999
- 7$50,000 to $59,999
- 9$60,000 to $69,999
- 7$70,000 to $79,999
- 28$80,000 to $89,999
- 56$90,000 to $99,999
- 286$100,000 to $124,999
- 230$125,000 to $149,999
- 549$150,000 to $174,999
- 544$175,000 to $199,999
- 1,465$200,000 to $249,999
- 1,029$250,000 to $299,999
- 681$300,000 to $399,999
- 13$400,000 to $499,999
- 16$500,000 to $749,999
- 44$750,000 to $999,999
- 20$1,000,000 to $1,499,999
- 15$1,500,000 to $1,999,999
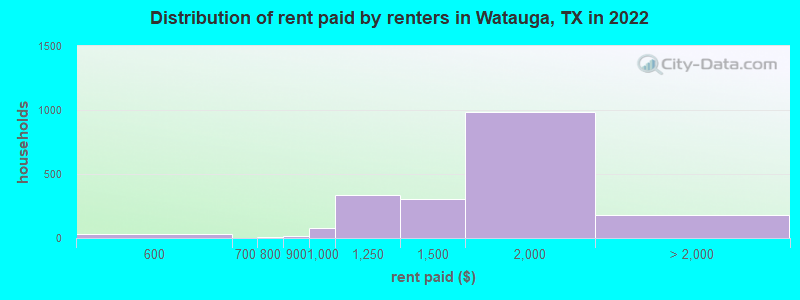
Rent paid by renters in 2022 in Watauga, TX
-
- 33$500 to $549
- 9$750 to $799
- 16$800 to $899
- 74$900 to $999
- 334$1,000 to $1,249
- 305$1,250 to $1,499
- 981$1,500 to $1,999
- 15$3,500 or more
- 165No cash rent
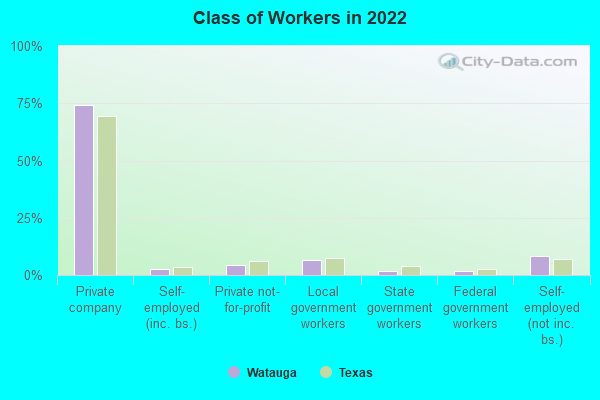
Percentage of workers working in this county: 78.5%
Number of people working at home: 2,065 (15.6% of all workers)
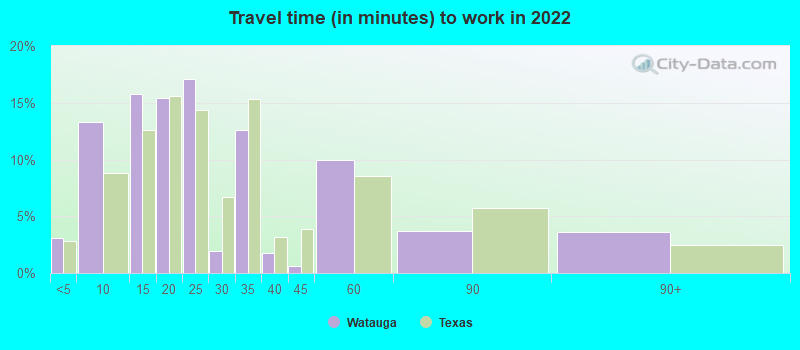
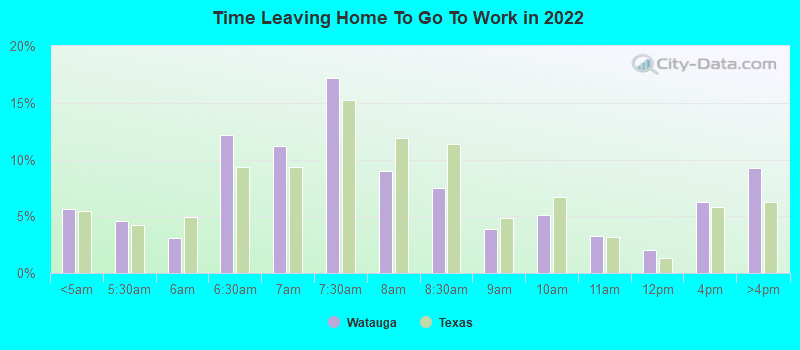
Travel time to work (commute)
- Less than 5 minutes: 148
- 5 to 9 minutes: 499
- 10 to 14 minutes: 875
- 15 to 19 minutes: 1,757
- 20 to 24 minutes: 1,839
- 25 to 29 minutes: 804
- 30 to 34 minutes: 2,116
- 35 to 39 minutes: 466
- 40 to 44 minutes: 373
- 45 to 59 minutes: 1,444
- 60 to 89 minutes: 829
- 90 or more minutes: 65
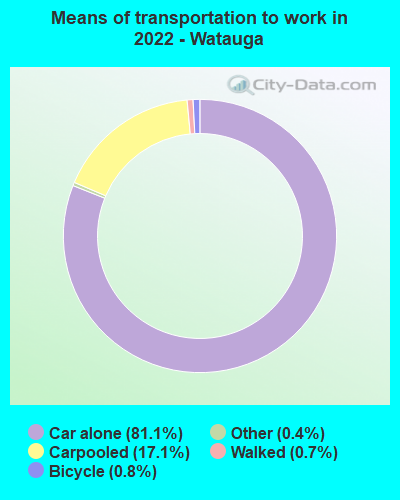
Means of transportation to work:
- Drove a car alone: 3,905 (59.2%)
- Carpooled: 852 (12.9%)
- Taxi: 22 (0.3%)
- Bicycle: 26 (0.4%)
- Walked: 35 (0.5%)
- Worked at home: 2,065 (31.3%)
- Unemployment by race in 2022
- Unemployment rate for White non-Hispanic residents
- 6.5%Males
- 3.2%Females
- Unemployment rate for Black residents
- 3.7%Males
- 4.1%Females
- Unemployment rate for American Indian and Alaska Native residents
- 4.7%Females
- Unemployment rate for Asian residents
- 5.0%Females
- Unemployment rate for two or more race residents
- 2.6%Females
- Unemployment rate for Hispanic or Latino residents
- 3.0%Males
- 2.9%Females
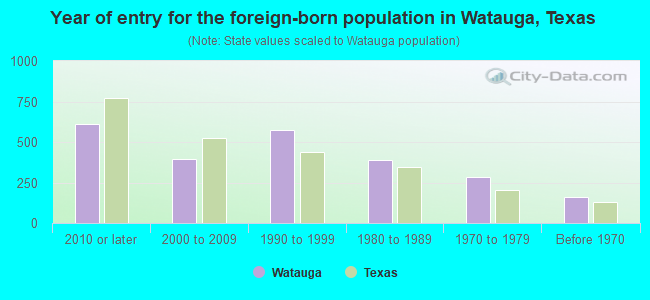
- Year of entry for the foreign-born population in Watauga, Texas
- 6142010 or later
- 3972000 to 2009
- 5731990 to 1999
- 3861980 to 1989
- 2811970 to 1979
- 159Before 1970
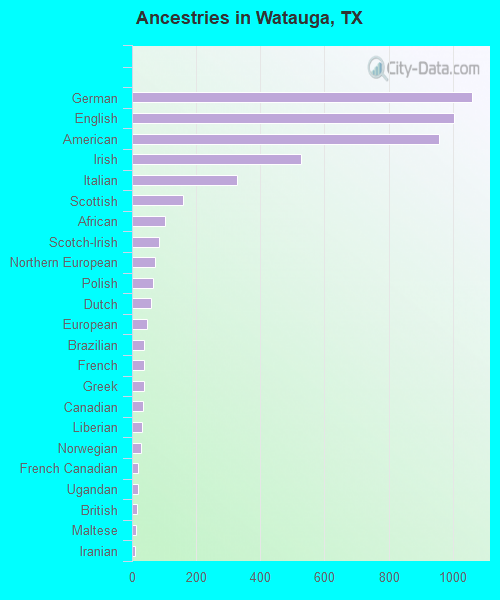
First ancestries reported:
- German: 1,060 (8.3%)
- English: 1,003 (7.8%)
- American: 956 (7.5%)
- Irish: 528 (4.1%)
- Italian: 327 (2.6%)
- Scottish: 159 (1.2%)
- African: 103 (0.8%)
- Scotch-Irish: 83 (0.6%)
- Northern European: 71 (0.6%)
- Polish: 67 (0.5%)
- Dutch: 59 (0.5%)
- European: 46 (0.4%)
- Brazilian: 38 (0.3%)
- French: 38 (0.3%)
- Greek: 36 (0.3%)
- Canadian: 34 (0.3%)
- Liberian: 32 (0.2%)
- Norwegian: 29 (0.2%)
- French Canadian: 20 (0.2%)
- Ugandan: 18 (0.1%)
- British: 15 (0.1%)
- Maltese: 12 (0.09%)
- Iranian: 10 (0.08%)
- Swedish: 8 (0.06%)
- Czech: 7 (0.05%)
- Russian: 7 (0.05%)
- Romanian: 5 (0.04%)
- Scandinavian: 5 (0.04%)
- Slovak: 4 (0.03%)
Most common places of birth for foreign-born residents (%):
| Watauga: | 40.7% (994) |
| Texas: | 48.4% (2,411,723) |
| Watauga: | 19.2% (468) |
| Texas: | 2.1% (103,148) |
| Watauga: | 5.7% (139) |
| Texas: | 3.7% (184,770) |
| Watauga: | 5.7% (138) |
| Texas: | 4.5% (224,455) |
| Watauga: | 4.2% (102) |
| Texas: | 0.1% (5,906) |
| Watauga: | 3.5% (86) |
| Texas: | 6.1% (306,347) |
| Watauga: | 3.0% (73) |
| Texas: | 1.2% (61,555) |
| Watauga: | 1.7% (41) |
| Texas: | 1.5% (72,413) |
| Watauga: | 1.6% (39) |
| Texas: | 0.2% (9,654) |
| Watauga: | 1.5% (37) |
| Texas: | 0.2% (9,141) |
Place of birth for U.S.-born residents:
- This state: 14,205
- Other state: 6,853
- Northeast: 1,238
- Midwest: 2,023
- South: 1,765
- West: 1,811
88.4% of Watauga residents lived in the same house 1 years ago.
Out of people who lived in different houses, 36.2% lived in this county.
Out of people who lived in different counties, 51.1% lived in Texas.
| Watauga: | 88.4% |
| State average: | 85.7% |
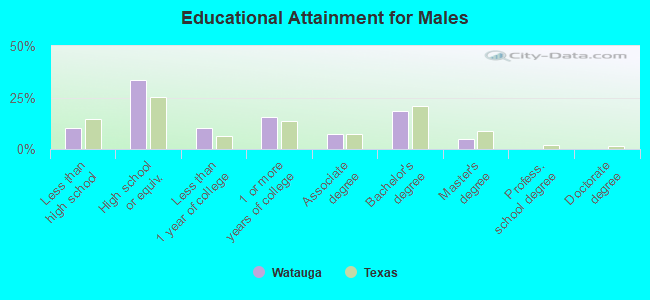
Education attainment for males 25 years and older:
- No schooling: 27
- Nursery to 4th grade: 0
- 5th and 6th grade: 76
- 7th and 8th grade: 76
- 9th grade: 113
- 10th grade: 154
- 11th grade: 95
- 12th grade, no diploma: 264
- High school graduate (or equivalency): 2,684
- Less than 1 year of college: 825
- Some college more than 1 year, no degree: 1,240
- Associate degree: 572
- Bachelor's degree: 1,471
- Master's degree: 379
- Professional school degree: 8
- Doctorate degree: 15
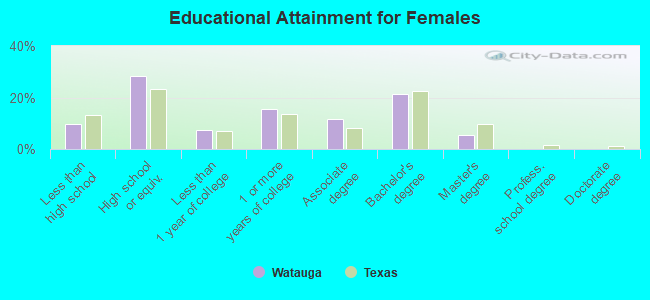
Education attainment for females 25 years and older:
- No schooling: 177
- Nursery to 4th grade: 33
- 5th and 6th grade: 46
- 7th and 8th grade: 57
- 9th grade: 225
- 10th grade: 35
- 11th grade: 56
- 12th grade, no diploma: 128
- High school graduate (or equivalency): 2,249
- Less than 1 year of college: 589
- Some college more than 1 year, no degree: 1,234
- Associate degree: 913
- Bachelor's degree: 1,688
- Master's degree: 432
- Professional school degree: 6
- Doctorate degree: 13
Housing units in structures:
- One, detached: 8,113
- One, attached: 61
- 3 or 4: 18
- 5 to 9: 109
- 20 to 49: 58
- Mobile homes: 39
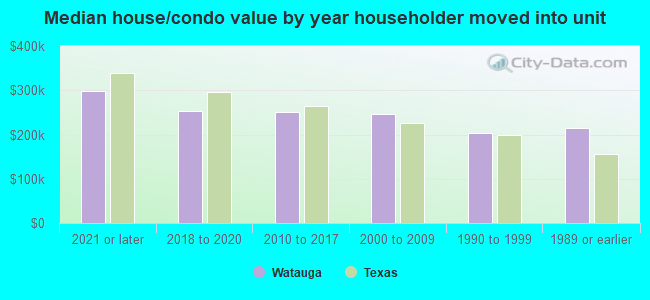
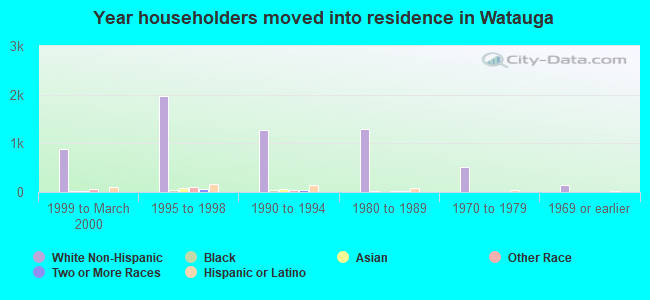
House/condo owner moved in on average 16 years ago
Renter moved in on average 4 years ago
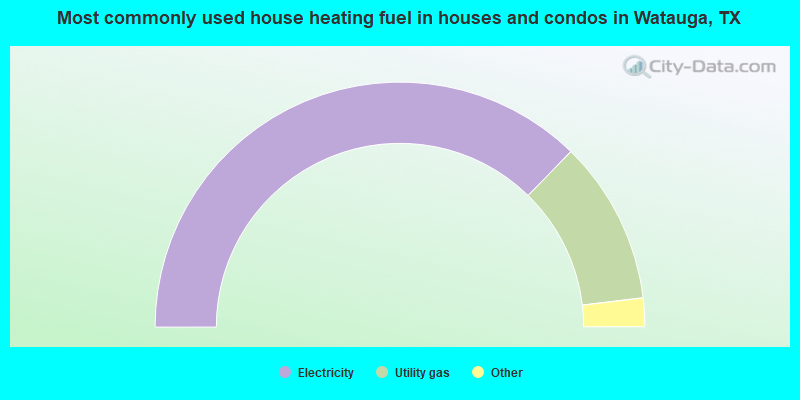
- 74.6%Electricity
- 21.6%Utility gas
- 2.7%Solar energy
- 0.7%Bottled, tank, or LP gas
- 0.4%Wood
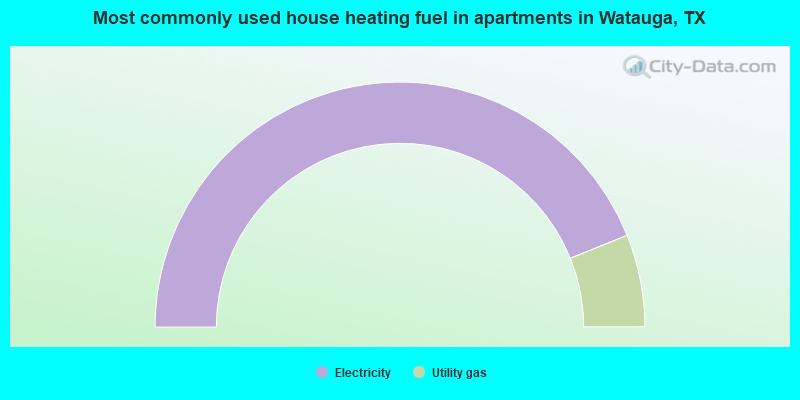
- 87.8%Electricity
- 12.2%Utility gas
Private vs. public school enrollment:
| Here: | 9.2% |
| Texas: | 8.8% |
| Here: | 7.0% |
| Texas: | 8.0% |
| Here: | 14.3% |
| Texas: | 16.2% |