West New York, NJ (New Jersey) Houses and Residents
Estimated median house or condo value in 2022: $439,851 (it was $168,900 in 2000 )
West New York:
$439,851New Jersey:
$428,900
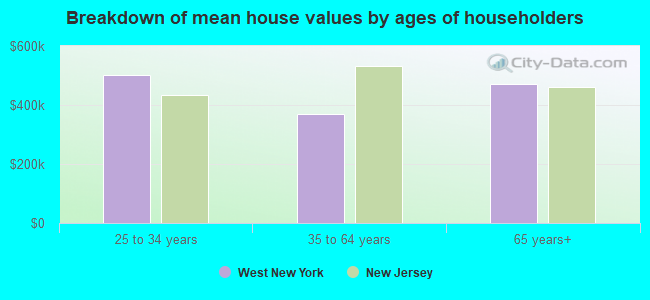
Lower value quartile - upper value quartile: $298,191 - $659,579Mean price in 2022: Detached houses: $479,449 Here:
$479,449State:
$537,591
Townhouses or other attached units: $537,768 Here:
$537,768State:
$381,113
In 2-unit structures: $508,378 Here:
$508,378State:
$444,476
In 3-to-4-unit structures: $610,162 Here:
$610,162State:
$457,463
In 5-or-more-unit structures: $397,691 Here:
$397,691State:
$368,745
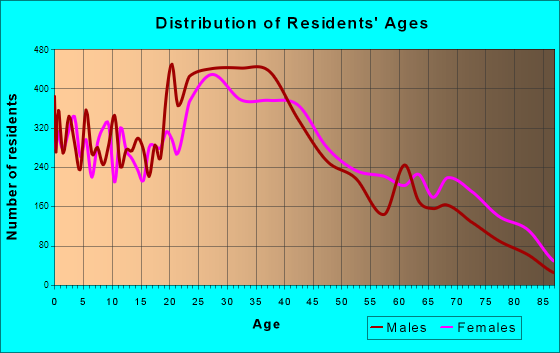
Total population: 52,597 (Urban population: 45,768, Rural population: 0)
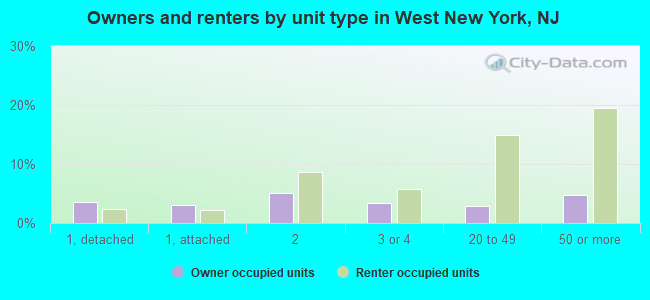
Houses: 22,715 (21,113 occupied: 5,091 owner occupied, 16,544 renter occupied )
% of renters here:
76%State:
35%
Housing density: 22,331 houses/condos per square mile
Median price asked for vacant for-sale houses and condos in 2022: $412,398.
Median contract rent in 2022: $1,472 (lower quartile is $1,021, upper quartile is $1,982)
Median rent asked for vacant for-rent units in 2022: $1,863
Median gross rent in West New York, NJ in 2022: $1,579
Housing units in West New York with a mortgage: 2,963 (317 second mortgage, 0 home equity loan, 319 both second mortgage and home equity loan )Houses without a mortgage: 0
Median household income for houses/condos with a mortgage: $139,393
Median household income for apartments without a mortgage: $80,323
Median monthly housing costs: $1,625
Data:
Median house or condo value ($)
Median house or condo value ($ change since 2000)
Median house or condo value ($) - White
Median house or condo value ($) - Black or African American
Median house or condo value ($) - Asian
Median house or condo value ($) - Hispanic or Latino
Median house or condo value ($) - American Indian and Alaska Native
Median house or condo value ($) - Multirace
Median house or condo value ($) - Other Race
Median price asked for mobile homes ($)
Household density (households per square mile)
Mean house or condo value by units in structure - 1, detached ($)
Mean house or condo value by units in structure - 1, attached ($)
Mean house or condo value by units in structure - 2 ($)
Mean house or condo value by units in structure by units in structure - 3 or 4 ($)
Mean house or condo value by units in structure - 5 or more ($)
Mean house or condo value by units in structure - Boat, RV, van, etc. ($)
Mean house or condo value by units in structure - Mobile home ($)
Median contract rent ($)
Median contract rent - Lower quartile ($)
Median contract rent - Upper quartile ($)
Median gross rent ($)
Urban houses (%)
Rural houses (%)
Houses occupied (%)
Houses occupied (% change since 2000)
Houses owner occupied (%)
Houses owner occupied (% change since 2000)
Houses renter occupied (%)
Houses renter occupied (% change since 2000)
Vacant housing units - For rent (%)
Vacant housing units - For rent (% change since 2000)
Vacant housing units - For sale only (%)
Vacant housing units - For sale only (% change since 2000)
Vacant housing units - Rented or sold, not occupied (%)
Vacant housing units - Rented or sold, not occupied (% change since 2000)
Vacant housing units - For seasonal, recreational, or occasional use (%)
Vacant housing units - For seasonal, recreational, or occasional use (% change since 2000)
Vacant housing units - For migrant workers (%)
Vacant housing units - For migrant workers (% change since 2000)
Vacant housing units - Other vacant (%)
Vacant housing units - Other vacant (% change since 2000)
Median monthly housing costs ($)
Median household income for houses/condos with a mortgage ($)
Median household income for houses/condos without a mortgage ($)
Median household income ($)
Median household income ($) - White
Median household income ($) - Black or African American
Median household income ($) - Asian
Median household income ($) - Hispanic or Latino
Median household income ($) - American Indian and Alaska Native
Median household income ($) - Multirace
Median household income ($) - Other Race
Mortgage status - with mortgage (%)
Mortgage status - with second mortgage (%)
Mortgage status - with home equity loan (%)
Mortgage status - with both second mortgage and home equity loan (%)
Mortgage status - without a mortgage (%)
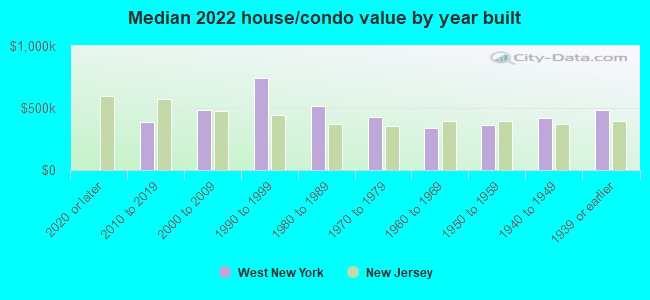
Median year house/condo built
Median year apartment built
Household type by relationship - Male householder living alone (%)
Household type by relationship - Male householder not living alone (%)
Household type by relationship - Female householder living alone (%)
Household type by relationship - Female householder not living alone (%)
Household type by relationship - Opposite-Sex spouse (%)
Household type by relationship - Same-Sex spouse (%)
Household type by relationship - Opposite-Sex unmarried partner (%)
Household type by relationship - Same-Sex unmarried partner (%)
Household type by relationship - In group quarters (%)
Size of family households - 2-person household (%)
Size of family households - 3-person household (%)
Size of family households - 4-person household (%)
Size of family households - 5-person household (%)
Size of family households - 6-person household (%)
Size of family households - 7-or-more-person household (%)
Size of nonfamily households - 1-person household (%)
Size of nonfamily households - 2-person household (%)
Size of nonfamily households - 3-person household (%)
Size of nonfamily households - 4-person household (%)
Size of nonfamily households - 5-person household (%)
Size of nonfamily households - 6-person household (%)
Size of nonfamily households - 7-or-moreperson household (%)
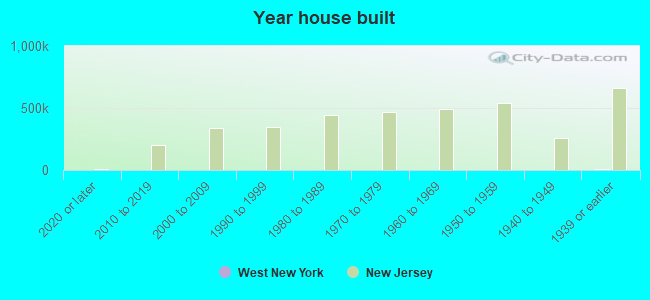
Year house built - Built 2010 or later (%)
Year house built - Built 2000 to 2009 (%)
Year house built - Built 1990 to 1999 (%)
Year house built - Built 1980 to 1989 (%)
Year house built - Built 1970 to 1979 (%)
Year house built - Built 1960 to 1969 (%)
Year house built - Built 1950 to 1959 (%)
Year house built - Built 1940 to 1949 (%)
Year house built - Built 1939 or earlier (%)
Median number of rooms in houses and condos
Median number of rooms in apartments
Median number of bedrooms in owner occupied houses
Mean number of bedrooms in owner occupied houses
Median number of bedrooms in renter occupied houses
Mean number of bedrooms in renter occupied houses
Median number of vehichles in owner occupied houses
Mean number of vehichles in owner occupied houses
Median number of vehichles in renter occupied houses
Mean number of vehichles in renter occupied houses
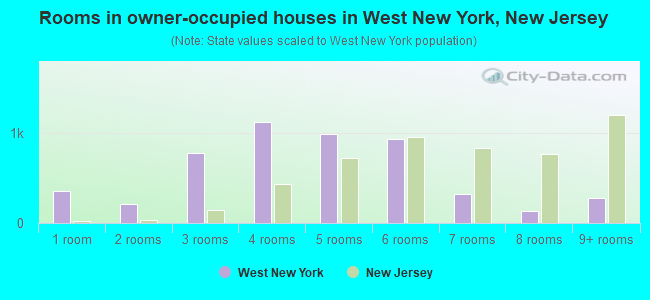
Rooms in owner-occupied houses - 1 room (%)
Rooms in owner-occupied houses - 2 rooms (%)
Rooms in owner-occupied houses - 3 rooms (%)
Rooms in owner-occupied houses - 4 rooms (%)
Rooms in owner-occupied houses - 5 rooms (%)
Rooms in owner-occupied houses - 6 rooms (%)
Rooms in owner-occupied houses - 7 rooms (%)
Rooms in owner-occupied houses - 8 rooms (%)
Rooms in owner-occupied houses - 9+ rooms (%)
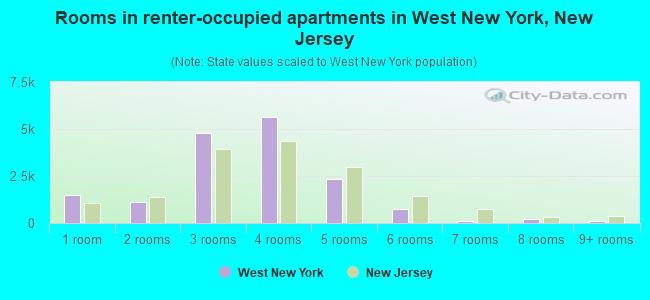
Rooms in renter-occupied houses - 1 room (%)
Rooms in renter-occupied houses - 2 rooms (%)
Rooms in renter-occupied houses - 3 rooms (%)
Rooms in renter-occupied houses - 4 rooms (%)
Rooms in renter-occupied houses - 5 rooms (%)
Rooms in renter-occupied houses - 6 rooms (%)
Rooms in renter-occupied houses - 7 rooms (%)
Rooms in renter-occupied houses - 8 rooms (%)
Rooms in renter-occupied houses - 9+ rooms (%)
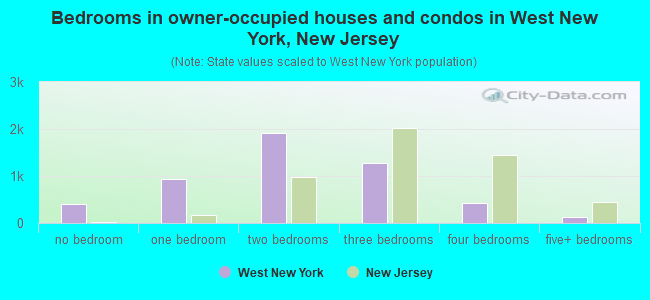
Bedrooms in owner-occupied houses - no bedrooms (%)
Bedrooms in owner-occupied houses - 1 bedroom (%)
Bedrooms in owner-occupied houses - 2 bedrooms (%)
Bedrooms in owner-occupied houses - 3 bedrooms (%)
Bedrooms in owner-occupied houses - 4 bedrooms (%)
Bedrooms in owner-occupied houses - 5+ bedrooms (%)
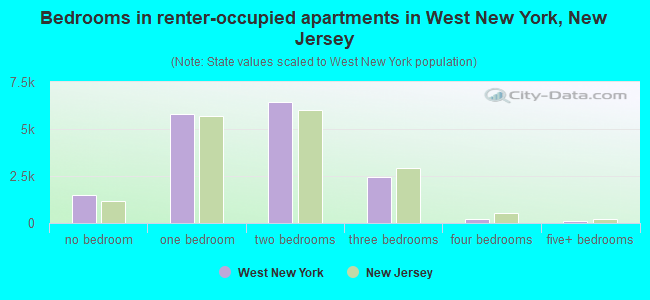
Bedrooms in renter-occupied houses - no bedrooms (%)
Bedrooms in renter-occupied houses - 1 bedroom (%)
Bedrooms in renter-occupied houses - 2 bedrooms (%)
Bedrooms in renter-occupied houses - 3 bedrooms (%)
Bedrooms in renter-occupied houses - 4 bedrooms (%)
Bedrooms in renter-occupied houses - 5+ bedrooms (%)
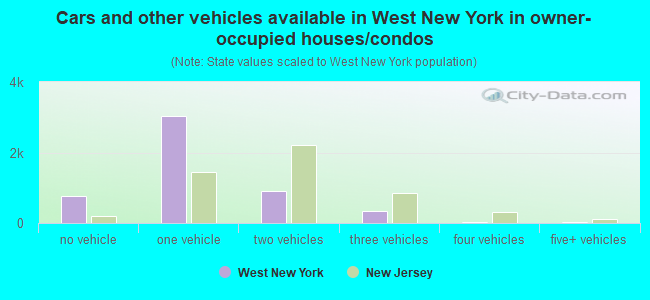
Vehicles available in owner-occupied houses - no vehicle available (%)
Vehicles available in owner-occupied houses - 1 vehicle available(%)
Vehicles available in owner-occupied houses - 2 Vehicles available (%)
Vehicles available in owner-occupied houses - 3 Vehicles available (%)
Vehicles available in owner-occupied houses - 4 Vehicles available (%)
Vehicles available in owner-occupied houses - 5+ Vehicles available (%)
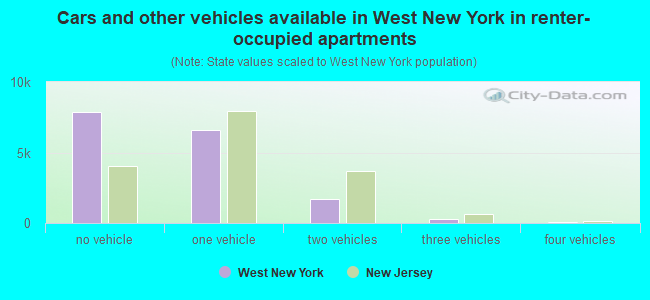
Vehicles available in renter-occupied houses - no vehicle available (%)
Vehicles available in renter-occupied houses - 1 vehicle available (%)
Vehicles available in renter-occupied houses - 2 Vehicles available (%)
Vehicles available in renter-occupied houses - 3 Vehicles available (%)
Vehicles available in renter-occupied houses - 4 Vehicles available (%)
Vehicles available in renter-occupied houses - 5+ Vehicles available (%)
Housing units in structures - 1, detached (%)
Housing units in structures - 1, attached (%)
Housing units in structures - 2 (%)
Housing units in structures - 3 or 4 (%)
Housing units in structures - 5 to 9 (%)
Housing units in structures - 10 to 19 (%)
Housing units in structures - 20 to 49 (%)
Housing units in structures - 50 or more (%)
Housing units in structures - Mobile home (%)
Housing units in structures - Boat, RV, van, etc. (%)
Housing units in structures - Owners - 1, detached (%)
Housing units in structures - Owners - 1, attached (%)
Housing units in structures - Owners - 2 (%)
Housing units in structures - Owners - 3 or 4 (%)
Housing units in structures - Owners - 5 to 9 (%)
Housing units in structures - Owners - 10 to 19 (%)
Housing units in structures - Owners - 20 to 49 (%)
Housing units in structures - Owners - 50 or more (%)
Housing units in structures - Owners - Mobile home (%)
Housing units in structures - Owners - Boat, RV, van, etc. (%)
Housing units in structures - Renters - 1, detached (%)
Housing units in structures - Renters - 1, attached (%)
Housing units in structures - Renters - 2 (%)
Housing units in structures - Renters - 3 or 4 (%)
Housing units in structures - Renters - 5 to 9 (%)
Housing units in structures - Renters - 10 to 19 (%)
Housing units in structures - Renters - 20 to 49 (%)
Housing units in structures - Renters - 50 or more (%)
Housing units in structures - Renters - Mobile home (%)
Housing units in structures - Renters - Boat, RV, van, etc. (%)
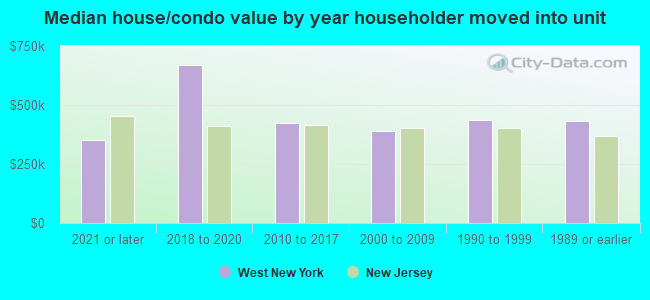
House/condo owner moved in on average (years ago)
Renter moved in on average (years ago)
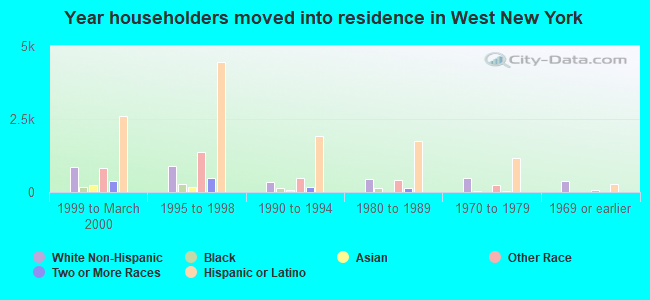
Year householder moved into unit - Moved in 1999 to March 2000 (%)
Year householder moved into unit - Moved in 1999 to March 2000 (%) - White
Year householder moved into unit - Moved in 1999 to March 2000 (%) - Black or African American
Year householder moved into unit - Moved in 1999 to March 2000 (%) - Asian
Year householder moved into unit - Moved in 1999 to March 2000 (%) - Hispanic or Latino
Year householder moved into unit - Moved in 1999 to March 2000 (%) - American Indian and Alaska Native
Year householder moved into unit - Moved in 1999 to March 2000 (%) - Multirace
Year householder moved into unit - Moved in 1999 to March 2000 (%) - Other Race
Year householder moved into unit - Moved in 1995 to 1998 (%)
Year householder moved into unit - Moved in 1995 to 1998 (%) - White
Year householder moved into unit - Moved in 1995 to 1998 (%) - Black or African American
Year householder moved into unit - Moved in 1995 to 1998 (%) - Asian
Year householder moved into unit - Moved in 1995 to 1998 (%) - Hispanic or Latino
Year householder moved into unit - Moved in 1995 to 1998 (%) - American Indian and Alaska Native
Year householder moved into unit - Moved in 1995 to 1998 (%) - Multirace
Year householder moved into unit - Moved in 1995 to 1998 (%) - Other Race
Year householder moved into unit - Moved in 1990 to 1994 (%)
Year householder moved into unit - Moved in 1990 to 1994 (%) - White
Year householder moved into unit - Moved in 1990 to 1994 (%) - Black or African American
Year householder moved into unit - Moved in 1990 to 1994 (%) - Asian
Year householder moved into unit - Moved in 1990 to 1994 (%) - Hispanic or Latino
Year householder moved into unit - Moved in 1990 to 1994 (%) - American Indian and Alaska Native
Year householder moved into unit - Moved in 1990 to 1994 (%) - Multirace
Year householder moved into unit - Moved in 1990 to 1994 (%) - Other Race
Year householder moved into unit - Moved in 1980 to 1989 (%)
Year householder moved into unit - Moved in 1980 to 1989 (%) - White
Year householder moved into unit - Moved in 1980 to 1989 (%) - Black or African American
Year householder moved into unit - Moved in 1980 to 1989 (%) - Asian
Year householder moved into unit - Moved in 1980 to 1989 (%) - Hispanic or Latino
Year householder moved into unit - Moved in 1980 to 1989 (%) - American Indian and Alaska Native
Year householder moved into unit - Moved in 1980 to 1989 (%) - Multirace
Year householder moved into unit - Moved in 1980 to 1989 (%) - Other Race
Year householder moved into unit - Moved in 1970 to 1979 (%)
Year householder moved into unit - Moved in 1970 to 1979 (%) - White
Year householder moved into unit - Moved in 1970 to 1979 (%) - Black or African American
Year householder moved into unit - Moved in 1970 to 1979 (%) - Asian
Year householder moved into unit - Moved in 1970 to 1979 (%) - Hispanic or Latino
Year householder moved into unit - Moved in 1970 to 1979 (%) - American Indian and Alaska Native
Year householder moved into unit - Moved in 1970 to 1979 (%) - Multirace
Year householder moved into unit - Moved in 1970 to 1979 (%) - Other Race
Year householder moved into unit - Moved in 1969 or earlier (%)
Year householder moved into unit - Moved in 1969 or earlier (%) - White
Year householder moved into unit - Moved in 1969 or earlier (%) - Black or African American
Year householder moved into unit - Moved in 1969 or earlier (%) - Asian
Year householder moved into unit - Moved in 1969 or earlier (%) - Hispanic or Latino
Year householder moved into unit - Moved in 1969 or earlier (%) - American Indian and Alaska Native
Year householder moved into unit - Moved in 1969 or earlier (%) - Multirace
Year householder moved into unit - Moved in 1969 or earlier (%) - Other Race
Housing units lacking complete plumbing facilities (%)
Housing units lacking complete kitchen facilities (%)
House heating fuel used in houses and condos - Utility gas (%)
House heating fuel used in houses and condos - Bottled, tank, or LP gas (%)
House heating fuel used in houses and condos - Electricity (%)
House heating fuel used in houses and condos - Fuel oil, kerosene, etc. (%)
House heating fuel used in houses and condos - Coal or coke (%)
House heating fuel used in houses and condos - Wood (%)
House heating fuel used in houses and condos - Solar energy (%)
House heating fuel used in houses and condos - Other fuel (%)
House heating fuel used in houses and condos - No fuel used (%)
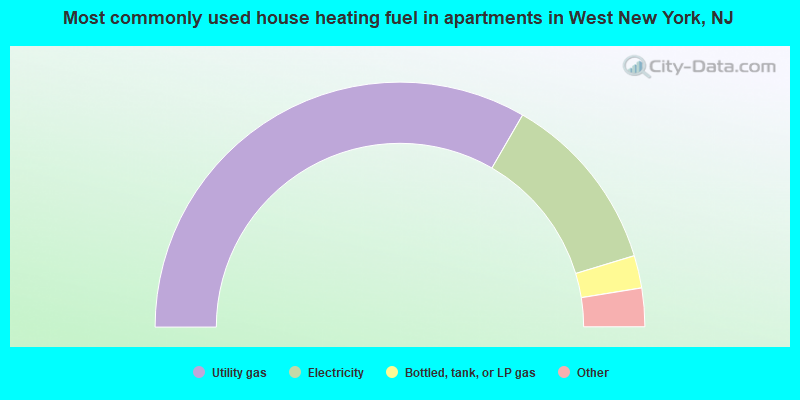
House heating fuel used in apartments - Utility gas (%)
House heating fuel used in apartments - Bottled, tank, or LP gas (%)
House heating fuel used in apartments - Electricity (%)
House heating fuel used in apartments - Fuel oil, kerosene, etc. (%)
House heating fuel used in apartments - Coal or coke (%)
House heating fuel used in apartments - Wood (%)
House heating fuel used in apartments - Solar energy (%)
House heating fuel used in apartments - Other fuel (%)
House heating fuel used in apartments - No fuel used (%)
Median year house/condo built: 1950Median year apartment built: 1968Household type by relationship:
Households: 51,800
Male householders: 10,727 (2,604 living alone ), Female householders: 9,629 (3,083 living alone )7,586 spouses (7,482 opposite-sex spouses ), 1,794 unmarried partners , (1,735 opposite-sex unmarried partners ), 13,921 children (13,380 natural , 47 adopted , 493 stepchildren ), 835 grandchildren , 863 brothers or sisters , 1,539 parents , 0 foster children , 1,051 other relatives , 3,768 non-relatives In group quarters: 81
Size of family households: 4,931 2-persons , 3,478 3-persons , 1,997 4-persons , 1,565 5-persons , 216 6-persons , 376 7-or-more-persons .
Size of nonfamily households: 6,618 1-person , 1,721 2-persons , 312 3-persons , 128 4-persons , 50 5-persons , 36 6-persons , 20 7-or-more-persons .
4,685 married couples with children. single-parent households (628 men , 2,899 women ).
23.8% of residents of West New York speak English at home. of residents speak Spanish at home (43% speak English very well , 20% speak English well , 23% speak English not well , 14% don't speak English at all ).of residents speak other Indo-European language at home (88% speak English very well , 8% speak English well , 3% speak English not well ).of residents speak Asian or Pacific Island language at home (66% speak English very well , 22% speak English well , 9% speak English not well , 2% don't speak English at all ).of residents speak other language at home (58% speak English very well , 19% speak English well , 20% speak English not well , 3% don't speak English at all ).
Foreign born population: 29,906 (57.7%)of them are naturalized citizens )
Median number of rooms in houses and condos:
Median number of rooms in apartments
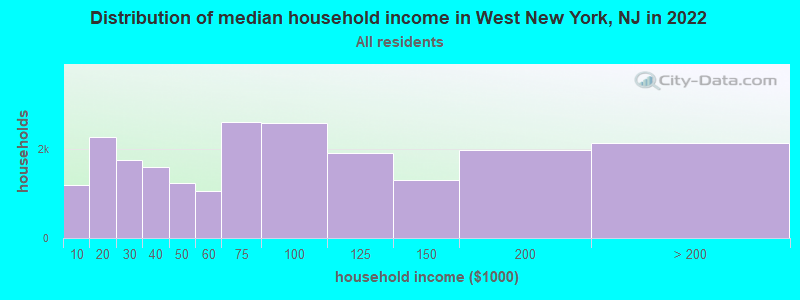
West New York, NJ household income distribution 1,195 Less than $10,0002,265 $10,000 to $19,9991,744 $20,000 to $29,9991,590 $30,000 to $39,9991,235 $40,000 to $49,9991,062 $50,000 to $59,9992,595 $60,000 to $74,9992,583 $75,000 to $99,9991,896 $100,000 to $124,9991,293 $125,000 to $149,9991,961 $150,000 to $199,9992,121 $200,000 or more
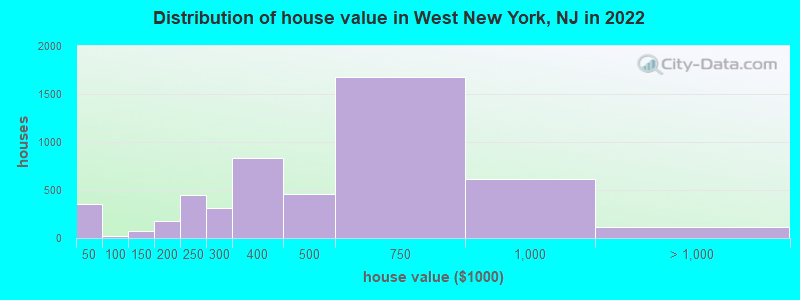
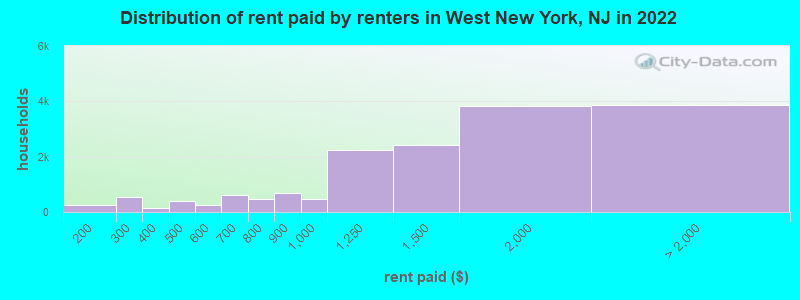
Home value of owner - occupied houses in 2022 in West New York, NJ 128 Less than $10,00032 $10,000 to $14,999154 $25,000 to $29,99923 $30,000 to $34,99918 $40,000 to $49,99917 $100,000 to $124,99953 $125,000 to $149,99953 $150,000 to $174,999125 $175,000 to $199,999448 $200,000 to $249,999312 $250,000 to $299,999836 $300,000 to $399,999454 $400,000 to $499,9991,680 $500,000 to $749,999616 $750,000 to $999,99981 $1,000,000 to $1,499,99920 $1,500,000 to $1,999,99913 $2,000,000 or moreRent paid by renters in 2022 in West New York, NJ 4 Less than $100266 $150 to $199296 $200 to $249262 $250 to $299127 $300 to $34934 $350 to $39980 $400 to $449302 $450 to $499117 $500 to $549139 $550 to $599352 $600 to $649251 $650 to $699226 $700 to $749252 $750 to $799703 $800 to $899471 $900 to $9992,237 $1,000 to $1,2492,434 $1,250 to $1,4993,827 $1,500 to $1,9991,459 $2,000 to $2,4991,060 $2,500 to $2,999691 $3,000 to $3,499595 $3,500 or more65 No cash rent
Percentage of workers working in this county: 55.8%Number of people working at home: 4,275 (15.6% of all workers )
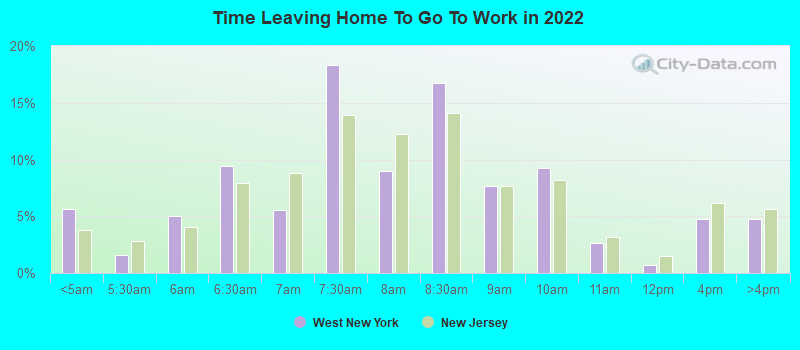
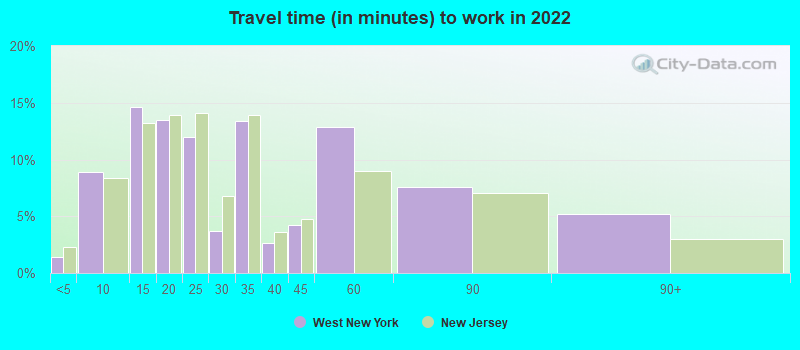
Travel time to work (commute)
Less than 5 minutes: 3485 to 9 minutes: 81410 to 14 minutes: 1,97615 to 19 minutes: 2,55920 to 24 minutes: 2,35825 to 29 minutes: 99330 to 34 minutes: 3,69535 to 39 minutes: 64240 to 44 minutes: 2,09045 to 59 minutes: 3,07760 to 89 minutes: 3,08590 or more minutes: 1,235
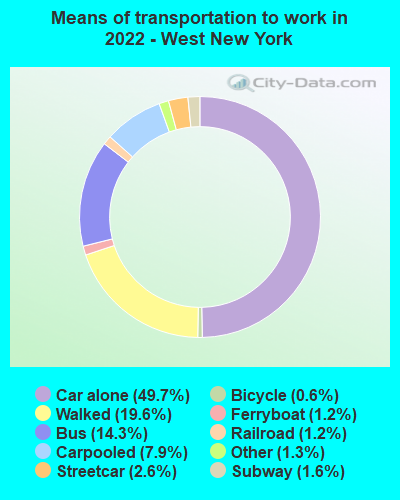
Means of transportation to work:
Drove a car alone: 4,735 (34.9%)Carpooled: 789 (5.8%)Bus : 1,361 (10.0%)Subway or elevated rail : 220 (1.6%)Long-distance train or commuter rail : 110 (0.8%)Light rail, streetcar or trolley : 171 (1.3%)Ferryboat: 85 (0.6%)Taxi: 144 (1.1%)Bicycle: 43 (0.3%)Walked: 1,951 (14.4%)Worked at home: 4,275 (31.5%)
Unemployment by race in 2022
Unemployment rate for White non-Hispanic residents 0.9% Males1.1% FemalesUnemployment rate for Black residents 4.2% Males18.7% FemalesUnemployment rate for American Indian and Alaska Native residents 7.2% MalesUnemployment rate for Asian residents 2.4% Males1.5% FemalesUnemployment rate for other race residents 11.3% Males14.4% FemalesUnemployment rate for two or more race residents 5.7% Males7.0% FemalesUnemployment rate for Hispanic or Latino residents 8.5% Males7.7% Females
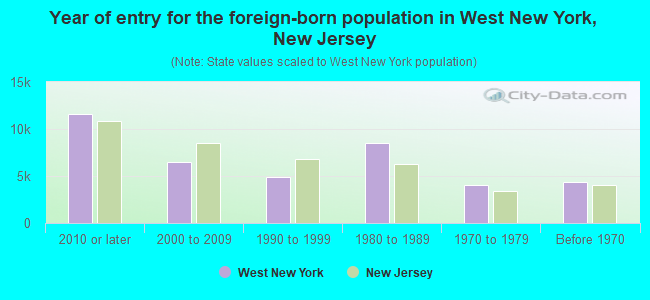
Year of entry for the foreign-born population in West New York, New Jersey
11,595 2010 or later 6,521 2000 to 2009 4,932 1990 to 1999 8,526 1980 to 1989 3,999 1970 to 1979 4,312 Before 1970
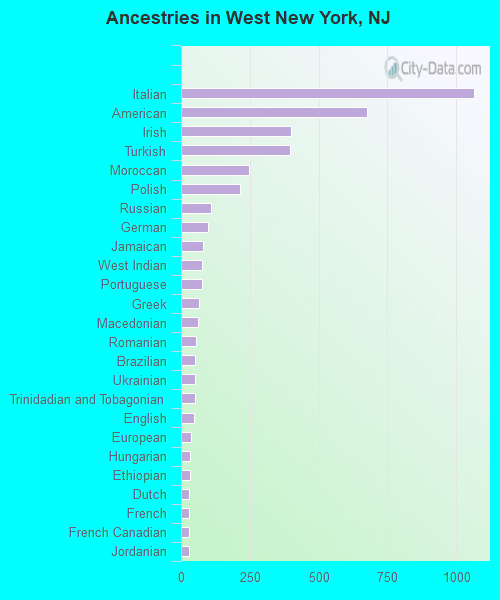
First ancestries reported:
Italian: 1,066 (2.9%)
American: 677 (1.9%)
Irish: 398 (1.1%)
Turkish: 396 (1.1%)
Moroccan: 247 (0.7%)
Polish: 216 (0.6%)
Russian: 108 (0.3%)
German: 99 (0.3%)
Jamaican: 80 (0.2%)
West Indian: 78 (0.2%)
Portuguese: 78 (0.2%)
Greek: 67 (0.2%)
Macedonian: 62 (0.2%)
Romanian: 55 (0.2%)
Brazilian: 51 (0.1%)
Ukrainian: 51 (0.1%)
Trinidadian and Tobagonian: 51 (0.1%)
English: 47 (0.1%)
European: 37 (0.1%)
Hungarian: 32 (0.09%)
Ethiopian: 32 (0.09%)
Dutch: 30 (0.08%)
French: 30 (0.08%)
French Canadian: 30 (0.08%)
Jordanian: 29 (0.08%)
Egyptian: 25 (0.07%)
Eastern European: 22 (0.06%)
Scotch-Irish: 21 (0.06%)
New Zealander: 18 (0.05%)
Haitian: 16 (0.04%)
Croatian: 15 (0.04%)
Iranian: 15 (0.04%)
Finnish: 14 (0.04%)
Canadian: 14 (0.04%)
Scandinavian: 13 (0.04%)
Scottish: 12 (0.03%)
Belgian: 11 (0.03%)
Slovak: 10 (0.03%)
Lithuanian: 9 (0.02%)
Syrian: 8 (0.02%)
British: 7 (0.02%)
Lebanese: 7 (0.02%)
Australian: 6 (0.02%)
Norwegian: 5 (0.01%) Most common places of birth for foreign-born residents (%): Dominican Republic West New York:
18.6% (5,856)New Jersey:
9.7% (209,055)
Cuba West New York:
16.4% (5,157)New Jersey:
2.1% (45,435)
Colombia West New York:
9.1% (2,875)New Jersey:
4.2% (90,817)
El Salvador West New York:
9.0% (2,830)New Jersey:
2.3% (48,885)
Ecuador West New York:
8.8% (2,778)New Jersey:
4.4% (95,275)
Mexico West New York:
8.4% (2,651)New Jersey:
4.8% (102,527)
Guatemala West New York:
5.2% (1,638)New Jersey:
2.2% (46,813)
Honduras West New York:
4.3% (1,345)New Jersey:
1.7% (37,335)
China, excluding Hong Kong and Taiwan West New York:
2.3% (728)New Jersey:
3.7% (78,969)
India West New York:
2.2% (693)New Jersey:
12.8% (274,609)
Venezuela West New York:
1.9% (610)New Jersey:
0.6% (12,929)
Peru West New York:
1.9% (606)New Jersey:
2.7% (58,563)
Korea West New York:
1.6% (498)New Jersey:
3.3% (70,512)
Place of birth for U.S.-born residents:
This state: 14,367Other state: 5,937Northeast: 4,545Midwest: 222South: 951West: 245 88.5% of West New York residents lived in the same house 1 years ago.
Out of people who lived in different houses, 37.7% lived in this county.
Out of people who lived in different counties, 37.1% lived in New Jersey.
West New York:
88.5%State average:
90.4%
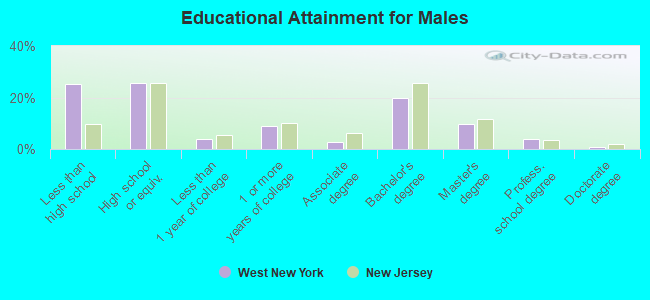
Education attainment for males 25 years and older:
No schooling: 1,693Nursery to 4th grade: 6125th and 6th grade: 5017th and 8th grade: 5059th grade: 28010th grade: 22211th grade: 24912th grade, no diploma: 641High school graduate (or equivalency): 4,794Less than 1 year of college: 691Some college more than 1 year, no degree: 1,684Associate degree: 542Bachelor's degree: 3,687Master's degree: 1,794Professional school degree: 695Doctorate degree: 152
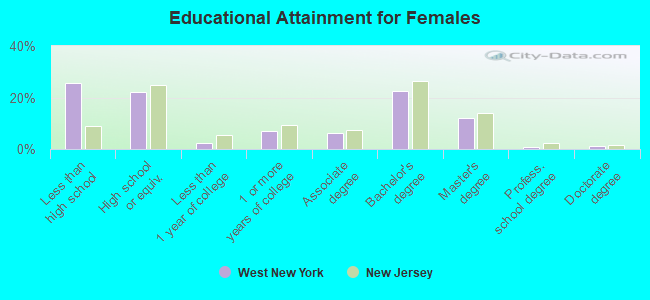
Education attainment for females 25 years and older:
No schooling: 949Nursery to 4th grade: 6015th and 6th grade: 7377th and 8th grade: 4999th grade: 69110th grade: 8311th grade: 45512th grade, no diploma: 743High school graduate (or equivalency): 4,141Less than 1 year of college: 447Some college more than 1 year, no degree: 1,321Associate degree: 1,138Bachelor's degree: 4,174Master's degree: 2,217Professional school degree: 173Doctorate degree: 235
Housing units in structures:
One, detached: 1,369One, attached: 992Two: 3,4943 or 4: 2,2705 to 9: 1,93010 to 19: 3,07620 to 49: 4,15950 or more: 5,387Mobile homes: 33Housing units lacking complete plumbing facilities in 2022: 1.3%Housing units lacking complete kitchen facilities in 2022: 4.3%House/condo owner moved in on average 13 years ago
Renter moved in on average 6 years ago
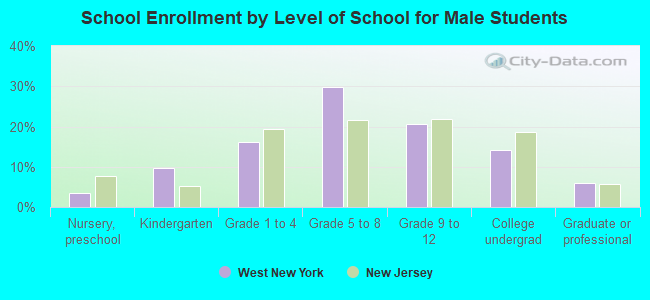
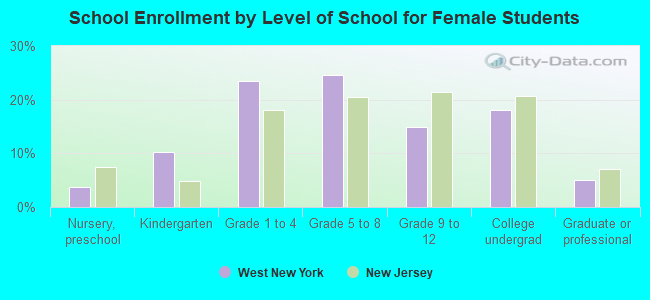
Private vs. public school enrollment:
Students in private schools in grades 1 to 8 (elementary and middle school): 232 Here:
4.6%New Jersey:
12.3%
Students in private schools in grades 9 to 12 (high school): 274 Here:
14.5%New Jersey:
13.1%
Students in private undergraduate colleges: 387 Here:
22.9%New Jersey:
33.2%