Weston, FL (Florida) Houses and Residents
Estimated median house or condo value in 2022: $667,300 (it was $186,800 in 2000 )
Weston:
$667,300Florida:
$354,100
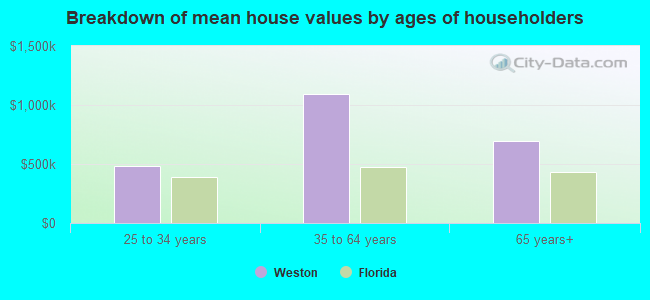
Lower value quartile - upper value quartile: $472,200 - $916,600Mean price in 2022: Detached houses: $937,785 Here:
$937,785State:
$500,941
Townhouses or other attached units: $480,024 Here:
$480,024State:
$370,869
In 3-to-4-unit structures: $627,646 Here:
$627,646State:
$309,944
In 5-or-more-unit structures: $273,207 Here:
$273,207State:
$447,145
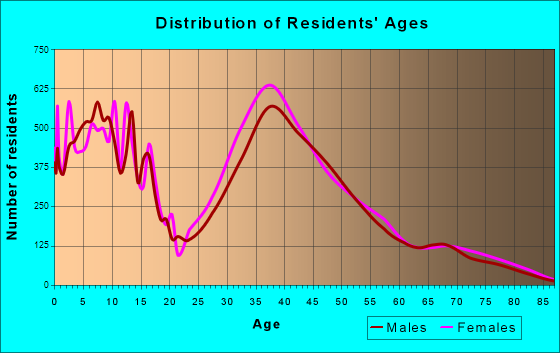
Total population: 69,100 (Urban population: 48,567, Rural population: 566 (all nonfarm) )
Houses: 21,458 (20,634 occupied: 14,244 owner occupied, 6,390 renter occupied )
% of renters here:
31%State:
33%
Housing density: 903 houses/condos per square mile
Median price asked for vacant for-sale houses and condos in 2022: $544,764.
Median contract rent in 2022: over $2,000 (lower quartile is over $2,000, upper quartile is over $2,000)
Median rent asked for vacant for-rent units in 2022: $2,423
Median gross rent in Weston, FL in 2022: over $2,000
Housing units in Weston with a mortgage: 9,580 (1,240 second mortgage, 0 home equity loan, 1,240 both second mortgage and home equity loan )Houses without a mortgage: 233
Median household income for houses/condos with a mortgage: $181,631
Median household income for apartments without a mortgage: $111,628
Median monthly housing costs: $2,662
Data:
Median house or condo value ($)
Median house or condo value ($ change since 2000)
Median house or condo value ($) - White
Median house or condo value ($) - Black or African American
Median house or condo value ($) - Asian
Median house or condo value ($) - Hispanic or Latino
Median house or condo value ($) - American Indian and Alaska Native
Median house or condo value ($) - Multirace
Median house or condo value ($) - Other Race
Median price asked for mobile homes ($)
Household density (households per square mile)
Mean house or condo value by units in structure - 1, detached ($)
Mean house or condo value by units in structure - 1, attached ($)
Mean house or condo value by units in structure - 2 ($)
Mean house or condo value by units in structure by units in structure - 3 or 4 ($)
Mean house or condo value by units in structure - 5 or more ($)
Mean house or condo value by units in structure - Boat, RV, van, etc. ($)
Mean house or condo value by units in structure - Mobile home ($)
Median contract rent ($)
Median contract rent - Lower quartile ($)
Median contract rent - Upper quartile ($)
Median gross rent ($)
Urban houses (%)
Rural houses (%)
Houses occupied (%)
Houses occupied (% change since 2000)
Houses owner occupied (%)
Houses owner occupied (% change since 2000)
Houses renter occupied (%)
Houses renter occupied (% change since 2000)
Vacant housing units - For rent (%)
Vacant housing units - For rent (% change since 2000)
Vacant housing units - For sale only (%)
Vacant housing units - For sale only (% change since 2000)
Vacant housing units - Rented or sold, not occupied (%)
Vacant housing units - Rented or sold, not occupied (% change since 2000)
Vacant housing units - For seasonal, recreational, or occasional use (%)
Vacant housing units - For seasonal, recreational, or occasional use (% change since 2000)
Vacant housing units - For migrant workers (%)
Vacant housing units - For migrant workers (% change since 2000)
Vacant housing units - Other vacant (%)
Vacant housing units - Other vacant (% change since 2000)
Median monthly housing costs ($)
Median household income for houses/condos with a mortgage ($)
Median household income for houses/condos without a mortgage ($)
Median household income ($)
Median household income ($) - White
Median household income ($) - Black or African American
Median household income ($) - Asian
Median household income ($) - Hispanic or Latino
Median household income ($) - American Indian and Alaska Native
Median household income ($) - Multirace
Median household income ($) - Other Race
Mortgage status - with mortgage (%)
Mortgage status - with second mortgage (%)
Mortgage status - with home equity loan (%)
Mortgage status - with both second mortgage and home equity loan (%)
Mortgage status - without a mortgage (%)
Median year house/condo built
Median year apartment built
Household type by relationship - Male householder living alone (%)
Household type by relationship - Male householder not living alone (%)
Household type by relationship - Female householder living alone (%)
Household type by relationship - Female householder not living alone (%)
Household type by relationship - Opposite-Sex spouse (%)
Household type by relationship - Same-Sex spouse (%)
Household type by relationship - Opposite-Sex unmarried partner (%)
Household type by relationship - Same-Sex unmarried partner (%)
Household type by relationship - In group quarters (%)
Size of family households - 2-person household (%)
Size of family households - 3-person household (%)
Size of family households - 4-person household (%)
Size of family households - 5-person household (%)
Size of family households - 6-person household (%)
Size of family households - 7-or-more-person household (%)
Size of nonfamily households - 1-person household (%)
Size of nonfamily households - 2-person household (%)
Size of nonfamily households - 3-person household (%)
Size of nonfamily households - 4-person household (%)
Size of nonfamily households - 5-person household (%)
Size of nonfamily households - 6-person household (%)
Size of nonfamily households - 7-or-moreperson household (%)
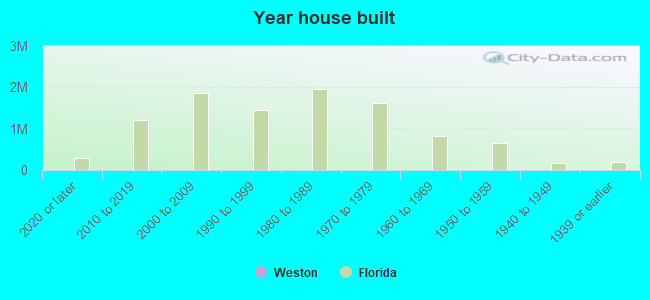
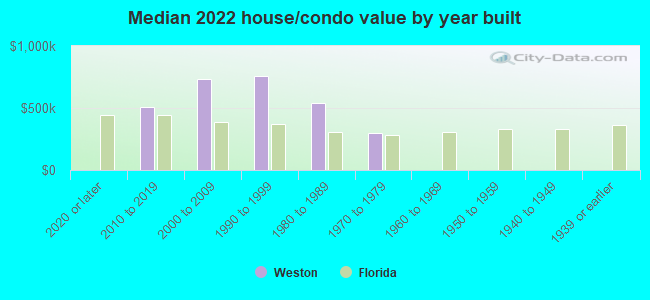
Year house built - Built 2010 or later (%)
Year house built - Built 2000 to 2009 (%)
Year house built - Built 1990 to 1999 (%)
Year house built - Built 1980 to 1989 (%)
Year house built - Built 1970 to 1979 (%)
Year house built - Built 1960 to 1969 (%)
Year house built - Built 1950 to 1959 (%)
Year house built - Built 1940 to 1949 (%)
Year house built - Built 1939 or earlier (%)
Median number of rooms in houses and condos
Median number of rooms in apartments
Median number of bedrooms in owner occupied houses
Mean number of bedrooms in owner occupied houses
Median number of bedrooms in renter occupied houses
Mean number of bedrooms in renter occupied houses
Median number of vehichles in owner occupied houses
Mean number of vehichles in owner occupied houses
Median number of vehichles in renter occupied houses
Mean number of vehichles in renter occupied houses
Rooms in owner-occupied houses - 1 room (%)
Rooms in owner-occupied houses - 2 rooms (%)
Rooms in owner-occupied houses - 3 rooms (%)
Rooms in owner-occupied houses - 4 rooms (%)
Rooms in owner-occupied houses - 5 rooms (%)
Rooms in owner-occupied houses - 6 rooms (%)
Rooms in owner-occupied houses - 7 rooms (%)
Rooms in owner-occupied houses - 8 rooms (%)
Rooms in owner-occupied houses - 9+ rooms (%)
Rooms in renter-occupied houses - 1 room (%)
Rooms in renter-occupied houses - 2 rooms (%)
Rooms in renter-occupied houses - 3 rooms (%)
Rooms in renter-occupied houses - 4 rooms (%)
Rooms in renter-occupied houses - 5 rooms (%)
Rooms in renter-occupied houses - 6 rooms (%)
Rooms in renter-occupied houses - 7 rooms (%)
Rooms in renter-occupied houses - 8 rooms (%)
Rooms in renter-occupied houses - 9+ rooms (%)
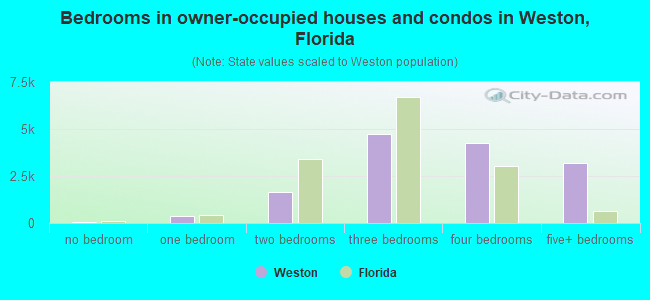
Bedrooms in owner-occupied houses - no bedrooms (%)
Bedrooms in owner-occupied houses - 1 bedroom (%)
Bedrooms in owner-occupied houses - 2 bedrooms (%)
Bedrooms in owner-occupied houses - 3 bedrooms (%)
Bedrooms in owner-occupied houses - 4 bedrooms (%)
Bedrooms in owner-occupied houses - 5+ bedrooms (%)
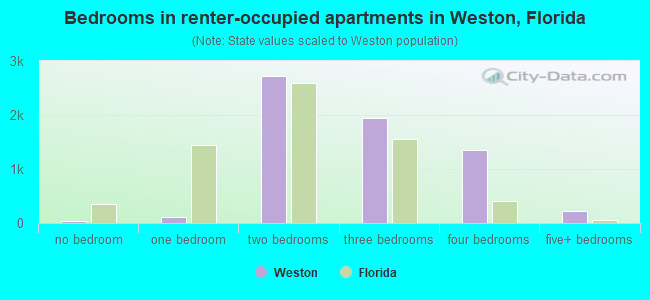
Bedrooms in renter-occupied houses - no bedrooms (%)
Bedrooms in renter-occupied houses - 1 bedroom (%)
Bedrooms in renter-occupied houses - 2 bedrooms (%)
Bedrooms in renter-occupied houses - 3 bedrooms (%)
Bedrooms in renter-occupied houses - 4 bedrooms (%)
Bedrooms in renter-occupied houses - 5+ bedrooms (%)
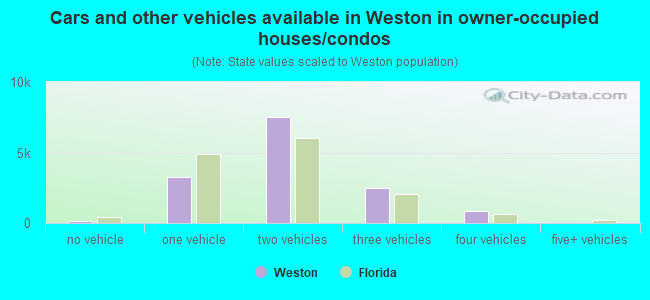
Vehicles available in owner-occupied houses - no vehicle available (%)
Vehicles available in owner-occupied houses - 1 vehicle available(%)
Vehicles available in owner-occupied houses - 2 Vehicles available (%)
Vehicles available in owner-occupied houses - 3 Vehicles available (%)
Vehicles available in owner-occupied houses - 4 Vehicles available (%)
Vehicles available in owner-occupied houses - 5+ Vehicles available (%)
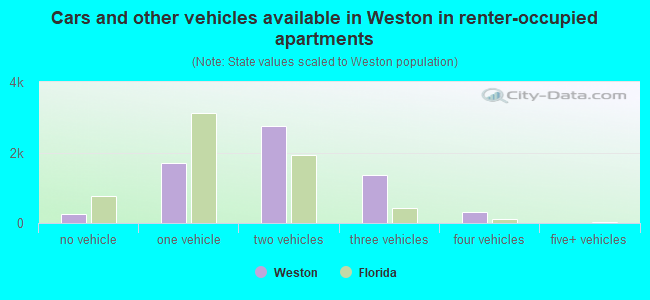
Vehicles available in renter-occupied houses - no vehicle available (%)
Vehicles available in renter-occupied houses - 1 vehicle available (%)
Vehicles available in renter-occupied houses - 2 Vehicles available (%)
Vehicles available in renter-occupied houses - 3 Vehicles available (%)
Vehicles available in renter-occupied houses - 4 Vehicles available (%)
Vehicles available in renter-occupied houses - 5+ Vehicles available (%)
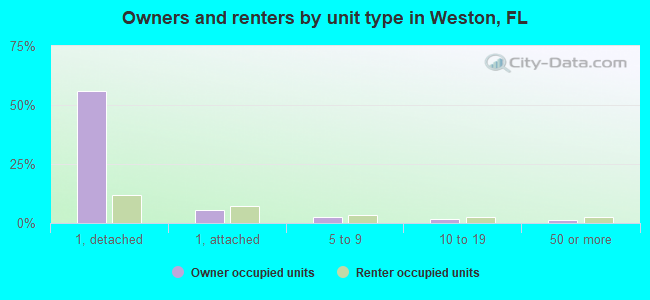
Housing units in structures - 1, detached (%)
Housing units in structures - 1, attached (%)
Housing units in structures - 2 (%)
Housing units in structures - 3 or 4 (%)
Housing units in structures - 5 to 9 (%)
Housing units in structures - 10 to 19 (%)
Housing units in structures - 20 to 49 (%)
Housing units in structures - 50 or more (%)
Housing units in structures - Mobile home (%)
Housing units in structures - Boat, RV, van, etc. (%)
Housing units in structures - Owners - 1, detached (%)
Housing units in structures - Owners - 1, attached (%)
Housing units in structures - Owners - 2 (%)
Housing units in structures - Owners - 3 or 4 (%)
Housing units in structures - Owners - 5 to 9 (%)
Housing units in structures - Owners - 10 to 19 (%)
Housing units in structures - Owners - 20 to 49 (%)
Housing units in structures - Owners - 50 or more (%)
Housing units in structures - Owners - Mobile home (%)
Housing units in structures - Owners - Boat, RV, van, etc. (%)
Housing units in structures - Renters - 1, detached (%)
Housing units in structures - Renters - 1, attached (%)
Housing units in structures - Renters - 2 (%)
Housing units in structures - Renters - 3 or 4 (%)
Housing units in structures - Renters - 5 to 9 (%)
Housing units in structures - Renters - 10 to 19 (%)
Housing units in structures - Renters - 20 to 49 (%)
Housing units in structures - Renters - 50 or more (%)
Housing units in structures - Renters - Mobile home (%)
Housing units in structures - Renters - Boat, RV, van, etc. (%)
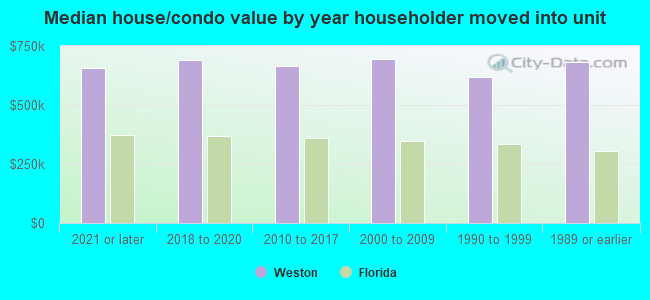
House/condo owner moved in on average (years ago)
Renter moved in on average (years ago)
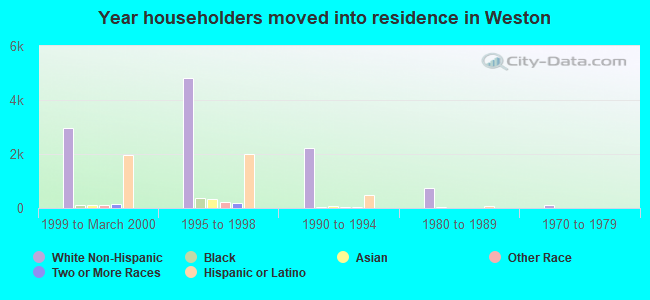
Year householder moved into unit - Moved in 1999 to March 2000 (%)
Year householder moved into unit - Moved in 1999 to March 2000 (%) - White
Year householder moved into unit - Moved in 1999 to March 2000 (%) - Black or African American
Year householder moved into unit - Moved in 1999 to March 2000 (%) - Asian
Year householder moved into unit - Moved in 1999 to March 2000 (%) - Hispanic or Latino
Year householder moved into unit - Moved in 1999 to March 2000 (%) - American Indian and Alaska Native
Year householder moved into unit - Moved in 1999 to March 2000 (%) - Multirace
Year householder moved into unit - Moved in 1999 to March 2000 (%) - Other Race
Year householder moved into unit - Moved in 1995 to 1998 (%)
Year householder moved into unit - Moved in 1995 to 1998 (%) - White
Year householder moved into unit - Moved in 1995 to 1998 (%) - Black or African American
Year householder moved into unit - Moved in 1995 to 1998 (%) - Asian
Year householder moved into unit - Moved in 1995 to 1998 (%) - Hispanic or Latino
Year householder moved into unit - Moved in 1995 to 1998 (%) - American Indian and Alaska Native
Year householder moved into unit - Moved in 1995 to 1998 (%) - Multirace
Year householder moved into unit - Moved in 1995 to 1998 (%) - Other Race
Year householder moved into unit - Moved in 1990 to 1994 (%)
Year householder moved into unit - Moved in 1990 to 1994 (%) - White
Year householder moved into unit - Moved in 1990 to 1994 (%) - Black or African American
Year householder moved into unit - Moved in 1990 to 1994 (%) - Asian
Year householder moved into unit - Moved in 1990 to 1994 (%) - Hispanic or Latino
Year householder moved into unit - Moved in 1990 to 1994 (%) - American Indian and Alaska Native
Year householder moved into unit - Moved in 1990 to 1994 (%) - Multirace
Year householder moved into unit - Moved in 1990 to 1994 (%) - Other Race
Year householder moved into unit - Moved in 1980 to 1989 (%)
Year householder moved into unit - Moved in 1980 to 1989 (%) - White
Year householder moved into unit - Moved in 1980 to 1989 (%) - Black or African American
Year householder moved into unit - Moved in 1980 to 1989 (%) - Asian
Year householder moved into unit - Moved in 1980 to 1989 (%) - Hispanic or Latino
Year householder moved into unit - Moved in 1980 to 1989 (%) - American Indian and Alaska Native
Year householder moved into unit - Moved in 1980 to 1989 (%) - Multirace
Year householder moved into unit - Moved in 1980 to 1989 (%) - Other Race
Year householder moved into unit - Moved in 1970 to 1979 (%)
Year householder moved into unit - Moved in 1970 to 1979 (%) - White
Year householder moved into unit - Moved in 1970 to 1979 (%) - Black or African American
Year householder moved into unit - Moved in 1970 to 1979 (%) - Asian
Year householder moved into unit - Moved in 1970 to 1979 (%) - Hispanic or Latino
Year householder moved into unit - Moved in 1970 to 1979 (%) - American Indian and Alaska Native
Year householder moved into unit - Moved in 1970 to 1979 (%) - Multirace
Year householder moved into unit - Moved in 1970 to 1979 (%) - Other Race
Year householder moved into unit - Moved in 1969 or earlier (%)
Year householder moved into unit - Moved in 1969 or earlier (%) - White
Year householder moved into unit - Moved in 1969 or earlier (%) - Black or African American
Year householder moved into unit - Moved in 1969 or earlier (%) - Asian
Year householder moved into unit - Moved in 1969 or earlier (%) - Hispanic or Latino
Year householder moved into unit - Moved in 1969 or earlier (%) - American Indian and Alaska Native
Year householder moved into unit - Moved in 1969 or earlier (%) - Multirace
Year householder moved into unit - Moved in 1969 or earlier (%) - Other Race
Housing units lacking complete plumbing facilities (%)
Housing units lacking complete kitchen facilities (%)
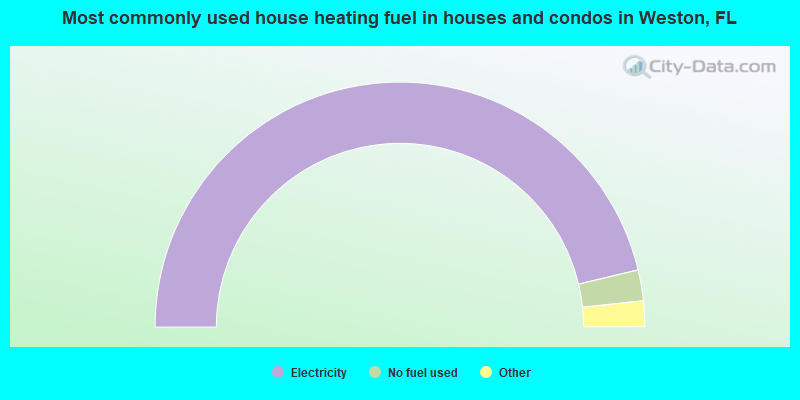
House heating fuel used in houses and condos - Utility gas (%)
House heating fuel used in houses and condos - Bottled, tank, or LP gas (%)
House heating fuel used in houses and condos - Electricity (%)
House heating fuel used in houses and condos - Fuel oil, kerosene, etc. (%)
House heating fuel used in houses and condos - Coal or coke (%)
House heating fuel used in houses and condos - Wood (%)
House heating fuel used in houses and condos - Solar energy (%)
House heating fuel used in houses and condos - Other fuel (%)
House heating fuel used in houses and condos - No fuel used (%)
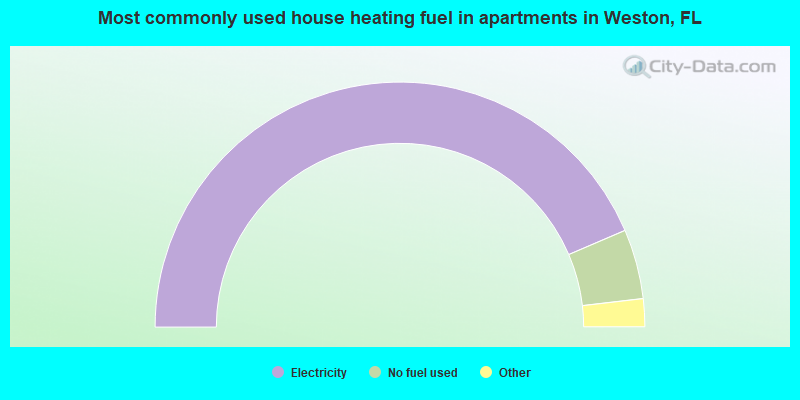
House heating fuel used in apartments - Utility gas (%)
House heating fuel used in apartments - Bottled, tank, or LP gas (%)
House heating fuel used in apartments - Electricity (%)
House heating fuel used in apartments - Fuel oil, kerosene, etc. (%)
House heating fuel used in apartments - Coal or coke (%)
House heating fuel used in apartments - Wood (%)
House heating fuel used in apartments - Solar energy (%)
House heating fuel used in apartments - Other fuel (%)
House heating fuel used in apartments - No fuel used (%)
Latest news about housing in Weston, FL collected exclusively by city-data.com from local newspapers, TV, and radio stations
Median year house/condo built: 1995Median year apartment built: 1996Household type by relationship:
Households: 67,676
Male householders: 12,148 (555 living alone ), Female householders: 8,486 (948 living alone )15,751 spouses (15,751 opposite-sex spouses ), 709 unmarried partners , (709 opposite-sex unmarried partners ), 26,162 children (25,473 natural , 368 adopted , 321 stepchildren ), 653 grandchildren , 291 brothers or sisters , 2,408 parents , 0 foster children , 824 other relatives , 244 non-relatives
Size of family households: 5,066 2-persons , 3,609 3-persons , 7,553 4-persons , 2,113 5-persons , 219 6-persons , 225 7-or-more-persons .
Size of nonfamily households: 1,503 1-person , 327 2-persons , 19 4-persons .
15,802 married couples with children. single-parent households (703 men , 1,870 women ).
31.9% of residents of Weston speak English at home. of residents speak Spanish at home (67% speak English very well , 20% speak English well , 10% speak English not well , 3% don't speak English at all ).of residents speak other Indo-European language at home (77% speak English very well , 17% speak English well , 4% speak English not well , 2% don't speak English at all ).of residents speak Asian or Pacific Island language at home (69% speak English very well , 16% speak English well , 5% speak English not well , 10% don't speak English at all ).of residents speak other language at home (91% speak English very well , 7% speak English well , 2% speak English not well ).
Foreign born population: 38,674 (57.1%)of them are naturalized citizens )
Median number of rooms in houses and condos:
Median number of rooms in apartments
Owner-occupied Renter-occupied
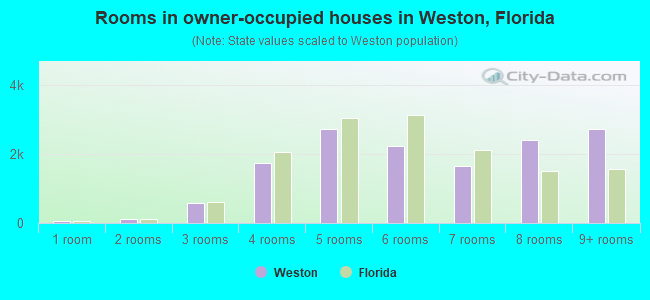
Rooms in owner-occupied houses in Weston, Florida
51 1 room 122 2 rooms 589 3 rooms 1,738 4 rooms 2,723 5 rooms 2,231 6 rooms 1,663 7 rooms 2,412 8 rooms 2,715 9+ rooms
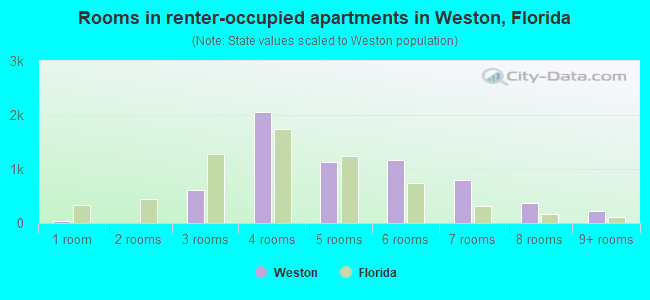
Rooms in renter-occupied apartments in Weston, Florida
44 1 room 0 2 rooms 607 3 rooms 2,054 4 rooms 1,129 5 rooms 1,174 6 rooms 790 7 rooms 374 8 rooms 218 9+ rooms
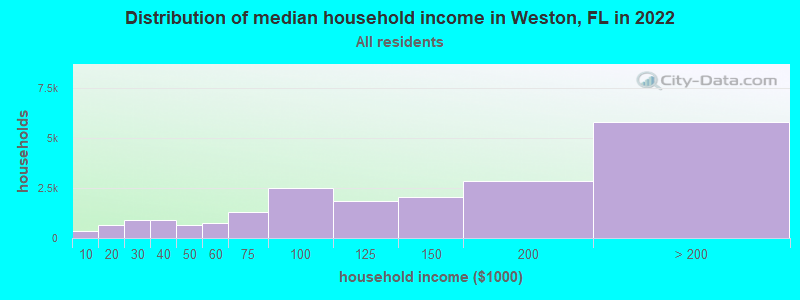
Weston, FL household income distribution 373 Less than $10,000667 $10,000 to $19,999912 $20,000 to $29,999905 $30,000 to $39,999629 $40,000 to $49,999758 $50,000 to $59,9991,292 $60,000 to $74,9992,527 $75,000 to $99,9991,862 $100,000 to $124,9992,054 $125,000 to $149,9992,850 $150,000 to $199,9995,805 $200,000 or more
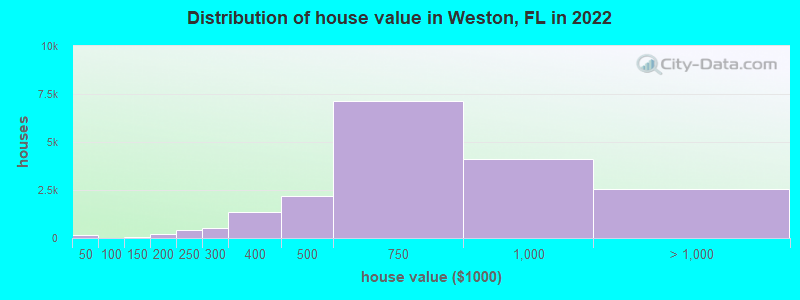
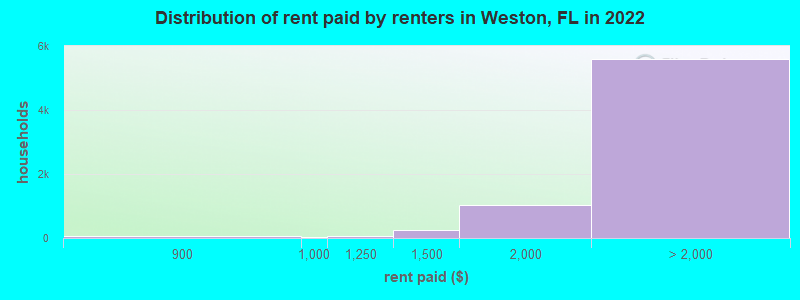
Home value of owner - occupied houses in 2022 in Weston, FL 141 Less than $10,0003 $10,000 to $14,99949 $125,000 to $149,999122 $150,000 to $174,99964 $175,000 to $199,999408 $200,000 to $249,999500 $250,000 to $299,9991,365 $300,000 to $399,9992,181 $400,000 to $499,9997,146 $500,000 to $749,9994,116 $750,000 to $999,9991,774 $1,000,000 to $1,499,999310 $1,500,000 to $1,999,999456 $2,000,000 or moreRent paid by renters in 2022 in Weston, FL 43 $600 to $64954 $800 to $89928 $900 to $99966 $1,000 to $1,249255 $1,250 to $1,4991,043 $1,500 to $1,9991,839 $2,000 to $2,4991,785 $2,500 to $2,999988 $3,000 to $3,499874 $3,500 or more114 No cash rent
Percentage of workers working in this county: 80.9%Number of people working at home: 8,810 (27.2% of all workers )
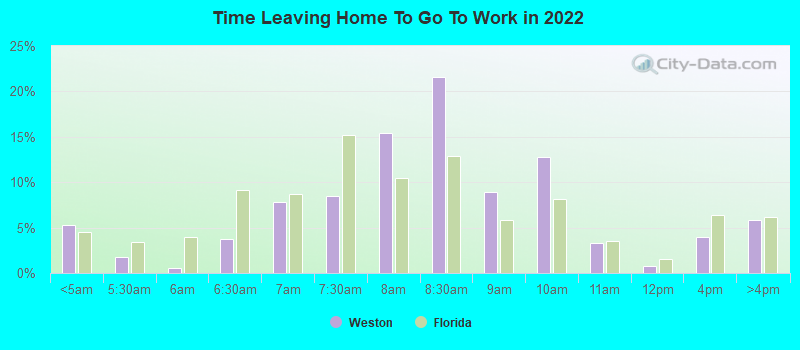
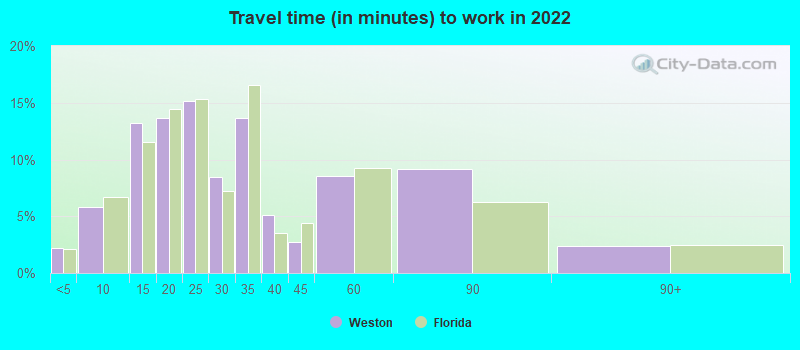
Travel time to work (commute)
Less than 5 minutes: 7405 to 9 minutes: 73410 to 14 minutes: 2,85915 to 19 minutes: 3,73820 to 24 minutes: 3,28025 to 29 minutes: 2,05030 to 34 minutes: 4,54035 to 39 minutes: 1,38340 to 44 minutes: 1,08245 to 59 minutes: 1,73860 to 89 minutes: 1,37990 or more minutes: 973
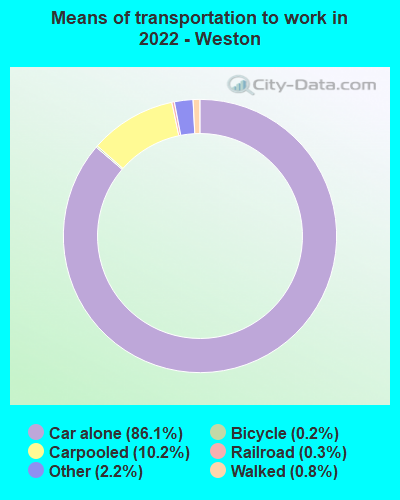
Means of transportation to work:
Drove a car alone: 18,581 (62.6%)Carpooled: 2,503 (8.4%)Bus : 22 (0.1%)Light rail, streetcar or trolley : 57 (0.2%)Taxi: 515 (1.7%)Bicycle: 58 (0.2%)Walked: 213 (0.7%)Worked at home: 8,810 (29.7%)
Unemployment by race in 2022
Unemployment rate for White non-Hispanic residents 1.9% Males1.5% FemalesUnemployment rate for Black residents 15.8% Males14.6% FemalesUnemployment rate for Asian residents 5.5% Males0.8% FemalesUnemployment rate for other race residents 1.0% Males0.6% FemalesUnemployment rate for two or more race residents 4.4% FemalesUnemployment rate for Hispanic or Latino residents 1.1% Males3.9% Females
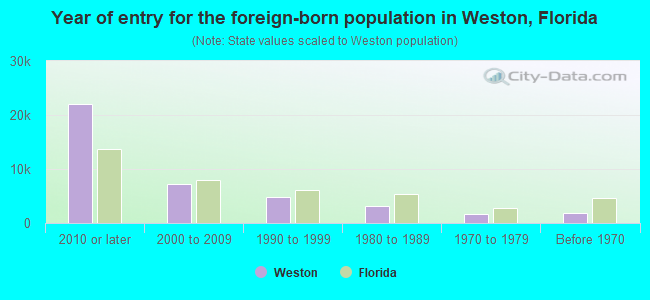
Year of entry for the foreign-born population in Weston, Florida
21,987 2010 or later 7,293 2000 to 2009 4,737 1990 to 1999 3,092 1980 to 1989 1,680 1970 to 1979 1,935 Before 1970
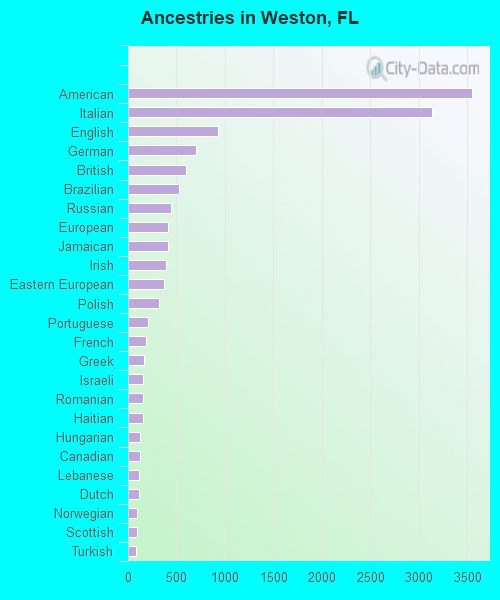
First ancestries reported:
American: 3,546 (7.7%)
Italian: 3,134 (6.8%)
English: 930 (2.0%)
German: 697 (1.5%)
British: 601 (1.3%)
Brazilian: 525 (1.1%)
Russian: 447 (1.0%)
European: 416 (0.9%)
Jamaican: 412 (0.9%)
Irish: 395 (0.9%)
Eastern European: 376 (0.8%)
Polish: 319 (0.7%)
Portuguese: 210 (0.5%)
French: 181 (0.4%)
Greek: 163 (0.4%)
Israeli: 156 (0.3%)
Romanian: 156 (0.3%)
Haitian: 154 (0.3%)
Hungarian: 124 (0.3%)
Canadian: 124 (0.3%)
Lebanese: 116 (0.3%)
Dutch: 109 (0.2%)
Norwegian: 89 (0.2%)
Scottish: 89 (0.2%)
Turkish: 78 (0.2%)
Austrian: 73 (0.2%)
Czech: 60 (0.1%)
Belgian: 48 (0.1%)
Scandinavian: 46 (0.10%)
Iranian: 44 (0.10%)
Guyanese: 39 (0.08%)
Scotch-Irish: 39 (0.08%)
Slovak: 37 (0.08%)
West Indian: 37 (0.08%)
Armenian: 30 (0.06%)
Lithuanian: 30 (0.06%)
Swedish: 29 (0.06%)
Nigerian: 27 (0.06%)
Ukrainian: 27 (0.06%)
Egyptian: 26 (0.06%)
African: 25 (0.05%)
Bulgarian: 24 (0.05%)
Trinidadian and Tobagonian: 15 (0.03%)
Basque: 14 (0.03%)
Macedonian: 9 (0.02%)
Yugoslavian: 9 (0.02%)
Danish: 5 (0.01%)
Most common places of birth for foreign-born residents (%): Venezuela Weston:
31.3% (11,646)Florida:
5.7% (262,042)
Colombia Weston:
17.6% (6,556)Florida:
6.5% (298,669)
Brazil Weston:
6.2% (2,302)Florida:
2.7% (122,906)
Argentina Weston:
5.3% (1,976)Florida:
1.3% (57,263)
Cuba Weston:
4.8% (1,773)Florida:
22.0% (1,006,576)
India Weston:
4.0% (1,499)Florida:
2.1% (94,349)
Peru Weston:
3.2% (1,195)Florida:
2.1% (96,693)
Chile Weston:
2.6% (977)Florida:
0.5% (22,715)
Mexico Weston:
2.4% (886)Florida:
5.6% (257,152)
Dominican Republic Weston:
2.3% (854)Florida:
3.0% (137,727)
China, excluding Hong Kong and Taiwan Weston:
2.1% (776)Florida:
1.2% (56,071)
United Kingdom, excluding England and Scotland Weston:
1.8% (680)Florida:
0.7% (34,227)
Other South America Weston:
1.7% (621)Florida:
0.1% (6,700)
Jamaica Weston:
1.6% (603)Florida:
5.0% (227,319)
Ecuador Weston:
1.5% (563)Florida:
1.2% (54,585)
Place of birth for U.S.-born residents:
This state: 15,805Other state: 10,261Northeast: 5,972Midwest: 1,978South: 1,747West: 564 88.7% of Weston residents lived in the same house 1 years ago.
Out of people who lived in different houses, 39.0% lived in this county.
Out of people who lived in different counties, 70.2% lived in Florida.
Weston:
88.7%State average:
86.3%
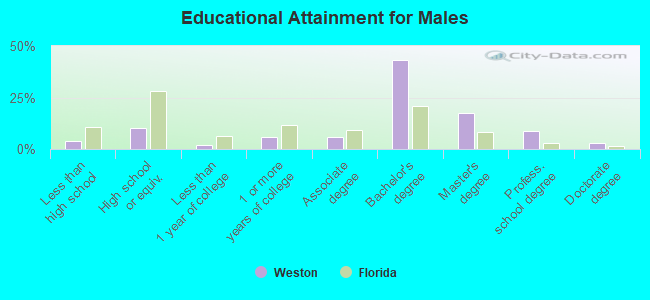
Education attainment for males 25 years and older:
No schooling: 315Nursery to 4th grade: 05th and 6th grade: 07th and 8th grade: 809th grade: 21110th grade: 011th grade: 012th grade, no diploma: 219High school graduate (or equivalency): 2,012Less than 1 year of college: 421Some college more than 1 year, no degree: 1,160Associate degree: 1,194Bachelor's degree: 8,759Master's degree: 3,486Professional school degree: 1,786Doctorate degree: 549
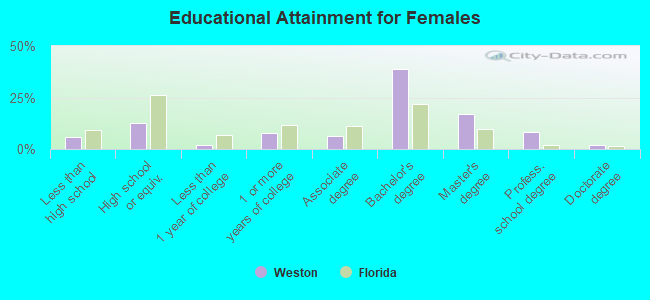
Education attainment for females 25 years and older:
No schooling: 450Nursery to 4th grade: 1345th and 6th grade: 07th and 8th grade: 2189th grade: 010th grade: 3511th grade: 4512th grade, no diploma: 363High school graduate (or equivalency): 2,688Less than 1 year of college: 424Some college more than 1 year, no degree: 1,672Associate degree: 1,317Bachelor's degree: 8,322Master's degree: 3,680Professional school degree: 1,773Doctorate degree: 389
Housing units in structures:
One, detached: 13,750One, attached: 2,6413 or 4: 1015 to 9: 1,28210 to 19: 1,27120 to 49: 1,11550 or more: 1,298Housing units lacking complete plumbing facilities in 2022: 0.4%Housing units lacking complete kitchen facilities in 2022: 0.2%House/condo owner moved in on average 9 years ago
Renter moved in on average 3 years ago
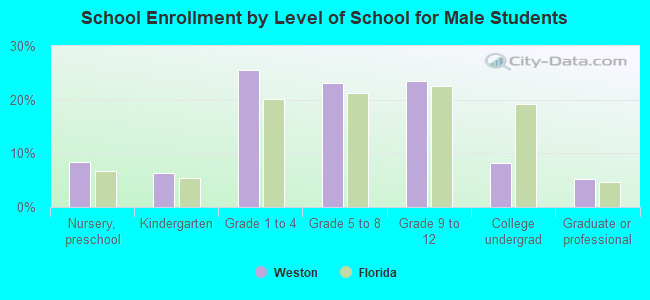
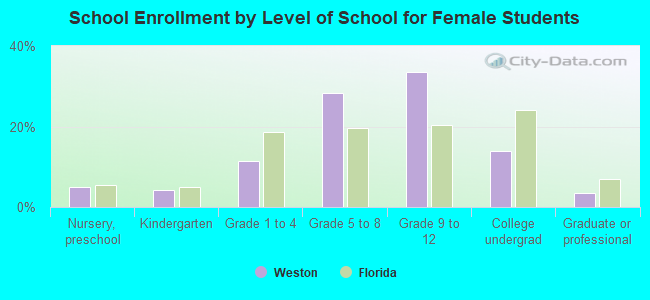
Private vs. public school enrollment:
Students in private schools in grades 1 to 8 (elementary and middle school): 562 Students in private schools in grades 9 to 12 (high school): 702 Students in private undergraduate colleges: 439