Housing density: 4,059 houses/condos per square mile
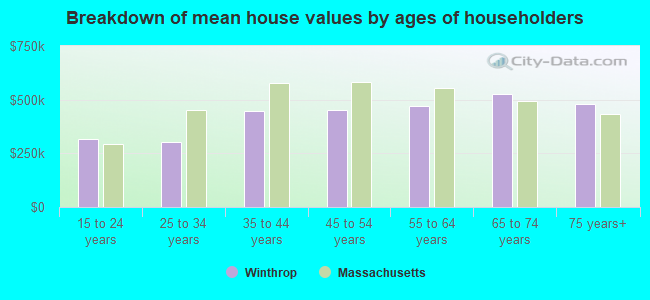
Median price asked for vacant for-sale houses and condos in 2022 in this county: $245,554.
Median contract rent in 2022: $1,871 (lower quartile is $1,262, upper quartile is over $2,000)
Median rent asked for vacant for-rent units in 2022: $2,190
Median gross rent in Winthrop, MA in 2022: over $2,000
Housing units in Winthrop with a mortgage: 1,453 (121 second mortgage, 235 home equity loan, 0 both second mortgage and home equity loan) Houses without a mortgage: 799
In family households: 455,536 (70,443 male householders, 69,969 female householders)
79,454 spouses, 164,826 children (157,871 natural, 3,242 adopted, 3,713 stepchildren), 12,689 grandchildren, 13,066 brothers or sisters, 8,278 parents, foster children, 14,402 other relatives, 18,751 non-relatives
In nonfamily households: 219,259 (72,530 male householders (47,704 living alone)), 79,825 female householders (58,687 living alone)), 66,904 nonrelatives
In group quarters: 47,228 (7,495 institutionalized population)
66,402 married couples with children.
54,149 single-parent households (6,613 men, 47,536 women).
87.1% of residents of Winthrop speak English at home.
3.6% of residents speak Spanish at home (63% speak English very well, 19% speak English well, 13% speak English not well, 5% don't speak English at all).
7.8% of residents speak other Indo-European language at home (71% speak English very well, 19% speak English well, 8% speak English not well, 2% don't speak English at all).
0.7% of residents speak Asian or Pacific Island language at home (50% speak English very well, 37% speak English well, 12% speak English not well).
0.8% of residents speak other language at home (73% speak English very well, 11% speak English well, 7% speak English not well, 9% don't speak English at all).
Foreign born population: 2,047 (10.1%)
(59.4% of them are naturalized citizens)
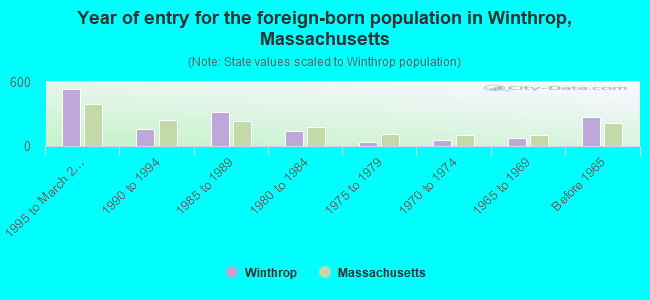
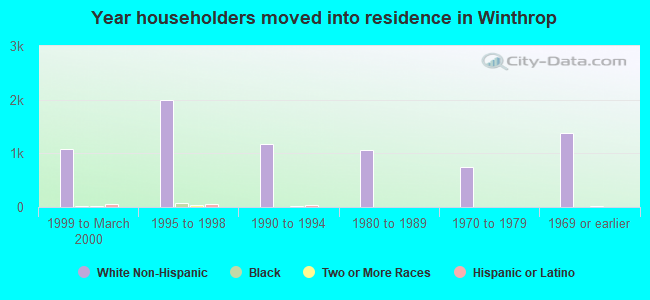
Year of entry for the foreign-born population in Winthrop, Massachusetts
5311995 to March 2000
1591990 to 1994
3171985 to 1989
1381980 to 1984
381975 to 1979
571970 to 1974
711965 to 1969
274Before 1965
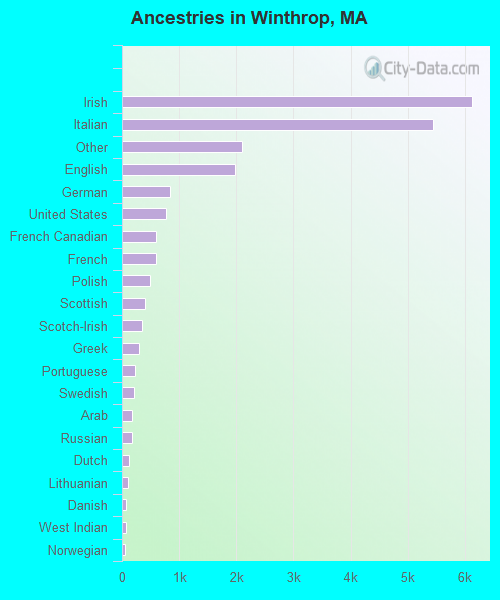
First ancestries reported:
Irish: 6,117 (28.6%)
Italian: 5,439 (25.4%)
Other: 2,100 (9.8%)
English: 1,974 (9.2%)
German: 845 (3.9%)
United States: 767 (3.6%)
French Canadian: 603 (2.8%)
French: 595 (2.8%)
Polish: 482 (2.3%)
Scottish: 397 (1.9%)
Scotch-Irish: 347 (1.6%)
Greek: 290 (1.4%)
Portuguese: 233 (1.1%)
Swedish: 211 (1.0%)
Arab: 183 (0.9%)
Russian: 173 (0.8%)
Dutch: 126 (0.6%)
Lithuanian: 104 (0.5%)
Danish: 67 (0.3%)
West Indian: 64 (0.3%)
Norwegian: 59 (0.3%)
Subsaharan African: 55 (0.3%)
Hungarian: 48 (0.2%)
Ukrainian: 39 (0.2%)
Swiss: 36 (0.2%)
Welsh: 21 (0.10%)
Slovak: 19 (0.09%)
Most common places of birth for foreign-born residents (%):
Other Eastern Europe
Winthrop:
13.3% (211)
Massachusetts:
1.6% (12,350)
Brazil
Winthrop:
11.7% (186)
Massachusetts:
4.7% (36,669)
Italy
Winthrop:
10.5% (166)
Massachusetts:
3.7% (28,319)
Canada
Winthrop:
7.4% (118)
Massachusetts:
5.2% (40,247)
Colombia
Winthrop:
5.7% (90)
Massachusetts:
2.0% (15,286)
Guatemala
Winthrop:
5.2% (82)
Massachusetts:
1.7% (12,868)
United Kingdom
Winthrop:
4.5% (72)
Massachusetts:
3.3% (25,403)
Ireland
Winthrop:
3.4% (54)
Massachusetts:
2.3% (17,987)
Dominican Republic
Winthrop:
3.2% (51)
Massachusetts:
6.0% (46,744)
Korea
Winthrop:
2.8% (45)
Massachusetts:
1.7% (13,456)
Philippines
Winthrop:
2.8% (44)
Massachusetts:
1.0% (7,414)
Other Northern Africa
Winthrop:
2.3% (36)
Massachusetts:
0.5% (3,810)
Germany
Winthrop:
2.1% (34)
Massachusetts:
1.9% (14,883)
India
Winthrop:
2.1% (33)
Massachusetts:
3.6% (28,086)
Other Caribbean
Winthrop:
1.7% (27)
Massachusetts:
0.6% (4,539)
France
Winthrop:
1.6% (25)
Massachusetts:
0.8% (5,895)
Greece
Winthrop:
1.6% (25)
Massachusetts:
1.7% (12,975)
Place of birth for U.S.-born residents:
This state: 14,659
Other state: 1,878
Northeast: 1,069
Midwest: 198
South: 313
West: 298
65% of Winthrop residents lived in the same house 5 years ago. Out of people who lived in different houses, 68% lived in this county. Out of people who lived in different counties, 48% lived in Massachusetts.
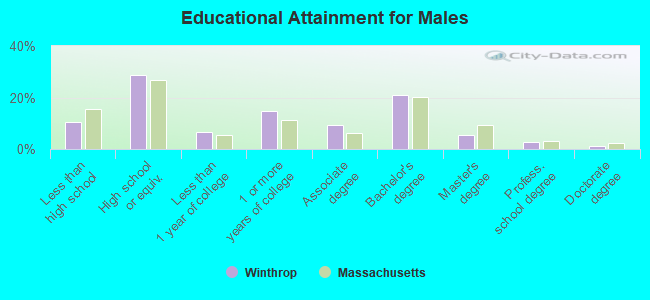
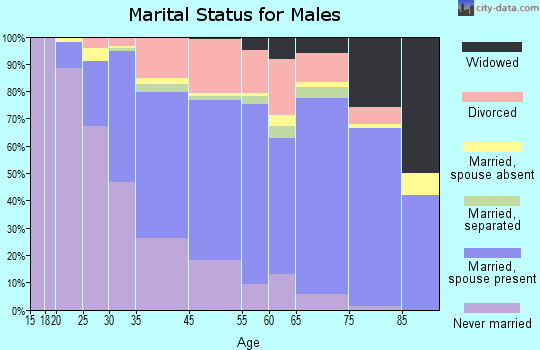
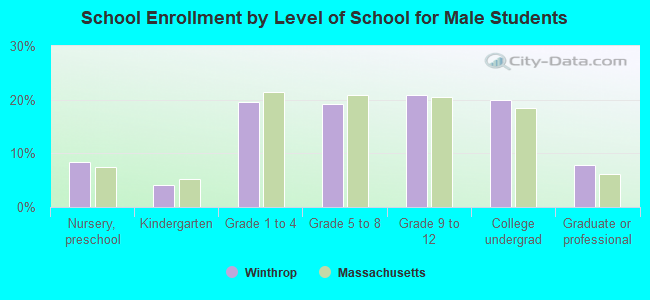
Education attainment for males 25 years and older:
No schooling: 19
Nursery to 4th grade: 14
5th and 6th grade: 19
7th and 8th grade: 80
9th grade: 121
10th grade: 82
11th grade: 83
12th grade, no diploma: 249
High school graduate (or equivalency): 1,813
Less than 1 year of college: 405
Some college more than 1 year, no degree: 926
Associate degree: 595
Bachelor's degree: 1,333
Master's degree: 347
Professional school degree: 161
Doctorate degree: 73
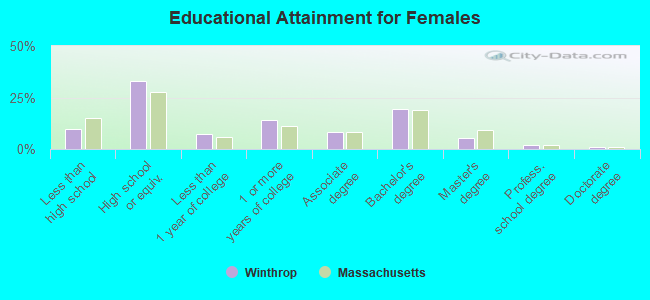
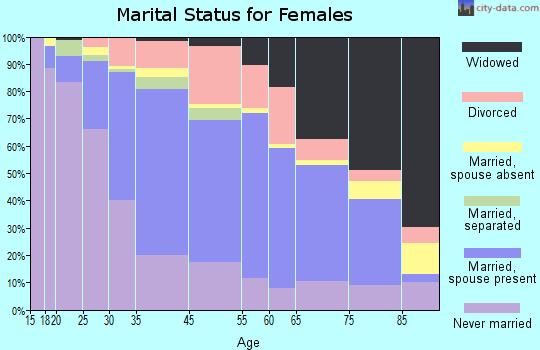
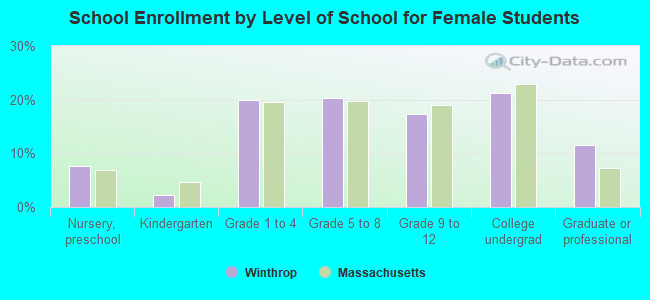
Education attainment for females 25 years and older:
No schooling: 49
Nursery to 4th grade: 7
5th and 6th grade: 47
7th and 8th grade: 82
9th grade: 45
10th grade: 89
11th grade: 117
12th grade, no diploma: 260
High school graduate (or equivalency): 2,421
Less than 1 year of college: 533
Some college more than 1 year, no degree: 1,017
Associate degree: 591
Bachelor's degree: 1,419
Master's degree: 405
Professional school degree: 154
Doctorate degree: 54
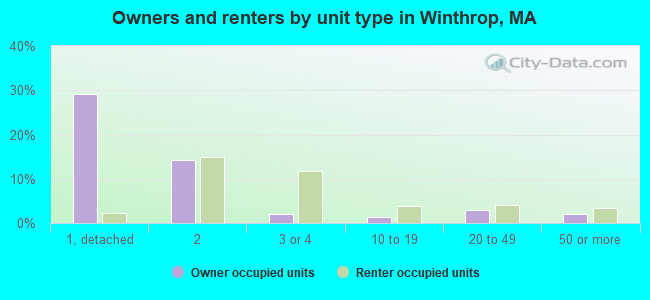
Housing units in structures:
One, detached: 2,527
One, attached: 140
Two: 2,380
3 or 4: 1,113
5 to 9: 473
10 to 19: 412
20 to 49: 584
50 or more: 438
Housing units lacking complete plumbing facilities: 0.4%
Housing units lacking complete kitchen facilities: 0.4%