Wynnedale, IN (Indiana) Houses and Residents
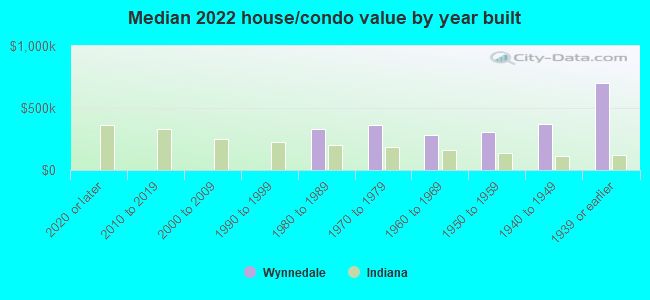
| Wynnedale: | $366,829 |
| Indiana: | $208,700 |
Mean price in 2022:
Detached houses: $465,237
Here: $465,237 State: $257,916
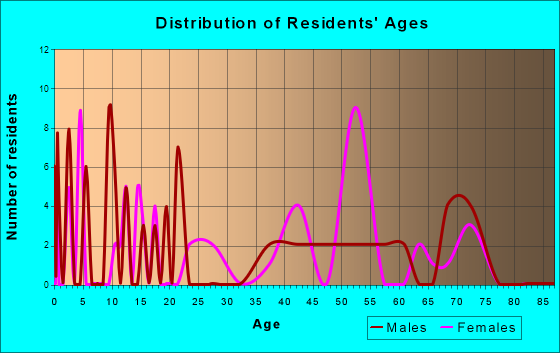
Total population: 238 (All urban)
Houses: 98 (91 occupied: 91 owner occupied, 2 renter occupied)
| % of renters here: | 2% |
| State: | 29% |
Housing density: 586 houses/condos per square mile
Median price asked for vacant for-sale houses and condos in 2022 in this county: $192,214.
Housing units in Wynnedale with a mortgage: 54 (8 second mortgage, 0 home equity loan, 9 both second mortgage and home equity loan)
Houses without a mortgage: 2
Median household income for houses/condos with a mortgage: $151,530
Median household income for apartments without a mortgage: $89,138
Median monthly housing costs: $1,393
Compare current foreclosures near Wynnedale, IN:
| Photo | Address | Area | Beds / Baths | Price | Details |
|---|---|---|---|---|---|

|
#1
W 13th St
Indianapolis, IN 46214
|
1,300 sq. feet
|
1 baths 3 beds |
$124,800
|
show details |

|
#2
Ruth Dr
Indianapolis, IN 46240
|
848 sq. feet
|
1 baths 2 beds |
$245,000
|
show details |

|
#3
Wallace Ave
Indianapolis, IN 46201
|
801 sq. feet
|
1 baths 2 beds |
$175,000
|
show details |

|
#4
Powell Rd
Indianapolis, IN 46221
|
1,100 sq. feet
|
1 baths 3 beds |
$289,900
|
show details |

|
#5
King Ave
Indianapolis, IN 46222
|
1,248 sq. feet
|
1 baths 4 beds |
show details | |

|
#6
Five Points Rd
Indianapolis, IN 46239
|
2,088 sq. feet
|
2 baths 3 beds |
show details | |

|
#7
Terrace Ave
Indianapolis, IN 46203
|
1,908 sq. feet
|
2 baths 4 beds |
show details | |

|
#8
N Gray St
Indianapolis, IN 46201
|
1,309 sq. feet
|
2 baths 3 beds |
show details | |

|
#9
Walnut Meadow Ct
Indianapolis, IN 46234
|
1,387 sq. feet
|
1 baths 3 beds |
show details | |

|
#10
S Tacoma Ave
Indianapolis, IN 46237
|
1,140 sq. feet
|
1 baths 3 beds |
show details |
| Photo | Address | Area | Beds / Baths | Price | Details |
|---|---|---|---|---|---|

|
#11
Black Antler Ct
Indianapolis, IN 46217
|
1,080 sq. feet
|
1 baths 2 beds |
show details | |

|
#12
Severn Ct
Greenwood, IN 46142
|
1,616 sq. feet
|
2 baths 3 beds |
show details | |

|
#13
Driftwood Dr
Carmel, IN 46033
|
5,308 sq. feet
|
4 baths 4 beds |
show details | |

|
#14
1st St NE
Carmel, IN 46032
|
1,172 sq. feet
|
1 baths 3 beds |
show details | |

|
#15
N Talbott St
Indianapolis, IN 46205
|
1,140 sq. feet
|
1 baths 2 beds |
show details | |

|
#16
Hillside Ave
Indianapolis, IN 46220
|
1,060 sq. feet
|
2 baths 3 beds |
show details | |

|
#17
Lippincott Way
Indianapolis, IN 46268
|
1,707 sq. feet
|
1 baths 4 beds |
show details | |

|
#18
Bromley Pl
Indianapolis, IN 46219
|
2,424 sq. feet
|
2 baths 3 beds |
show details | |

|
#19
E Hampton Dr
Indianapolis, IN 46226
|
1,296 sq. feet
|
1 baths 3 beds |
show details | |

|
#20
Denali Ct
Indianapolis, IN 46235
|
2,186 sq. feet
|
2 baths 3 beds |
show details |
| Photo | Address | Area | Beds / Baths | Price | Details |
|---|---|---|---|---|---|

|
#21
Carrie Dr
Indianapolis, IN 46237
|
1,294 sq. feet
|
1 baths 3 beds |
show details | |

|
#22
S Mcclure St
Indianapolis, IN 46241
|
968 sq. feet
|
1 baths 2 beds |
show details | |

|
#23
Lexington Ave
Indianapolis, IN 46203
|
1,736 sq. feet
|
4 baths 4 beds |
show details | |

|
#24
Hovey St
Indianapolis, IN 46218
|
1,425 sq. feet
|
1 baths 3 beds |
show details | |

|
#25
Pinetop Ct
Indianapolis, IN 46227
|
1,599 sq. feet
|
1 baths 3 beds |
show details | |

|
#26
Wallace Ave
Indianapolis, IN 46201
|
1,118 sq. feet
|
1 baths 3 beds |
show details | |

|
#27
Watercrest Way
Indianapolis, IN 46278
|
1,648 sq. feet
|
2 baths 3 beds |
show details | |

|
#28
Squire Ln
Pittsboro, IN 46167
|
3,148 sq. feet
|
2 baths 4 beds |
show details | |

|
#29
Kellum Dr
Indianapolis, IN 46221
|
1,618 sq. feet
|
2 baths 3 beds |
show details | |

|
#30
N Arsenal Ave
Indianapolis, IN 46218
|
1,330 sq. feet
|
- baths 3 beds |
show details |
| Photo | Address | Area | Beds / Baths | Price | Details |
|---|---|---|---|---|---|

|
#31
Birmingham Dr
Indianapolis, IN 46235
|
2,364 sq. feet
|
3 baths 4 beds |
show details | |

|
#32
Rock Island Ct
Indianapolis, IN 46217
|
1,102 sq. feet
|
2 baths 3 beds |
show details | |

|
#33
E Brunswick Ave
Indianapolis, IN 46227
|
1,056 sq. feet
|
1 baths 2 beds |
show details | |

|
#34
Copper Grove Dr
Indianapolis, IN 46237
|
1,618 sq. feet
|
1 baths 3 beds |
show details | |

|
#35
Melbourne Rd
Indianapolis, IN 46228
|
3,564 sq. feet
|
1 baths 4 beds |
show details | |

|
#36
Fullerton Dr
Indianapolis, IN 46214
|
1,904 sq. feet
|
2 baths 4 beds |
show details | |

|
#37
N Parker Ave
Indianapolis, IN 46201
|
1,114 sq. feet
|
1 baths 2 beds |
show details | |

|
#38
W Troy Ave
Indianapolis, IN 46241
|
1,176 sq. feet
|
2 baths 2 beds |
show details | |

|
#39
Aspen Dr
Fishers, IN 46037
|
1,872 sq. feet
|
3 baths 3 beds |
show details | |

|
#40
Adams St
Indianapolis, IN 46218
|
- sq. feet
|
1 baths 3 beds |
show details |
| Photo | Address | Area | Beds / Baths | Price | Details |
|---|---|---|---|---|---|

|
#41
Sergi Canyon Dr
Indianapolis, IN 46217
|
1,620 sq. feet
|
1 baths 3 beds |
show details | |

|
#42
W Black Wolf Run Dr
Carmel, IN 46033
|
3,340 sq. feet
|
4 baths 5 beds |
show details | |

|
#43
S Biltmore Ave
Indianapolis, IN 46241
|
2,904 sq. feet
|
3 baths 4 beds |
show details | |

|
#44
E 156th St
Carmel, IN 46032
|
3,240 sq. feet
|
3 baths 4 beds |
show details | |

|
#45
S Post Rd
Indianapolis, IN 46239
|
1,008 sq. feet
|
1 baths 3 beds |
show details | |

|
#46
Brushwood Rd
Camby, IN 46113
|
1,314 sq. feet
|
2 baths 3 beds |
show details | |

|
#47
Marcy Ln
Greenwood, IN 46143
|
960 sq. feet
|
1 baths 3 beds |
show details | |

|
#48
Freemont Ln
Greenwood, IN 46143
|
1,058 sq. feet
|
2 baths 2 beds |
show details | |

|
#49
E 16th St
Indianapolis, IN 46219
|
4,115 sq. feet
|
2 baths 2 beds |
show details | |

|
Check over 1 million property listings on Foreclosure.com!
|
browse all offers | |||


 | Safe area? W30th and Kessler? (11 replies) |
Household type by relationship:
Households: 217- Male householders: 36 (7 living alone), Female householders: 53 (15 living alone)
52 spouses (46 opposite-sex spouses), 6 unmarried partners, (6 opposite-sex unmarried partners), 51 children (51 natural, 0 adopted, 0 stepchildren), 0 grandchildren, 2 brothers or sisters, 0 parents, 0 foster children, 2 other relatives, 8 non-relatives
Size of family households: 33 2-persons, 18 3-persons, 10 4-persons.
Size of nonfamily households: 23 1-person, 9 2-persons.
35 married couples with children.
0 single-parent households (0 men, 0 women).
92.7% of residents of Wynnedale speak English at home.
0.5% of residents speak Spanish at home (100% speak English very well).
6.8% of residents speak other Indo-European language at home (100% speak English very well).
Foreign born population: 11 (5.1%)
(45.5% of them are naturalized citizens)
| Here: | 7.7 |
| State: | 6.6 |
| Here: | -635658914.1 |
| State: | 4.3 |
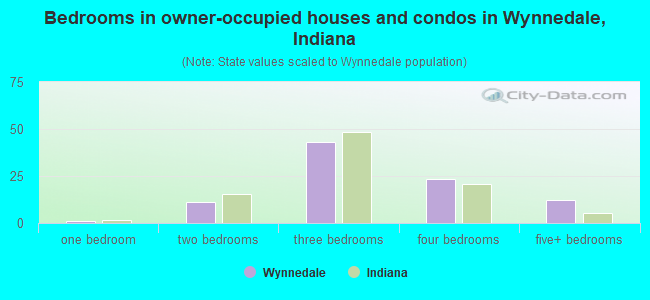
- Bedrooms in owner-occupied houses and condos in Wynnedale, Indiana
- 0no bedroom
- 11 bedroom
- 112 bedrooms
- 433 bedrooms
- 244 bedrooms
- 125+ bedrooms
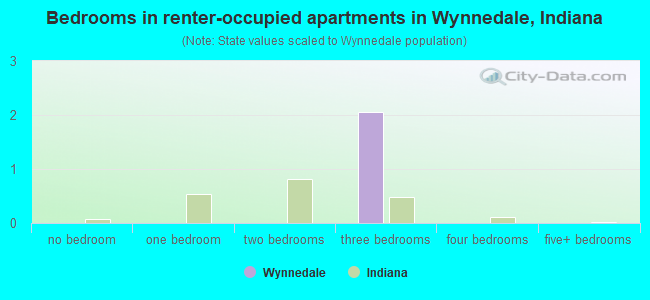
- Bedrooms in renter-occupied apartments in Wynnedale, Indiana
- 0no bedroom
- 01 bedroom
- 02 bedrooms
- 23 bedrooms
- 04 bedrooms
- 05+ bedrooms
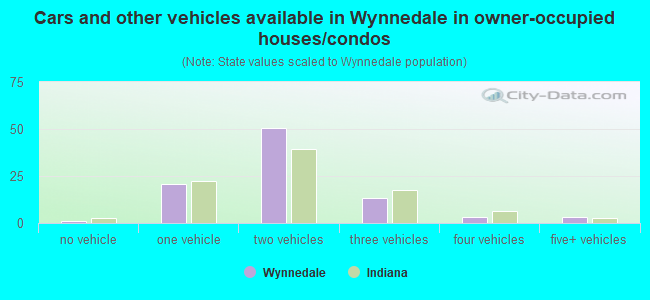
- Cars and other vehicles available in Wynnedale in owner-occupied houses/condos
- 1no vehicle
- 211 vehicle
- 502 vehicles
- 133 vehicles
- 34 vehicles
- 35+ vehicles
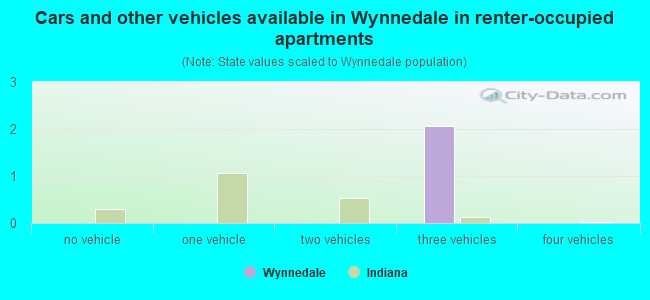
- Cars and other vehicles available in Wynnedale in renter-occupied apartments
- 0no vehicle
- 01 vehicle
- 02 vehicles
- 23 vehicles
- 04 vehicles
- 05+ vehicles
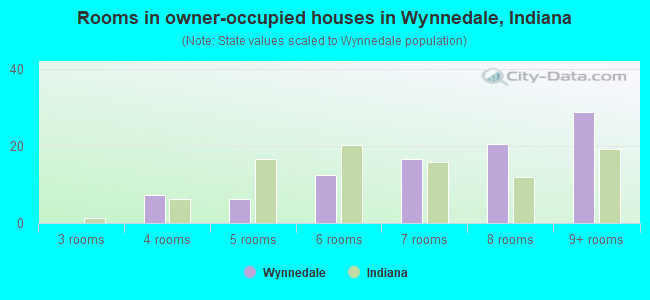
- Rooms in owner-occupied houses in Wynnedale, Indiana
- 01 room
- 02 rooms
- 03 rooms
- 74 rooms
- 65 rooms
- 126 rooms
- 167 rooms
- 218 rooms
- 299+ rooms
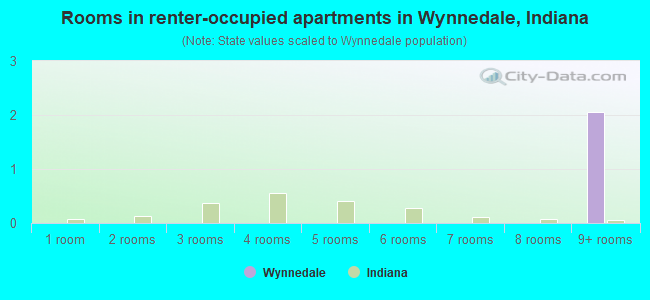
- Rooms in renter-occupied apartments in Wynnedale, Indiana
- 01 room
- 02 rooms
- 03 rooms
- 04 rooms
- 05 rooms
- 06 rooms
- 07 rooms
- 08 rooms
- 29+ rooms
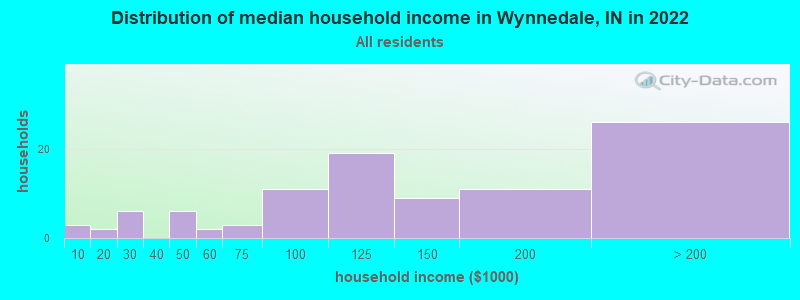
Wynnedale, IN household income distribution

- 3Less than $10,000
- 2$10,000 to $19,999
- 6$20,000 to $29,999
- 6$40,000 to $49,999
- 2$50,000 to $59,999
- 3$60,000 to $74,999
- 11$75,000 to $99,999
- 19$100,000 to $124,999
- 9$125,000 to $149,999
- 11$150,000 to $199,999
- 26$200,000 or more
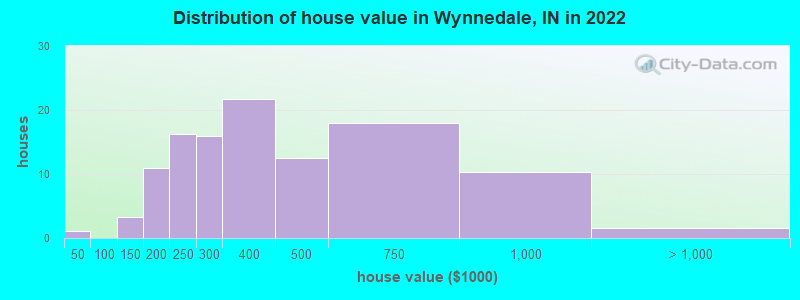
Home value of owner - occupied houses in 2022 in Wynnedale, IN
-
- 1$30,000 to $34,999
- 3$125,000 to $149,999
- 5$150,000 to $174,999
- 5$175,000 to $199,999
- 16$200,000 to $249,999
- 15$250,000 to $299,999
- 21$300,000 to $399,999
- 12$400,000 to $499,999
- 18$500,000 to $749,999
- 10$750,000 to $999,999
- 1$1,000,000 to $1,499,999
Percentage of workers working in this county: 74.6%
Number of people working at home: 15 (12.7% of all workers)
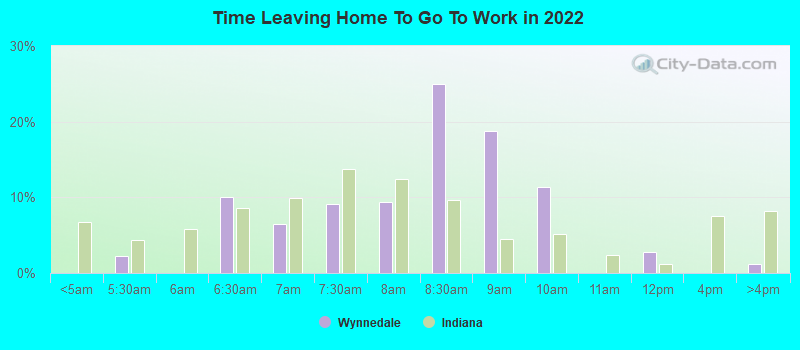
Travel time to work (commute)
- Less than 5 minutes: 2
- 5 to 9 minutes: 0
- 10 to 14 minutes: 14
- 15 to 19 minutes: 11
- 20 to 24 minutes: 26
- 25 to 29 minutes: 20
- 30 to 34 minutes: 15
- 35 to 39 minutes: 0
- 40 to 44 minutes: 0
- 45 to 59 minutes: 5
- 60 to 89 minutes: 4
- 90 or more minutes: 0
Means of transportation to work:
- Drove a car alone: 147 (90.2%)
- Carpooled: 4 (2.5%)
- Bus or trolley bus: 2 (1.2%)
- Worked at home: 10 (6.1%)
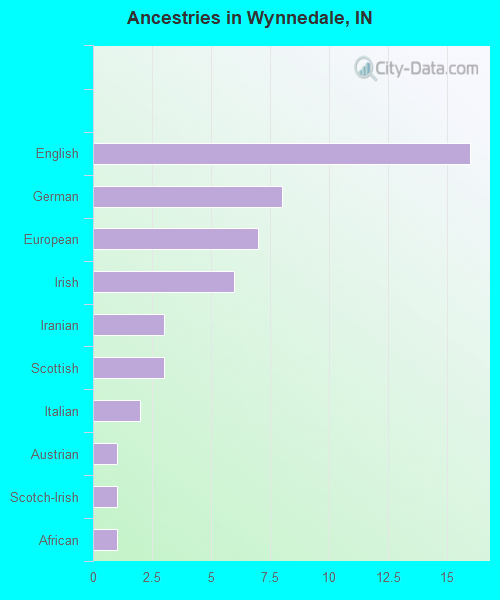
First ancestries reported:
- English: 16 (15.5%)
- German: 8 (7.7%)
- European: 7 (6.8%)
- Irish: 6 (5.8%)
- Iranian: 3 (2.9%)
- Scottish: 3 (2.9%)
- Italian: 2 (1.9%)
- Austrian: 1 (1.0%)
- Scotch-Irish: 1 (1.0%)
- African: 1 (1.0%)
Most common places of birth for foreign-born residents (%):
| Wynnedale: | 40.0% (4) |
| Indiana: | 2.1% (7,834) |
| Wynnedale: | 20.0% (2) |
| Indiana: | 0.8% (2,847) |
| Wynnedale: | 10.0% (1) |
| Indiana: | 4.3% (16,289) |
| Wynnedale: | 10.0% (1) |
| Indiana: | 0.4% (1,600) |
Place of birth for U.S.-born residents:
- This state: 133
- Other state: 69
- Northeast: 20
- Midwest: 24
- South: 21
- West: 4
82.0% of Wynnedale residents lived in the same house 1 years ago.
Out of people who lived in different houses, 50.7% lived in this county.
Out of people who lived in different counties, 100.0% lived in Indiana.
| Wynnedale: | 82.0% |
| State average: | 87.1% |
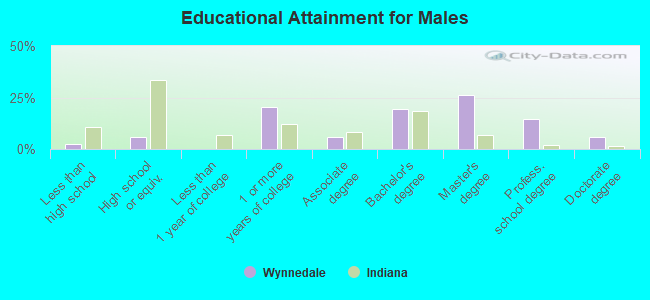
Education attainment for males 25 years and older:
- No schooling: 2
- Nursery to 4th grade: 0
- 5th and 6th grade: 0
- 7th and 8th grade: 0
- 9th grade: 0
- 10th grade: 0
- 11th grade: 0
- 12th grade, no diploma: 0
- High school graduate (or equivalency): 5
- Less than 1 year of college: 0
- Some college more than 1 year, no degree: 18
- Associate degree: 5
- Bachelor's degree: 17
- Master's degree: 23
- Professional school degree: 13
- Doctorate degree: 5
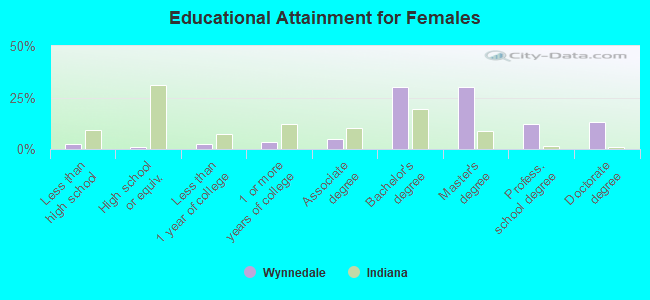
Education attainment for females 25 years and older:
- No schooling: 2
- Nursery to 4th grade: 0
- 5th and 6th grade: 0
- 7th and 8th grade: 0
- 9th grade: 0
- 10th grade: 0
- 11th grade: 0
- 12th grade, no diploma: 0
- High school graduate (or equivalency): 1
- Less than 1 year of college: 2
- Some college more than 1 year, no degree: 3
- Associate degree: 4
- Bachelor's degree: 25
- Master's degree: 25
- Professional school degree: 10
- Doctorate degree: 11
Housing units in structures:
- One, detached: 93
- One, attached: 4
- 20 to 49: 1
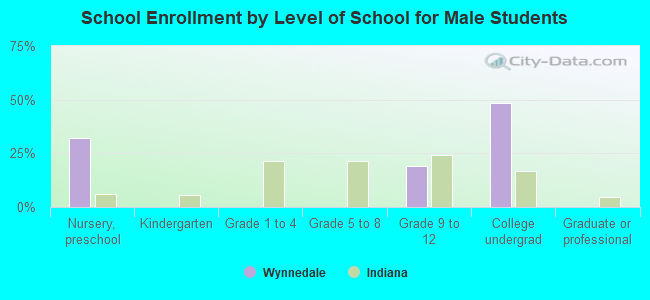
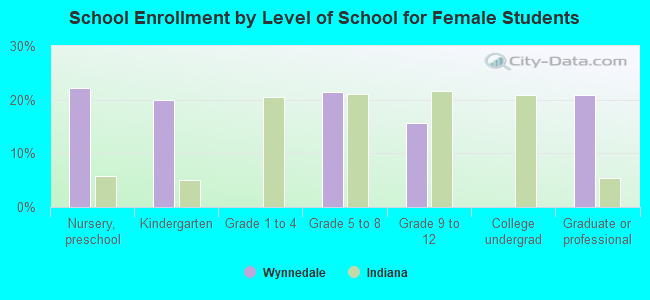
Private vs. public school enrollment:
| Here: | 0.0% |
| Indiana: | 14.9% |
| Here: | 100.0% |
| Indiana: | 11.4% |
| Here: | 25.0% |
| Indiana: | 22.3% |