Auburn, New Hampshire (NH) income map, earnings map, and wages data
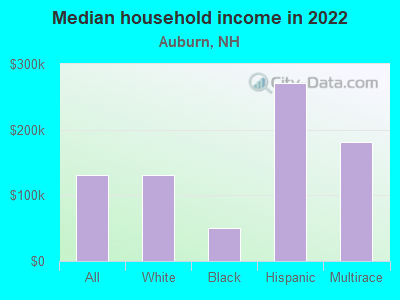
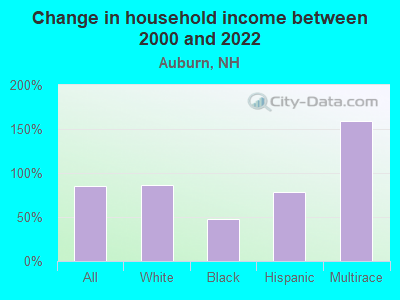
The median household income in Auburn, NH in 2022 was $130,766, which was 31.2% greater than the median annual income of $89,992 across the entire state of New Hampshire. Compared to the median income of $70,774 in 2000 this represents an increase of 45.9%. The per capita income in 2022 was $62,352, which means an increase of 54.4% compared to 2000 when it was $28,405.
Income statistics for all residents
Median household income in Auburn, NH in 2022:| Auburn: | $130,767 |
| State: | $89,992 |
Change in median household income between 2000 and 2022:| Auburn, New Hampshire: | +84.8% |
| State: | +81.9% |
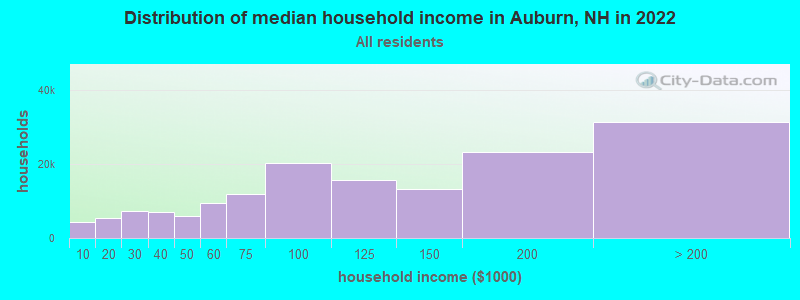
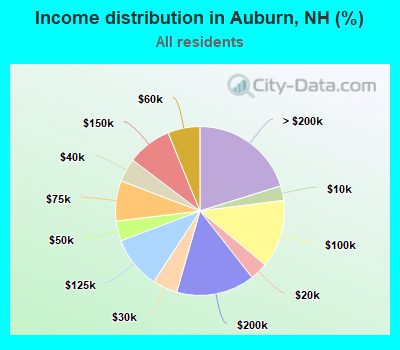
Number of households with income < $10k:| Auburn: | 2.8% (4,318) |
| State: | 3.1% (17,541) |
Number of households with income $10k - 20k:| Auburn: | 3.4% (5,312) |
| State: | 5.4% (29,916) |
Number of households with income $20k - 30k:| Auburn: | 4.8% (7,406) |
| State: | 5.5% (30,783) |
Number of households with income $30k - 40k:| Auburn: | 4.5% (6,967) |
| State: | 5.9% (32,868) |
Number of households with income $40k - 50k:| Auburn: | 3.8% (5,931) |
| New Hampshire: | 5.9% (32,728) |
Number of households with income $50k - 60k:| Auburn: | 6.2% (9,536) |
| New Hampshire: | 6.9% (38,422) |
Number of households with income $60k - 75k:| Auburn: | 7.7% (11,949) |
| State: | 9.1% (50,552) |
Number of households with income $75k - 100k:| Auburn: | 13.0% (20,132) |
| State: | 13.1% (73,145) |
Number of households with income $100k - 125k:| Auburn: | 10.0% (15,547) |
| State: | 10.5% (58,593) |
Number of households with income $125k - 150k:| Auburn: | 8.5% (13,216) |
| State: | 8.1% (44,878) |
Number of households with income $150k - 200k:| Auburn: | 15.0% (23,268) |
| State: | 11.5% (64,340) |
Number of households with income > $200k:| Auburn: | 20.2% (31,341) |
| New Hampshire: | 15.0% (83,454) |
Aggregate household income in Auburn in 2022: $1,129,126,368
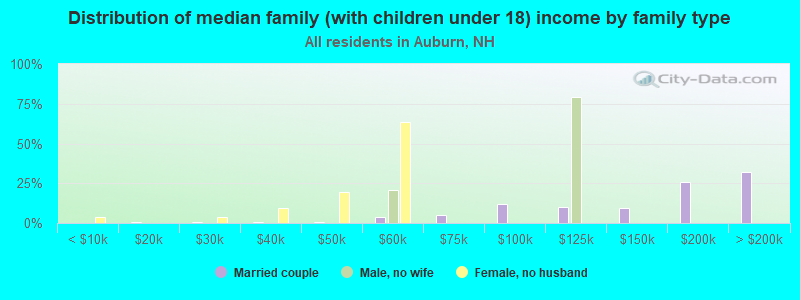
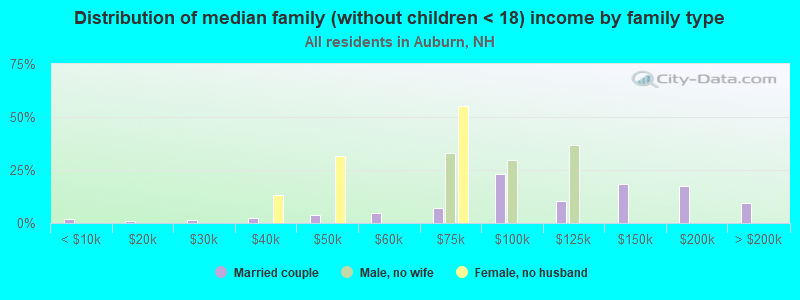
Median family income in Auburn in 2022:| Auburn: | $154,061 |
| State: | $112,950 |
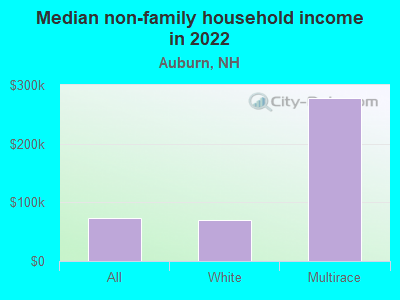
Median non-family income in Auburn in 2022:| Auburn: | $73,441 |
| State: | $52,292 |
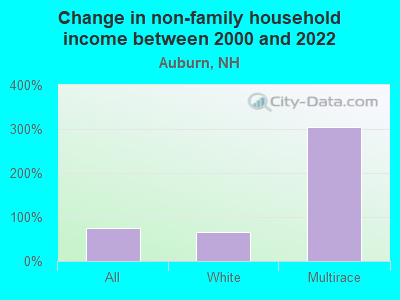
Change in median non-family income between 2000 and 2022:| Auburn, New Hampshire: | +75.8% |
| State: | +80.7% |
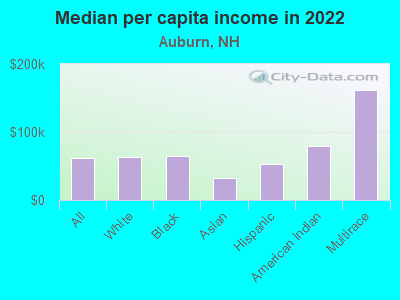
Median per capita income in Auburn in 2022:| Auburn: | $62,352 |
| State: | $49,281 |
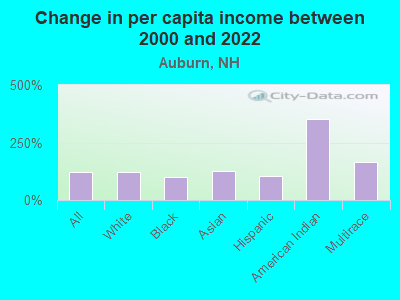
Change in median per capita income between 2000 and 2022:| Auburn, New Hampshire: | +119.5% |
| New Hampshire: | +106.7% |
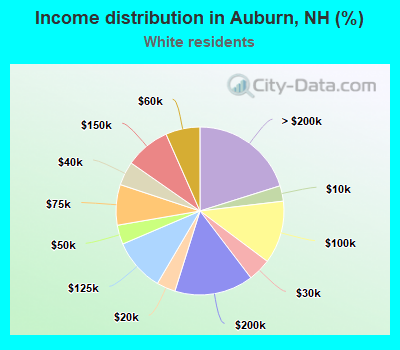
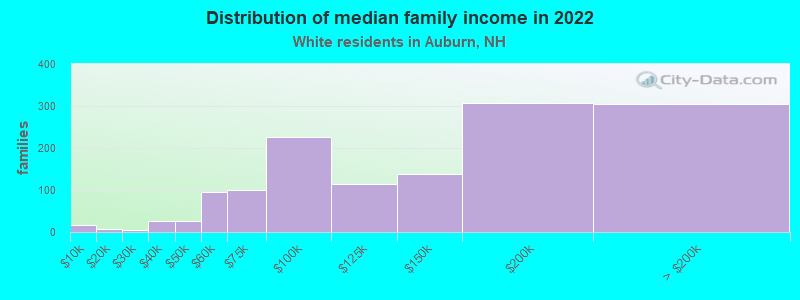
Income statistics for White residents
Median household income in Auburn, NH in 2022:| Auburn: | $131,521 |
| New Hampshire: | $90,839 |
Change in median household income between 2000 and 2022:| Auburn, New Hampshire: | +85.6% |
| New Hampshire: | +82.8% |
Number of households with income < $10k:| Auburn: | 3.0% (4,226) |
| New Hampshire: | 3.1% (15,499) |
Number of households with income $10k - 20k:| Auburn: | 3.6% (5,144) |
| State: | 5.6% (27,915) |
Number of households with income $20k - 30k:| Auburn: | 4.4% (6,295) |
| New Hampshire: | 5.4% (27,382) |
Number of households with income $30k - 40k:| Auburn: | 4.6% (6,532) |
| State: | 5.9% (29,681) |
Number of households with income $40k - 50k:| Auburn: | 3.7% (5,286) |
| State: | 5.7% (28,456) |
Number of households with income $50k - 60k:| Auburn: | 6.6% (9,402) |
| New Hampshire: | 6.9% (34,641) |
Number of households with income $60k - 75k:| Auburn: | 7.8% (11,113) |
| State: | 9.0% (45,144) |
Number of households with income $75k - 100k:| Auburn: | 12.1% (17,213) |
| State: | 13.0% (65,259) |
Number of households with income $100k - 125k:| Auburn: | 10.1% (14,382) |
| State: | 10.7% (53,931) |
Number of households with income $125k - 150k:| Auburn: | 8.7% (12,366) |
| State: | 8.1% (40,466) |
Number of households with income $150k - 200k:| Auburn: | 15.2% (21,597) |
| New Hampshire: | 11.9% (59,781) |
Number of households with income > $200k:| Auburn: | 20.2% (28,680) |
| State: | 14.8% (74,387) |
Aggregate household income in Auburn in 2022: $1,036,189,914
Median family income in Auburn in 2022:| Auburn: | $154,486 |
| New Hampshire: | $115,125 |
Number of families with income < $10k:| Auburn: | 1.2% (16) |
| New Hampshire: | 1.5% (4,767) |
Number of families with income $10k - 20k:| Auburn: | 0.4% (6) |
| State: | 2.1% (6,602) |
Number of families with income $20k - 30k:| Auburn: | 0.3% (4) |
| State: | 2.7% (8,511) |
Number of families with income $30k - 40k:| Auburn: | 2.0% (27) |
| State: | 4.0% (12,696) |
Number of families with income $40k - 50k:| Auburn: | 1.9% (26) |
| State: | 4.3% (13,626) |
Number of families with income $50k - 60k:| Auburn: | 7.0% (96) |
| New Hampshire: | 5.6% (17,792) |
Number of families with income $60k - 75k:| Auburn: | 7.2% (99) |
| State: | 8.4% (26,945) |
Number of families with income $75k - 100k:| Auburn: | 16.6% (226) |
| New Hampshire: | 13.8% (44,284) |
Number of families with income $100k - 125k:| Auburn: | 8.4% (115) |
| State: | 12.5% (39,959) |
Number of families with income $125k - 150k:| Auburn: | 10.1% (137) |
| New Hampshire: | 10.3% (33,038) |
Number of families with income $150k - 200k:| Auburn: | 22.5% (306) |
| New Hampshire: | 15.4% (49,456) |
Number of families with income > $200k:| Auburn: | 22.4% (305) |
| State: | 19.5% (62,442) |
Median non-family income in Auburn in 2022:| Auburn: | $69,567 |
| New Hampshire: | $51,861 |
Change in median non-family income between 2000 and 2022:| Auburn, New Hampshire: | +67.2% |
| State: | +79.2% |
Median per capita income in Auburn in 2022:| Auburn: | $62,872 |
| State: | $50,469 |
Change in median per capita income between 2000 and 2022:| Auburn, New Hampshire: | +121.7% |
| State: | +109.2% |
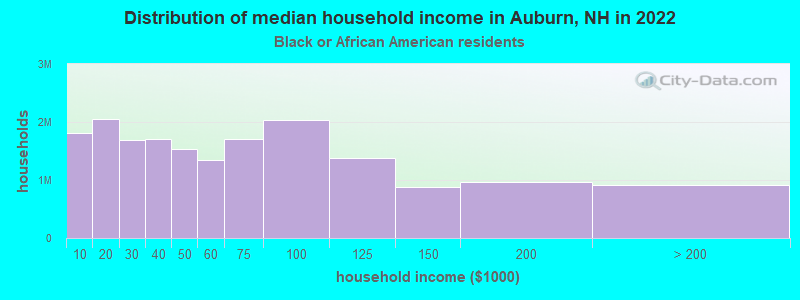
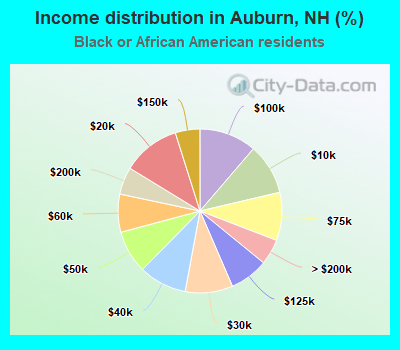
Income statistics for Black or African American residents
Median household income in Auburn, NH in 2022:| Auburn: | $49,933 |
| State: | $70,067 |
Change in median household income between 2000 and 2022:| Auburn, New Hampshire: | +47.9% |
| State: | +61.2% |
Number of households with income < $10k:| Auburn: | 10.1% (1,811,343) |
| State: | 3.4% (202) |
Number of households with income $10k - 20k:| Auburn: | 11.4% (2,054,141) |
| New Hampshire: | 7.8% (463) |
Number of households with income $20k - 30k:| Auburn: | 9.4% (1,690,063) |
| New Hampshire: | 6.5% (384) |
Number of households with income $30k - 40k:| Auburn: | 9.5% (1,702,630) |
| State: | 9.2% (544) |
Number of households with income $40k - 50k:| Auburn: | 8.5% (1,526,169) |
| State: | 6.7% (394) |
Number of households with income $50k - 60k:| Auburn: | 7.5% (1,348,295) |
| New Hampshire: | 7.9% (469) |
Number of households with income $60k - 75k:| Auburn: | 9.5% (1,706,726) |
| State: | 11.9% (705) |
Number of households with income $75k - 100k:| Auburn: | 11.3% (2,034,459) |
| State: | 12.9% (761) |
Number of households with income $100k - 125k:| Auburn: | 7.6% (1,374,531) |
| State: | 11.7% (694) |
Number of households with income $125k - 150k:| Auburn: | 4.9% (875,324) |
| State: | 7.8% (459) |
Number of households with income $150k - 200k:| Auburn: | 5.4% (972,382) |
| State: | 7.7% (456) |
Number of households with income > $200k:| Auburn: | 5.1% (911,218) |
| New Hampshire: | 6.4% (377) |
Aggregate household income in Auburn in 2022: $335,773
Median per capita income in Auburn in 2022:| Auburn: | $65,342 |
| New Hampshire: | $31,675 |
Change in median per capita income between 2000 and 2022:| Auburn, New Hampshire: | +100.7% |
| State: | +85.9% |
Income statistics for Asian residents
Number of households with income < $10k:| Auburn: | 2.1% (177) |
| State: | 2.1% (271) |
Number of households with income $10k - 20k:| Auburn: | 3.0% (257) |
| State: | 3.0% (393) |
Number of households with income $20k - 30k:| Auburn: | 5.5% (477) |
| State: | 5.5% (729) |
Number of households with income $30k - 40k:| Auburn: | 3.9% (333) |
| State: | 3.9% (510) |
Number of households with income $40k - 50k:| Auburn: | 6.4% (551) |
| State: | 6.4% (842) |
Number of households with income $50k - 60k:| Auburn: | 2.0% (171) |
| New Hampshire: | 2.0% (261) |
Number of households with income $60k - 75k:| Auburn: | 4.5% (391) |
| State: | 4.5% (597) |
Number of households with income $75k - 100k:| Auburn: | 11.8% (1,020) |
| New Hampshire: | 11.8% (1,559) |
Number of households with income $100k - 125k:| Auburn: | 10.1% (873) |
| State: | 10.1% (1,334) |
Number of households with income $125k - 150k:| Auburn: | 11.1% (957) |
| State: | 11.1% (1,463) |
Number of households with income $150k - 200k:| Auburn: | 8.3% (716) |
| New Hampshire: | 8.3% (1,095) |
Number of households with income > $200k:| Auburn: | 31.2% (2,689) |
| New Hampshire: | 31.2% (4,111) |
Median per capita income in Auburn in 2022:| Auburn: | $31,742 |
| New Hampshire: | $64,014 |
Change in median per capita income between 2000 and 2022:| Auburn, New Hampshire: | +125.3% |
| State: | +197.2% |
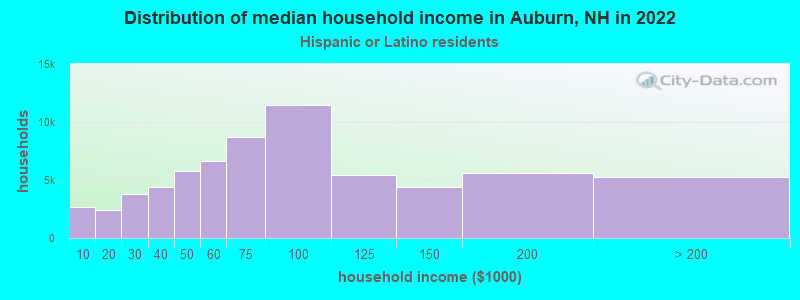
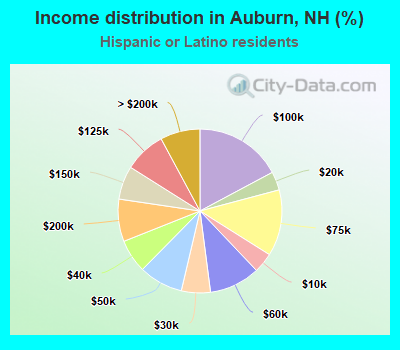
Income statistics for Hispanic or Latino residents
Median household income in Auburn, NH in 2022:| Auburn: | $271,751 |
| New Hampshire: | $73,813 |
Change in median household income between 2000 and 2022:| Auburn, New Hampshire: | +78.4% |
| State: | +84.6% |
Number of households with income < $10k:| Auburn: | 4.0% (2,648) |
| New Hampshire: | 4.0% (695) |
Number of households with income $10k - 20k:| Auburn: | 3.7% (2,434) |
| State: | 3.7% (639) |
Number of households with income $20k - 30k:| Auburn: | 5.7% (3,803) |
| New Hampshire: | 5.7% (998) |
Number of households with income $30k - 40k:| Auburn: | 6.6% (4,385) |
| State: | 6.6% (1,151) |
Number of households with income $40k - 50k:| Auburn: | 8.7% (5,795) |
| State: | 8.7% (1,521) |
Number of households with income $50k - 60k:| Auburn: | 10.0% (6,671) |
| State: | 10.0% (1,751) |
Number of households with income $60k - 75k:| Auburn: | 13.1% (8,702) |
| State: | 13.1% (2,284) |
Number of households with income $75k - 100k:| Auburn: | 17.2% (11,445) |
| State: | 17.2% (3,004) |
Number of households with income $100k - 125k:| Auburn: | 8.2% (5,448) |
| New Hampshire: | 8.2% (1,430) |
Number of households with income $125k - 150k:| Auburn: | 6.6% (4,397) |
| New Hampshire: | 6.6% (1,154) |
Number of households with income $150k - 200k:| Auburn: | 8.4% (5,570) |
| State: | 8.4% (1,462) |
Number of households with income > $200k:| Auburn: | 7.9% (5,223) |
| State: | 7.9% (1,371) |
Aggregate household income in Auburn in 2022: $4,209,920
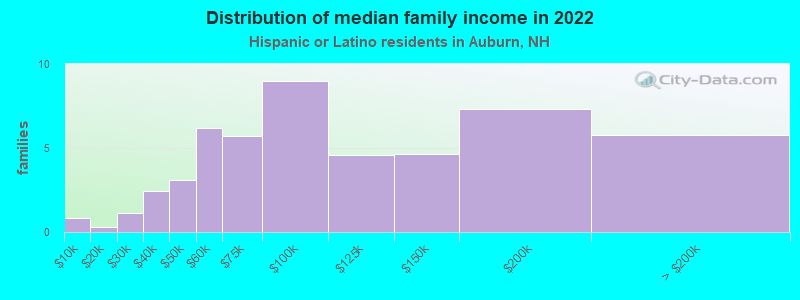
Median family income in Auburn in 2022:| Auburn: | $289,033 |
| State: | $74,056 |
Number of families with income < $10k:| Auburn: | 1.6% (1) |
| State: | 2.6% (310) |
Number of families with income $10k - 20k:| Auburn: | 0.6% (0) |
| State: | 2.4% (286) |
Number of families with income $20k - 30k:| Auburn: | 2.3% (1) |
| New Hampshire: | 7.5% (884) |
Number of families with income $30k - 40k:| Auburn: | 4.8% (2) |
| New Hampshire: | 8.4% (994) |
Number of families with income $40k - 50k:| Auburn: | 6.1% (3) |
| State: | 9.9% (1,168) |
Number of families with income $50k - 60k:| Auburn: | 12.1% (6) |
| New Hampshire: | 9.3% (1,090) |
Number of families with income $60k - 75k:| Auburn: | 11.1% (6) |
| State: | 10.6% (1,247) |
Number of families with income $75k - 100k:| Auburn: | 17.6% (9) |
| State: | 11.5% (1,349) |
Number of families with income $100k - 125k:| Auburn: | 9.0% (5) |
| New Hampshire: | 9.0% (1,054) |
Number of families with income $125k - 150k:| Auburn: | 9.1% (5) |
| New Hampshire: | 7.6% (890) |
Number of families with income $150k - 200k:| Auburn: | 14.3% (7) |
| New Hampshire: | 10.6% (1,247) |
Number of families with income > $200k:| Auburn: | 11.4% (6) |
| New Hampshire: | 10.6% (1,248) |
Median per capita income in Auburn in 2022:| Auburn: | $53,106 |
| State: | $32,911 |
Change in median per capita income between 2000 and 2022:| Auburn, New Hampshire: | +105.2% |
| State: | +127.3% |
Income statistics for American Indian and Alaska Native residents
Number of households with income < $10k:| Auburn: | 8.4% (119,586) |
| New Hampshire: | 0.7% (6) |
Number of households with income $10k - 20k:| Auburn: | 9.4% (133,454) |
| State: | 9.7% (81) |
Number of households with income $20k - 30k:| Auburn: | 8.5% (120,711) |
| State: | 8.7% (73) |
Number of households with income $30k - 40k:| Auburn: | 9.1% (129,327) |
| State: | 13.3% (111) |
Number of households with income $40k - 50k:| Auburn: | 8.3% (118,627) |
| State: | 9.4% (79) |
Number of households with income $50k - 60k:| Auburn: | 7.8% (111,856) |
| New Hampshire: | 3.7% (31) |
Number of households with income $60k - 75k:| Auburn: | 9.8% (139,424) |
| New Hampshire: | 16.9% (141) |
Number of households with income $75k - 100k:| Auburn: | 12.6% (179,974) |
| State: | 3.9% (33) |
Number of households with income $100k - 125k:| Auburn: | 9.4% (134,584) |
| New Hampshire: | 2.8% (23) |
Number of households with income $125k - 150k:| Auburn: | 5.6% (80,575) |
| New Hampshire: | 6.8% (57) |
Number of households with income $150k - 200k:| Auburn: | 6.0% (84,941) |
| New Hampshire: | 22.6% (189) |
Number of households with income > $200k:| Auburn: | 5.2% (73,522) |
| State: | 1.4% (12) |
Median per capita income in Auburn in 2022:| Auburn: | $80,133 |
| New Hampshire: | $75,805 |
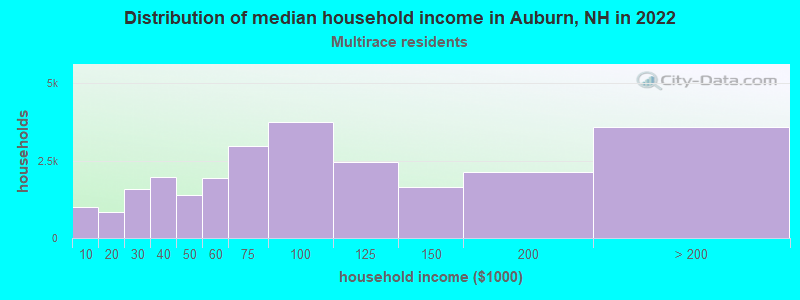
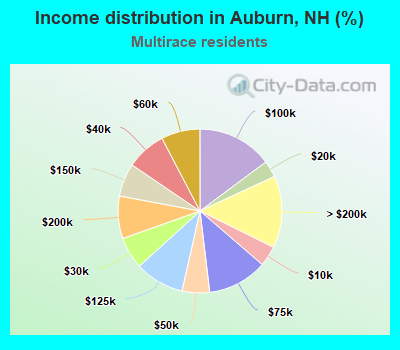
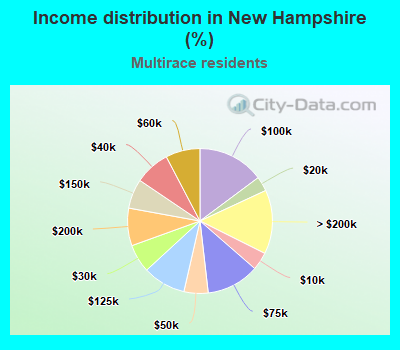
Income statistics for Multirace residents
Median household income in Auburn, NH in 2022:| Auburn: | $180,893 |
| State: | $81,037 |
Number of households with income < $10k:| Auburn: | 4.0% (1,017) |
| New Hampshire: | 4.0% (1,057) |
Number of households with income $10k - 20k:| Auburn: | 3.3% (825) |
| State: | 3.3% (864) |
Number of households with income $20k - 30k:| Auburn: | 6.3% (1,596) |
| State: | 6.3% (1,664) |
Number of households with income $30k - 40k:| Auburn: | 7.8% (1,983) |
| New Hampshire: | 7.9% (2,072) |
Number of households with income $40k - 50k:| Auburn: | 5.4% (1,374) |
| State: | 5.4% (1,422) |
Number of households with income $50k - 60k:| Auburn: | 7.7% (1,935) |
| State: | 7.7% (2,024) |
Number of households with income $60k - 75k:| Auburn: | 11.8% (2,975) |
| State: | 11.8% (3,109) |
Number of households with income $75k - 100k:| Auburn: | 14.8% (3,747) |
| State: | 14.8% (3,906) |
Number of households with income $100k - 125k:| Auburn: | 9.7% (2,454) |
| State: | 9.6% (2,523) |
Number of households with income $125k - 150k:| Auburn: | 6.5% (1,654) |
| New Hampshire: | 6.6% (1,734) |
Number of households with income $150k - 200k:| Auburn: | 8.4% (2,119) |
| State: | 8.4% (2,213) |
Number of households with income > $200k:| Auburn: | 14.2% (3,592) |
| State: | 14.3% (3,765) |
Aggregate household income in Auburn in 2022: $20,249,456
Median family income in Auburn in 2022:| Auburn: | $359,982 |
| State: | $87,413 |
Number of families with income $125k - 150k:| Auburn: | 100.0% (131) |
| New Hampshire: | 7.2% (1,366) |
Median non-family income in Auburn in 2022:| Auburn: | $278,259 |
| State: | $60,494 |
Median per capita income in Auburn in 2022:| Auburn: | $162,415 |
| State: | $34,906 |