Barre, New York (NY) income map, earnings map, and wages data
The median household income in Barre, NY in 2022 was $81,093, which was about the same as the median annual income of $79,557 across the entire state of New York. Compared to the median income of $44,545 in 2000 this represents an increase of 45.1%. The per capita income in 2022 was $34,904, which means an increase of 50.9% compared to 2000 when it was $17,129.
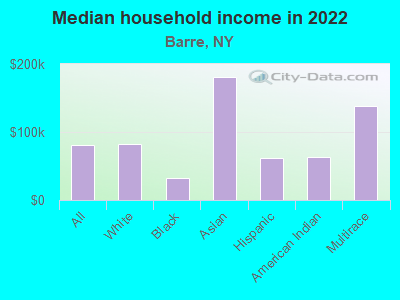
Income statistics for all residents
Median household income in Barre, NY in 2022:| Barre: | $81,093 |
| State: | $79,557 |
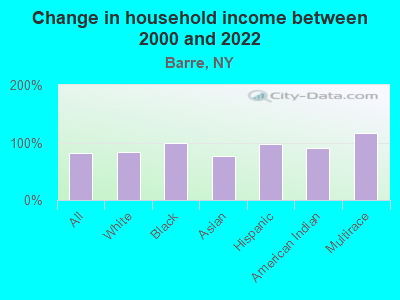
Change in median household income between 2000 and 2022:| Barre, New York: | +82.0% |
| State: | +83.3% |
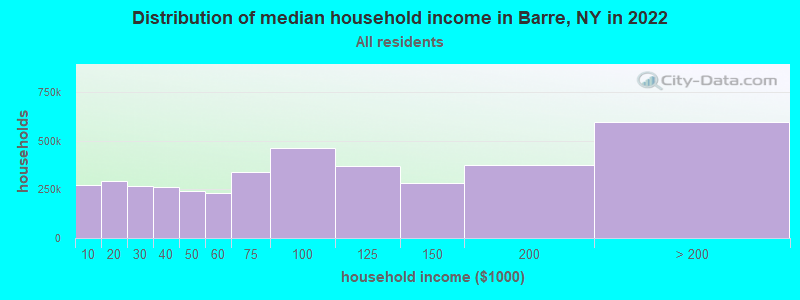
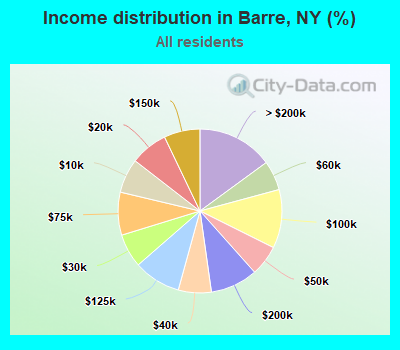
Number of households with income < $10k:| Barre: | 6.8% (270,939) |
| New York: | 6.8% (527,598) |
Number of households with income $10k - 20k:| Barre: | 7.4% (295,200) |
| State: | 7.4% (574,940) |
Number of households with income $20k - 30k:| Barre: | 6.7% (265,797) |
| State: | 6.7% (517,718) |
Number of households with income $30k - 40k:| Barre: | 6.5% (260,108) |
| New York: | 6.5% (506,674) |
Number of households with income $40k - 50k:| Barre: | 6.1% (241,490) |
| State: | 6.1% (470,439) |
Number of households with income $50k - 60k:| Barre: | 5.8% (233,069) |
| New York: | 5.8% (454,042) |
Number of households with income $60k - 75k:| Barre: | 8.5% (337,506) |
| State: | 8.5% (657,508) |
Number of households with income $75k - 100k:| Barre: | 11.6% (461,886) |
| New York: | 11.6% (899,824) |
Number of households with income $100k - 125k:| Barre: | 9.3% (371,552) |
| New York: | 9.3% (723,825) |
Number of households with income $125k - 150k:| Barre: | 7.1% (283,580) |
| State: | 7.1% (552,420) |
Number of households with income $150k - 200k:| Barre: | 9.4% (373,268) |
| State: | 9.4% (727,051) |
Number of households with income > $200k:| Barre: | 15.0% (596,830) |
| State: | 15.0% (1,162,269) |
Aggregate household income in Barre in 2022: $7,844,515,598
Median family income in Barre in 2022:| Barre: | $90,508 |
| State: | $99,066 |
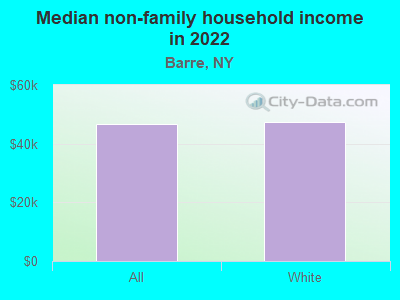
Median non-family income in Barre in 2022:| Barre: | $46,622 |
| State: | $50,181 |
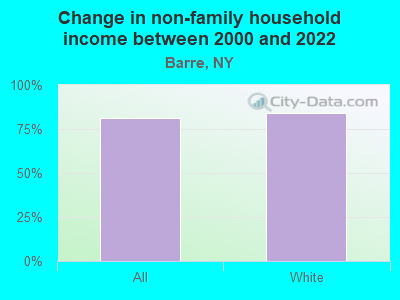
Change in median non-family income between 2000 and 2022:| Barre, New York: | +81.3% |
| State: | +85.4% |
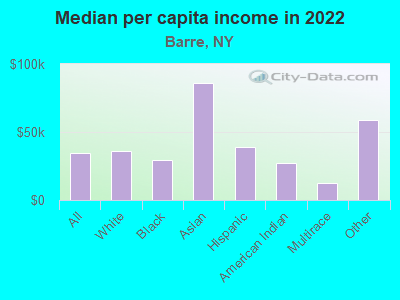
Median per capita income in Barre in 2022:| Barre: | $34,905 |
| New York: | $47,421 |
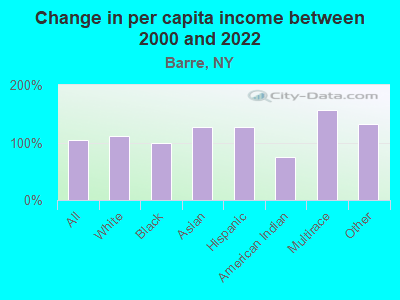
Change in median per capita income between 2000 and 2022:| Barre, New York: | +103.8% |
| New York: | +102.7% |
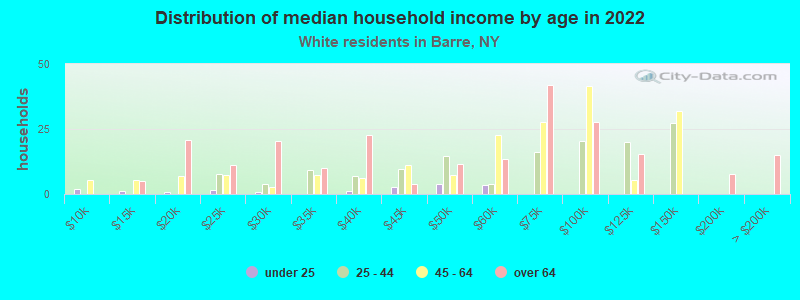
Income statistics for White residents
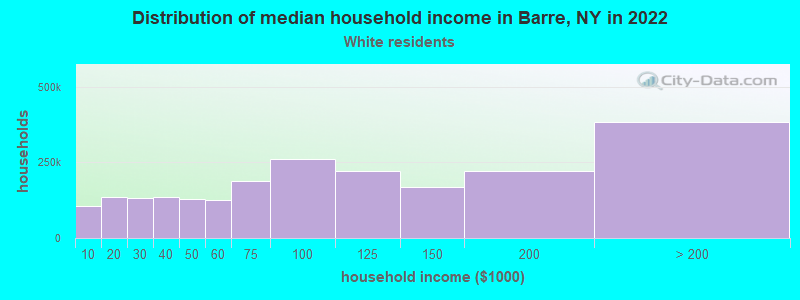
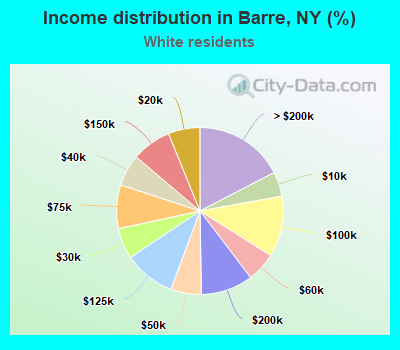
Median household income in Barre, NY in 2022:| Barre: | $82,732 |
| New York: | $89,408 |
Change in median household income between 2000 and 2022:| Barre, New York: | +83.3% |
| State: | +85.5% |
Number of households with income < $10k:| Barre: | 4.8% (105,131) |
| New York: | 4.8% (225,550) |
Number of households with income $10k - 20k:| Barre: | 6.1% (135,453) |
| State: | 6.1% (289,425) |
Number of households with income $20k - 30k:| Barre: | 6.0% (131,385) |
| New York: | 5.9% (280,254) |
Number of households with income $30k - 40k:| Barre: | 6.1% (135,291) |
| State: | 6.1% (288,263) |
Number of households with income $40k - 50k:| Barre: | 5.9% (130,644) |
| State: | 5.9% (278,079) |
Number of households with income $50k - 60k:| Barre: | 5.7% (125,771) |
| State: | 5.7% (267,554) |
Number of households with income $60k - 75k:| Barre: | 8.5% (187,297) |
| New York: | 8.4% (398,344) |
Number of households with income $75k - 100k:| Barre: | 11.8% (260,829) |
| State: | 11.8% (554,841) |
Number of households with income $100k - 125k:| Barre: | 10.0% (220,221) |
| State: | 10.0% (469,794) |
Number of households with income $125k - 150k:| Barre: | 7.7% (168,883) |
| State: | 7.6% (360,467) |
Number of households with income $150k - 200k:| Barre: | 10.1% (222,460) |
| State: | 10.1% (477,078) |
Number of households with income > $200k:| Barre: | 17.4% (383,728) |
| State: | 17.6% (829,233) |
Aggregate household income in Barre in 2022: $5,144,597,782
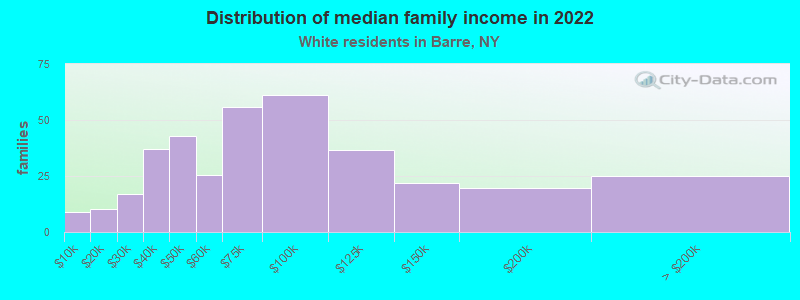
Median family income in Barre in 2022:| Barre: | $93,738 |
| State: | $115,170 |
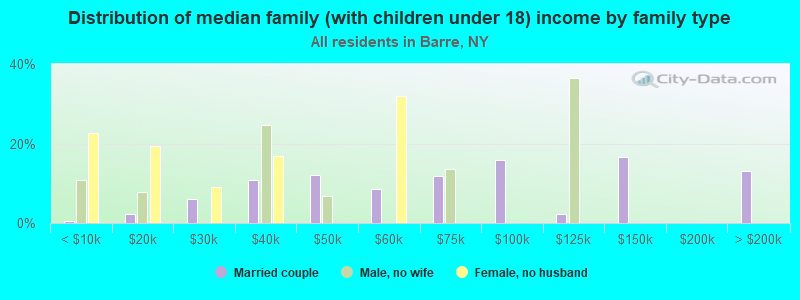
Number of families with income < $10k:| Barre: | 2.5% (9) |
| New York: | 2.5% (68,851) |
Number of families with income $10k - 20k:| Barre: | 2.8% (10) |
| State: | 3.0% (83,127) |
Number of families with income $20k - 30k:| Barre: | 4.7% (17) |
| State: | 3.5% (97,578) |
Number of families with income $30k - 40k:| Barre: | 10.3% (37) |
| New York: | 4.1% (114,108) |
Number of families with income $40k - 50k:| Barre: | 11.8% (43) |
| New York: | 4.7% (130,902) |
Number of families with income $50k - 60k:| Barre: | 7.1% (26) |
| New York: | 4.9% (135,118) |
Number of families with income $60k - 75k:| Barre: | 15.5% (56) |
| New York: | 7.8% (216,254) |
Number of families with income $75k - 100k:| Barre: | 16.9% (61) |
| State: | 12.4% (342,382) |
Number of families with income $100k - 125k:| Barre: | 10.1% (36) |
| State: | 11.4% (314,917) |
Number of families with income $125k - 150k:| Barre: | 6.1% (22) |
| State: | 9.4% (260,489) |
Number of families with income $150k - 200k:| Barre: | 5.4% (19) |
| State: | 13.2% (365,586) |
Number of families with income > $200k:| Barre: | 6.9% (25) |
| State: | 23.2% (642,319) |
Median non-family income in Barre in 2022:| Barre: | $47,291 |
| State: | $54,783 |
Change in median non-family income between 2000 and 2022:| Barre, New York: | +83.9% |
| State: | +87.9% |
Median per capita income in Barre in 2022:| Barre: | $36,360 |
| New York: | $57,640 |
Change in median per capita income between 2000 and 2022:| Barre, New York: | +111.0% |
| New York: | +111.6% |
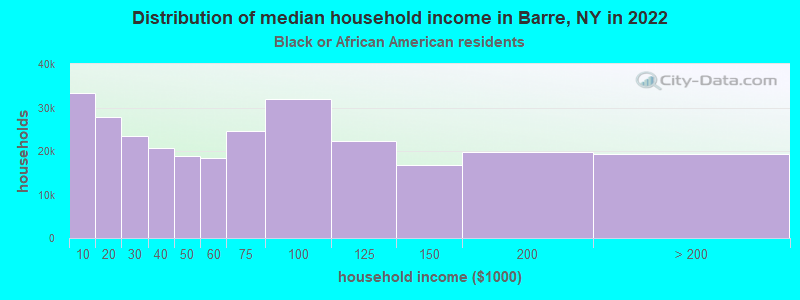
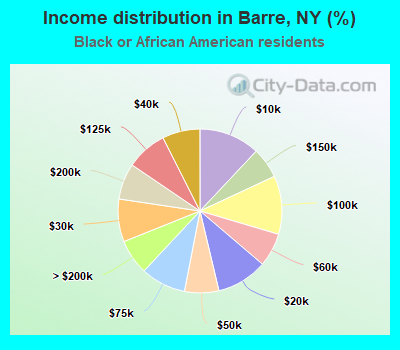
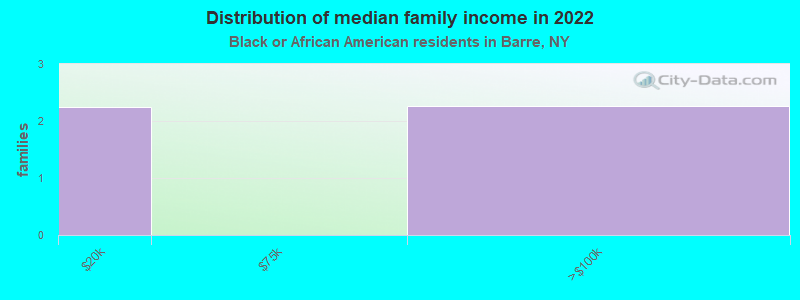
Income statistics for Black or African American residents
Median household income in Barre, NY in 2022:| Barre: | $32,531 |
| State: | $57,898 |
Change in median household income between 2000 and 2022:| Barre, New York: | +100.2% |
| State: | +84.6% |
Number of households with income < $10k:| Barre: | 12.0% (33,315) |
| State: | 12.0% (128,500) |
Number of households with income $10k - 20k:| Barre: | 10.0% (27,853) |
| New York: | 10.0% (107,541) |
Number of households with income $20k - 30k:| Barre: | 8.4% (23,376) |
| State: | 8.4% (90,192) |
Number of households with income $30k - 40k:| Barre: | 7.4% (20,603) |
| State: | 7.4% (79,579) |
Number of households with income $40k - 50k:| Barre: | 6.8% (18,786) |
| State: | 6.8% (72,491) |
Number of households with income $50k - 60k:| Barre: | 6.6% (18,425) |
| New York: | 6.7% (71,309) |
Number of households with income $60k - 75k:| Barre: | 8.9% (24,632) |
| State: | 8.9% (95,050) |
Number of households with income $75k - 100k:| Barre: | 11.5% (31,960) |
| New York: | 11.5% (123,569) |
Number of households with income $100k - 125k:| Barre: | 8.1% (22,374) |
| State: | 8.1% (86,632) |
Number of households with income $125k - 150k:| Barre: | 6.1% (16,786) |
| State: | 6.0% (64,788) |
Number of households with income $150k - 200k:| Barre: | 7.1% (19,807) |
| State: | 7.2% (76,644) |
Number of households with income > $200k:| Barre: | 7.0% (19,342) |
| State: | 7.0% (75,062) |
Aggregate household income in Barre in 2022: $4,573,254
Median family income in Barre in 2022:| Barre: | $32,199 |
| State: | $72,528 |
Median per capita income in Barre in 2022:| Barre: | $29,280 |
| State: | $31,947 |
Change in median per capita income between 2000 and 2022:| Barre, New York: | +99.4% |
| State: | +106.1% |
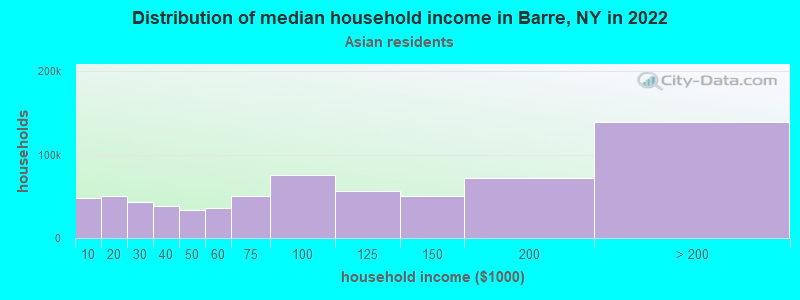
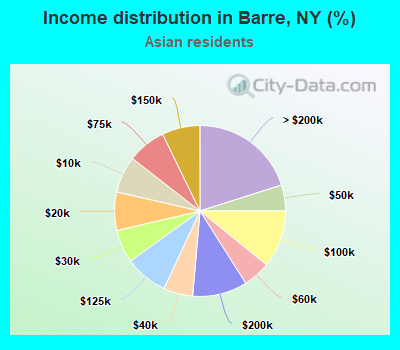
Income statistics for Asian residents
Median household income in Barre, NY in 2022:| Barre: | $181,296 |
| New York: | $89,947 |
Change in median household income between 2000 and 2022:| Barre, New York: | +77.3% |
| State: | +98.1% |
Number of households with income < $10k:| Barre: | 6.9% (47,900) |
| New York: | 6.9% (42,537) |
Number of households with income $10k - 20k:| Barre: | 7.3% (50,399) |
| State: | 7.3% (44,745) |
Number of households with income $20k - 30k:| Barre: | 6.2% (43,154) |
| New York: | 6.2% (38,249) |
Number of households with income $30k - 40k:| Barre: | 5.5% (38,281) |
| State: | 5.5% (33,993) |
Number of households with income $40k - 50k:| Barre: | 4.9% (33,601) |
| State: | 4.8% (29,795) |
Number of households with income $50k - 60k:| Barre: | 5.2% (35,938) |
| State: | 5.2% (32,100) |
Number of households with income $60k - 75k:| Barre: | 7.3% (50,214) |
| State: | 7.3% (44,615) |
Number of households with income $75k - 100k:| Barre: | 10.9% (75,082) |
| State: | 10.8% (66,687) |
Number of households with income $100k - 125k:| Barre: | 8.2% (56,412) |
| State: | 8.2% (50,233) |
Number of households with income $125k - 150k:| Barre: | 7.2% (49,846) |
| New York: | 7.2% (44,299) |
Number of households with income $150k - 200k:| Barre: | 10.4% (71,715) |
| State: | 10.4% (63,837) |
Number of households with income > $200k:| Barre: | 20.1% (139,173) |
| State: | 20.1% (123,891) |
Aggregate household income in Barre in 2022: $6,972,943
Median family income in Barre in 2022:| Barre: | $186,229 |
| State: | $98,136 |
Median per capita income in Barre in 2022:| Barre: | $86,356 |
| New York: | $46,726 |
Change in median per capita income between 2000 and 2022:| Barre, New York: | +126.5% |
| State: | +126.6% |
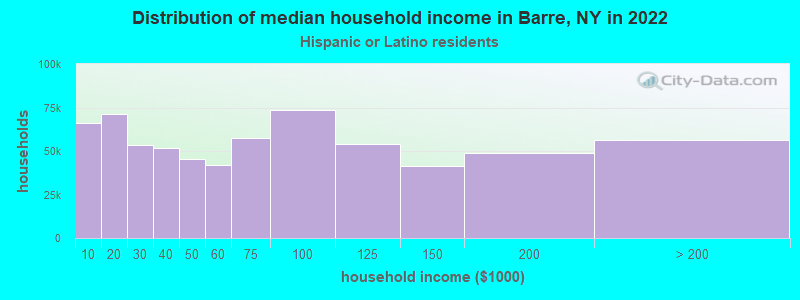
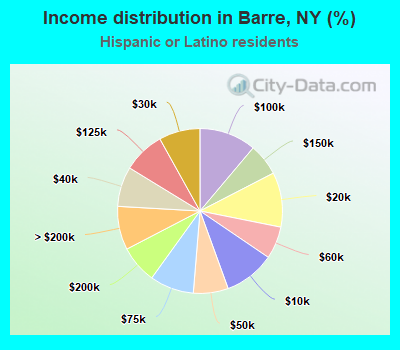
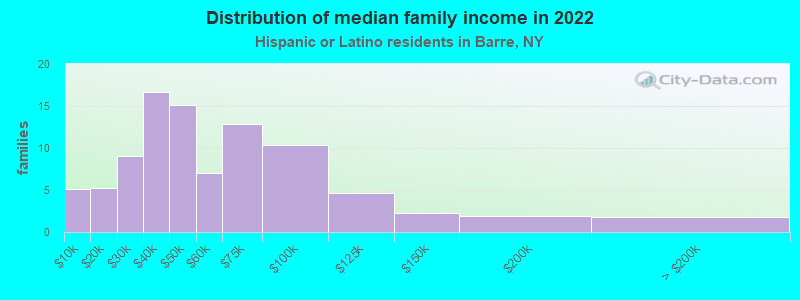
Income statistics for Hispanic or Latino residents
Median household income in Barre, NY in 2022:| Barre: | $62,244 |
| State: | $60,468 |
Change in median household income between 2000 and 2022:| Barre, New York: | +96.6% |
| State: | +98.3% |
Number of households with income < $10k:| Barre: | 10.0% (65,985) |
| State: | 9.9% (127,185) |
Number of households with income $10k - 20k:| Barre: | 10.7% (71,030) |
| State: | 10.7% (136,699) |
Number of households with income $20k - 30k:| Barre: | 8.1% (53,486) |
| State: | 8.1% (102,991) |
Number of households with income $30k - 40k:| Barre: | 7.8% (51,807) |
| New York: | 7.8% (100,149) |
Number of households with income $40k - 50k:| Barre: | 6.8% (45,328) |
| New York: | 6.9% (87,760) |
Number of households with income $50k - 60k:| Barre: | 6.3% (41,974) |
| State: | 6.3% (80,968) |
Number of households with income $60k - 75k:| Barre: | 8.6% (57,211) |
| State: | 8.7% (110,631) |
Number of households with income $75k - 100k:| Barre: | 11.2% (73,847) |
| State: | 11.2% (142,787) |
Number of households with income $100k - 125k:| Barre: | 8.2% (54,113) |
| State: | 8.2% (104,850) |
Number of households with income $125k - 150k:| Barre: | 6.3% (41,519) |
| State: | 6.3% (80,274) |
Number of households with income $150k - 200k:| Barre: | 7.4% (49,083) |
| State: | 7.4% (95,117) |
Number of households with income > $200k:| Barre: | 8.6% (56,606) |
| State: | 8.6% (109,514) |
Aggregate household income in Barre in 2022: $7,196,253
Median family income in Barre in 2022:| Barre: | $67,153 |
| New York: | $68,770 |
Number of families with income < $10k:| Barre: | 5.6% (5) |
| State: | 6.9% (58,565) |
Number of families with income $10k - 20k:| Barre: | 5.7% (5) |
| New York: | 7.0% (59,058) |
Number of families with income $20k - 30k:| Barre: | 9.9% (9) |
| State: | 8.0% (68,048) |
Number of families with income $30k - 40k:| Barre: | 18.1% (17) |
| State: | 8.4% (70,668) |
Number of families with income $40k - 50k:| Barre: | 16.4% (15) |
| State: | 7.4% (62,941) |
Number of families with income $50k - 60k:| Barre: | 7.7% (7) |
| State: | 6.6% (55,592) |
Number of families with income $60k - 75k:| Barre: | 13.9% (13) |
| New York: | 9.3% (78,564) |
Number of families with income $75k - 100k:| Barre: | 11.3% (10) |
| State: | 12.6% (106,685) |
Number of families with income $100k - 125k:| Barre: | 5.0% (5) |
| State: | 9.4% (79,139) |
Number of families with income $125k - 150k:| Barre: | 2.5% (2) |
| New York: | 6.9% (58,255) |
Number of families with income $150k - 200k:| Barre: | 2.1% (2) |
| State: | 8.3% (69,877) |
Number of families with income > $200k:| Barre: | 2.0% (2) |
| State: | 9.3% (78,555) |
Median per capita income in Barre in 2022:| Barre: | $38,949 |
| State: | $29,761 |
Change in median per capita income between 2000 and 2022:| Barre, New York: | +127.3% |
| New York: | +132.7% |
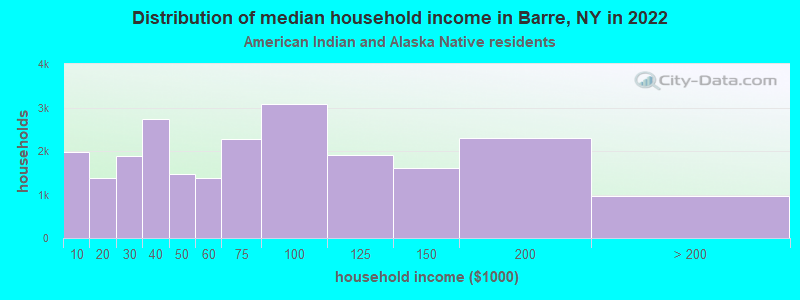
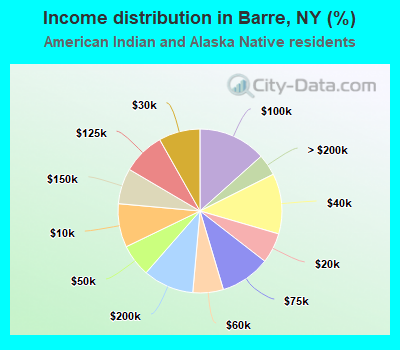
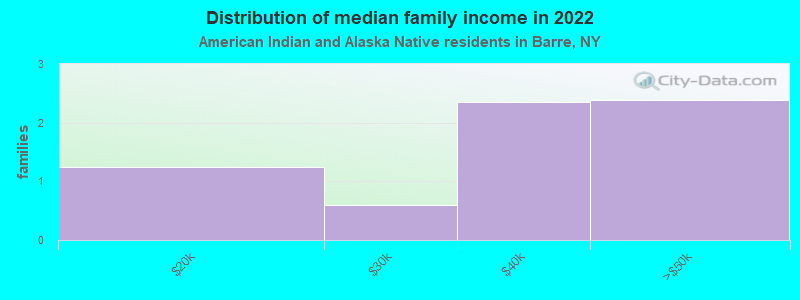
Income statistics for American Indian and Alaska Native residents
Median household income in Barre, NY in 2022:| Barre: | $63,097 |
| State: | $63,208 |
Change in median household income between 2000 and 2022:| Barre, New York: | +90.5% |
| State: | +110.1% |
Number of households with income < $10k:| Barre: | 8.6% (1,978) |
| State: | 8.6% (3,559) |
Number of households with income $10k - 20k:| Barre: | 6.0% (1,373) |
| New York: | 5.9% (2,455) |
Number of households with income $20k - 30k:| Barre: | 8.2% (1,877) |
| State: | 8.2% (3,393) |
Number of households with income $30k - 40k:| Barre: | 11.9% (2,734) |
| State: | 11.9% (4,918) |
Number of households with income $40k - 50k:| Barre: | 6.4% (1,469) |
| State: | 6.5% (2,682) |
Number of households with income $50k - 60k:| Barre: | 6.0% (1,382) |
| State: | 6.1% (2,516) |
Number of households with income $60k - 75k:| Barre: | 9.9% (2,272) |
| State: | 10.0% (4,125) |
Number of households with income $75k - 100k:| Barre: | 13.4% (3,072) |
| New York: | 13.3% (5,517) |
Number of households with income $100k - 125k:| Barre: | 8.4% (1,918) |
| New York: | 8.4% (3,463) |
Number of households with income $125k - 150k:| Barre: | 7.0% (1,613) |
| New York: | 7.0% (2,887) |
Number of households with income $150k - 200k:| Barre: | 10.0% (2,298) |
| State: | 9.9% (4,106) |
Number of households with income > $200k:| Barre: | 4.2% (971) |
| New York: | 4.2% (1,744) |
Aggregate household income in Barre in 2022: $723,624
Median family income in Barre in 2022:| Barre: | $66,998 |
| State: | $69,721 |
Median per capita income in Barre in 2022:| Barre: | $27,131 |
| State: | $25,837 |
Change in median per capita income between 2000 and 2022:| Barre, New York: | +75.0% |
| New York: | +99.6% |
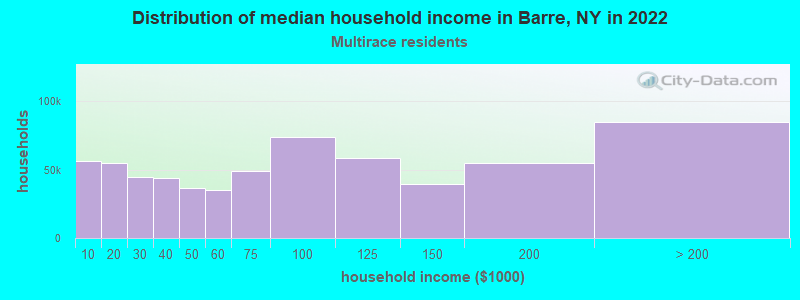
Income statistics for Multirace residents
Median household income in Barre, NY in 2022:| Barre: | $138,048 |
| State: | $73,557 |
Change in median household income between 2000 and 2022:| Barre, New York: | +116.5% |
| New York: | +123.9% |
Number of households with income < $10k:| Barre: | 8.9% (56,271) |
| State: | 8.9% (57,924) |
Number of households with income $10k - 20k:| Barre: | 8.7% (54,879) |
| State: | 8.7% (56,590) |
Number of households with income $20k - 30k:| Barre: | 7.1% (44,859) |
| State: | 7.1% (46,287) |
Number of households with income $30k - 40k:| Barre: | 6.9% (43,694) |
| State: | 6.9% (45,132) |
Number of households with income $40k - 50k:| Barre: | 5.8% (36,666) |
| State: | 5.8% (37,946) |
Number of households with income $50k - 60k:| Barre: | 5.6% (35,228) |
| State: | 5.6% (36,410) |
Number of households with income $60k - 75k:| Barre: | 7.8% (49,140) |
| New York: | 7.8% (50,819) |
Number of households with income $75k - 100k:| Barre: | 11.7% (73,636) |
| State: | 11.7% (76,024) |
Number of households with income $100k - 125k:| Barre: | 9.3% (58,597) |
| State: | 9.3% (60,635) |
Number of households with income $125k - 150k:| Barre: | 6.2% (39,263) |
| State: | 6.2% (40,533) |
Number of households with income $150k - 200k:| Barre: | 8.6% (54,617) |
| State: | 8.6% (56,409) |
Number of households with income > $200k:| Barre: | 13.4% (84,792) |
| State: | 13.4% (87,442) |
Aggregate household income in Barre in 2022: $2,815,097
Median family income in Barre in 2022:| Barre: | $108,030 |
| State: | $85,788 |
Median per capita income in Barre in 2022:| Barre: | $12,486 |
| New York: | $36,931 |
Income statistics for other residents
Number of households with income < $10k:| Barre: | 11.8% (4) |
| New York: | 10.3% (69,252) |
Number of households with income $10k - 20k:| Barre: | 8.8% (3) |
| State: | 11.0% (73,890) |
Number of households with income $20k - 30k:| Barre: | 5.9% (2) |
| New York: | 8.8% (59,096) |
Number of households with income $30k - 40k:| Barre: | 5.9% (2) |
| State: | 8.1% (54,418) |
Number of households with income $40k - 50k:| Barre: | 8.8% (3) |
| State: | 7.3% (49,042) |
Number of households with income $50k - 60k:| Barre: | 5.9% (2) |
| State: | 6.5% (43,945) |
Number of households with income $60k - 75k:| Barre: | 8.8% (3) |
| State: | 9.5% (64,087) |
Number of households with income $75k - 100k:| Barre: | 11.8% (4) |
| State: | 10.9% (73,094) |
Number of households with income $100k - 125k:| Barre: | 8.8% (3) |
| New York: | 7.9% (53,055) |
Number of households with income $125k - 150k:| Barre: | 5.9% (2) |
| State: | 5.9% (39,446) |
Number of households with income $150k - 200k:| Barre: | 8.8% (3) |
| State: | 7.2% (48,653) |
Number of households with income > $200k:| Barre: | 8.8% (3) |
| State: | 6.6% (44,703) |
Aggregate household income in Barre in 2022: $3,133,413
Median family income in Barre in 2022:| Barre: | $73,765 |
| State: | $63,465 |
Median per capita income in Barre in 2022:| Barre: | $58,781 |
| State: | $26,975 |
Change in median per capita income between 2000 and 2022:| Barre, New York: | +132.7% |
| State: | +144.6% |