Bluetown-Iglesia Antigua, Texas (TX) income map, earnings map, and wages data
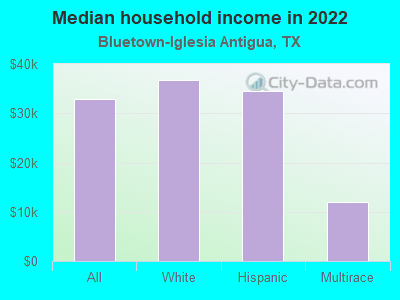
The median household income in Bluetown-Iglesia Antigua, TX in 2022 was $32,837, which was 120.1% less than the median annual income of $72,284 across the entire state of Texas. Compared to the median income of $16,957 in 2000 this represents an increase of 48.4%. The per capita income in 2022 was $13,835, which means an increase of 49.7% compared to 2000 when it was $6,960.
Income statistics for all residents
Median household income in Bluetown-Iglesia Antigua, TX in 2022:| Bluetown-Iglesia Antigua: | $32,837 |
| State: | $72,284 |
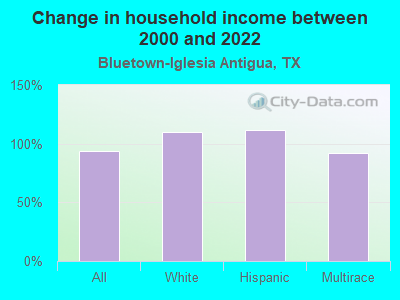
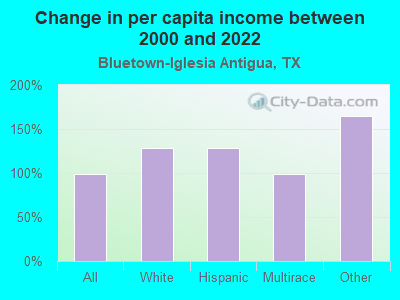
Change in median household income between 2000 and 2022:| Bluetown-Iglesia Antigua, Texas: | +93.6% |
| State: | +81.0% |
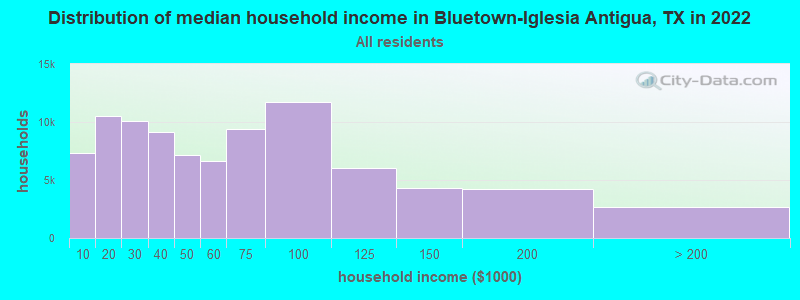
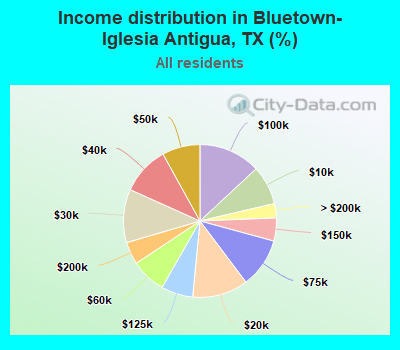
Number of households with income < $10k:| Bluetown-Iglesia Antigua: | 8.2% (7,368) |
| State: | 5.5% (611,011) |
Number of households with income $10k - 20k:| Bluetown-Iglesia Antigua: | 11.8% (10,549) |
| State: | 6.7% (743,157) |
Number of households with income $20k - 30k:| Bluetown-Iglesia Antigua: | 11.3% (10,073) |
| State: | 7.2% (803,381) |
Number of households with income $30k - 40k:| Bluetown-Iglesia Antigua: | 10.3% (9,175) |
| Texas: | 7.8% (866,080) |
Number of households with income $40k - 50k:| Bluetown-Iglesia Antigua: | 8.0% (7,182) |
| State: | 7.3% (810,440) |
Number of households with income $50k - 60k:| Bluetown-Iglesia Antigua: | 7.4% (6,651) |
| State: | 7.2% (799,783) |
Number of households with income $60k - 75k:| Bluetown-Iglesia Antigua: | 10.5% (9,416) |
| State: | 9.9% (1,095,384) |
Number of households with income $75k - 100k:| Bluetown-Iglesia Antigua: | 13.1% (11,719) |
| Texas: | 12.8% (1,419,057) |
Number of households with income $100k - 125k:| Bluetown-Iglesia Antigua: | 6.7% (5,999) |
| State: | 9.5% (1,054,577) |
Number of households with income $125k - 150k:| Bluetown-Iglesia Antigua: | 4.9% (4,352) |
| State: | 6.7% (741,518) |
Number of households with income $150k - 200k:| Bluetown-Iglesia Antigua: | 4.8% (4,260) |
| State: | 8.7% (961,776) |
Number of households with income > $200k:| Bluetown-Iglesia Antigua: | 3.0% (2,715) |
| State: | 10.7% (1,181,544) |
Aggregate household income in Bluetown-Iglesia Antigua in 2022: $18,835,964
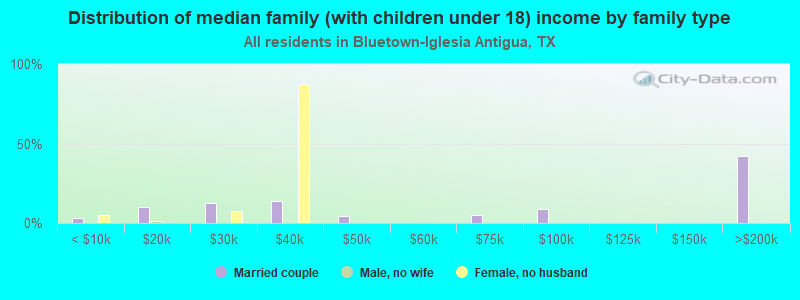
Median family income in Bluetown-Iglesia Antigua in 2022:| Bluetown-Iglesia Antigua: | $34,951 |
| State: | $86,267 |
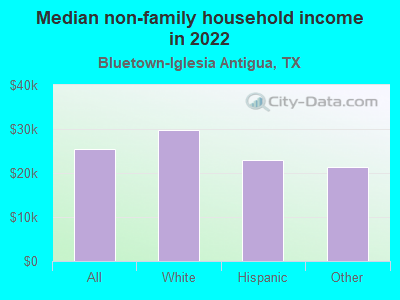
Median non-family income in Bluetown-Iglesia Antigua in 2022:| Bluetown-Iglesia Antigua: | $25,341 |
| State: | $45,999 |
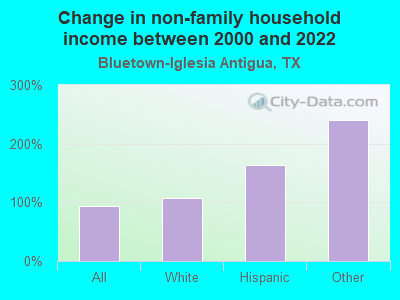
Change in median non-family income between 2000 and 2022:| Bluetown-Iglesia Antigua, Texas: | +93.1% |
| Texas: | +79.5% |
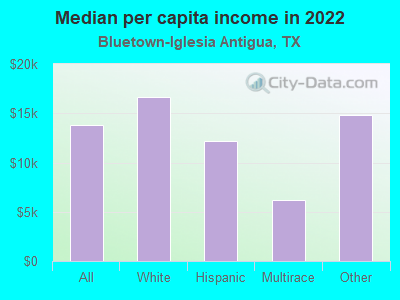
Median per capita income in Bluetown-Iglesia Antigua in 2022:| Bluetown-Iglesia Antigua: | $13,836 |
| Texas: | $38,123 |
Change in median per capita income between 2000 and 2022:| Bluetown-Iglesia Antigua, Texas: | +98.8% |
| State: | +94.3% |
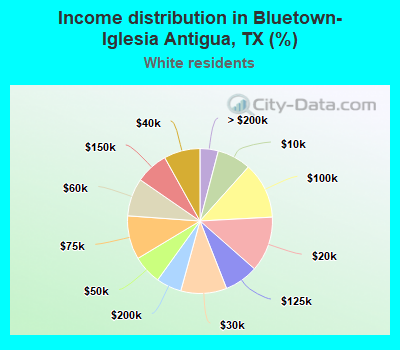
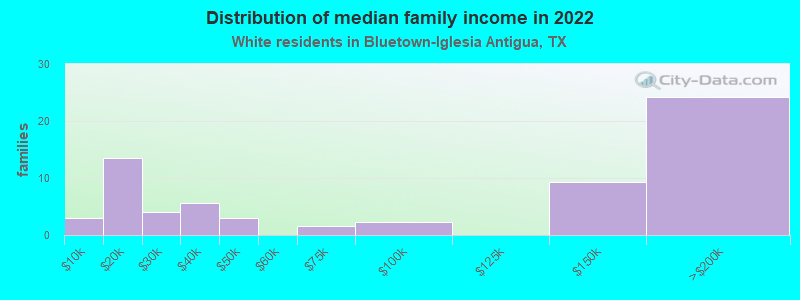
Income statistics for White residents
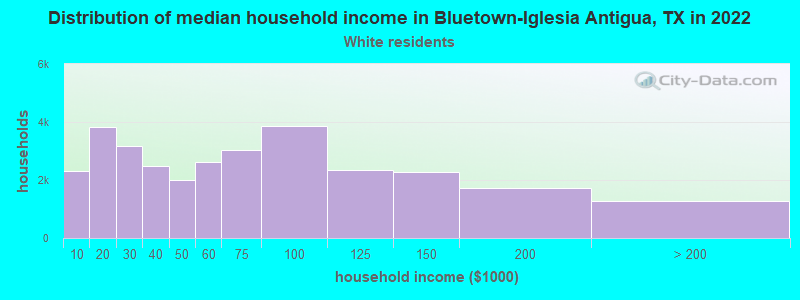
Median household income in Bluetown-Iglesia Antigua, TX in 2022:| Bluetown-Iglesia Antigua: | $36,803 |
| State: | $82,032 |
Change in median household income between 2000 and 2022:| Bluetown-Iglesia Antigua, Texas: | +110.3% |
| State: | +91.0% |
Number of households with income < $10k:| Bluetown-Iglesia Antigua: | 7.5% (2,327) |
| State: | 4.7% (273,716) |
Number of households with income $10k - 20k:| Bluetown-Iglesia Antigua: | 12.3% (3,811) |
| State: | 5.5% (322,702) |
Number of households with income $20k - 30k:| Bluetown-Iglesia Antigua: | 10.2% (3,164) |
| State: | 6.2% (363,947) |
Number of households with income $30k - 40k:| Bluetown-Iglesia Antigua: | 8.1% (2,492) |
| State: | 6.8% (399,275) |
Number of households with income $40k - 50k:| Bluetown-Iglesia Antigua: | 6.5% (1,994) |
| Texas: | 6.5% (383,417) |
Number of households with income $50k - 60k:| Bluetown-Iglesia Antigua: | 8.5% (2,613) |
| State: | 6.6% (388,535) |
Number of households with income $60k - 75k:| Bluetown-Iglesia Antigua: | 9.8% (3,021) |
| Texas: | 9.7% (566,295) |
Number of households with income $75k - 100k:| Bluetown-Iglesia Antigua: | 12.5% (3,870) |
| State: | 13.0% (760,276) |
Number of households with income $100k - 125k:| Bluetown-Iglesia Antigua: | 7.5% (2,329) |
| State: | 10.2% (597,596) |
Number of households with income $125k - 150k:| Bluetown-Iglesia Antigua: | 7.3% (2,259) |
| State: | 7.4% (436,830) |
Number of households with income $150k - 200k:| Bluetown-Iglesia Antigua: | 5.6% (1,741) |
| State: | 9.9% (583,067) |
Number of households with income > $200k:| Bluetown-Iglesia Antigua: | 4.1% (1,264) |
| Texas: | 13.5% (792,647) |
Aggregate household income in Bluetown-Iglesia Antigua in 2022: $6,685,369
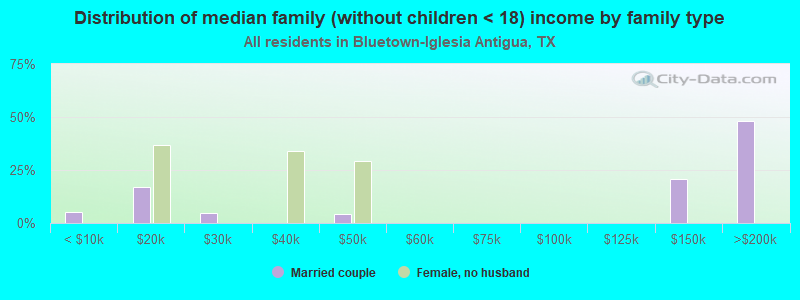
Median family income in Bluetown-Iglesia Antigua in 2022:| Bluetown-Iglesia Antigua: | $38,791 |
| State: | $101,788 |
Number of families with income < $10k:| Bluetown-Iglesia Antigua: | 4.5% (3) |
| State: | 2.8% (108,142) |
Number of families with income $10k - 20k:| Bluetown-Iglesia Antigua: | 20.4% (14) |
| Texas: | 2.9% (113,421) |
Number of families with income $20k - 30k:| Bluetown-Iglesia Antigua: | 6.0% (4) |
| State: | 4.1% (157,688) |
Number of families with income $30k - 40k:| Bluetown-Iglesia Antigua: | 8.4% (6) |
| State: | 5.2% (198,847) |
Number of families with income $40k - 50k:| Bluetown-Iglesia Antigua: | 4.4% (3) |
| State: | 5.6% (216,490) |
Number of families with income $60k - 75k:| Bluetown-Iglesia Antigua: | 2.4% (2) |
| Texas: | 9.0% (346,106) |
Number of families with income $75k - 100k:| Bluetown-Iglesia Antigua: | 3.4% (2) |
| State: | 13.7% (527,363) |
Number of families with income $125k - 150k:| Bluetown-Iglesia Antigua: | 14.0% (9) |
| State: | 9.2% (355,798) |
Number of families with income $150k - 200k:| Bluetown-Iglesia Antigua: | 36.5% (24) |
| State: | 12.5% (480,185) |
Median non-family income in Bluetown-Iglesia Antigua in 2022:| Bluetown-Iglesia Antigua: | $29,689 |
| Texas: | $50,587 |
Change in median non-family income between 2000 and 2022:| Bluetown-Iglesia Antigua, Texas: | +106.5% |
| State: | +87.7% |
Median per capita income in Bluetown-Iglesia Antigua in 2022:| Bluetown-Iglesia Antigua: | $16,633 |
| State: | $47,740 |
Change in median per capita income between 2000 and 2022:| Bluetown-Iglesia Antigua, Texas: | +127.8% |
| State: | +114.3% |
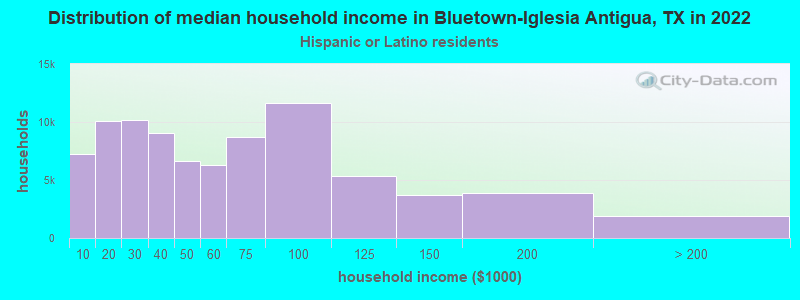
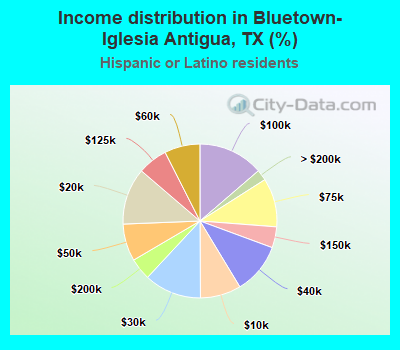
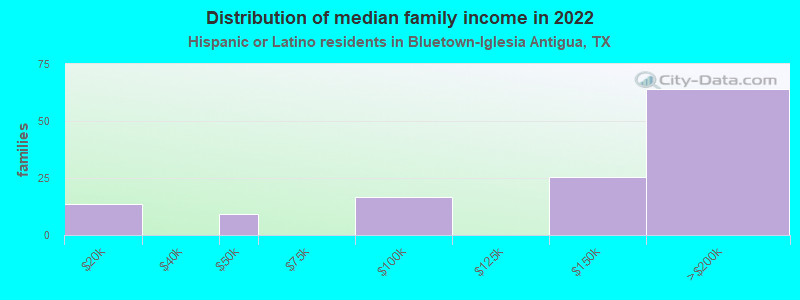
Income statistics for Hispanic or Latino residents
Median household income in Bluetown-Iglesia Antigua, TX in 2022:| Bluetown-Iglesia Antigua: | $34,517 |
| State: | $60,504 |
Change in median household income between 2000 and 2022:| Bluetown-Iglesia Antigua, Texas: | +112.4% |
| State: | +102.5% |
Number of households with income < $10k:| Bluetown-Iglesia Antigua: | 8.6% (7,255) |
| Texas: | 5.8% (213,953) |
Number of households with income $10k - 20k:| Bluetown-Iglesia Antigua: | 11.9% (10,076) |
| Texas: | 8.0% (297,456) |
Number of households with income $20k - 30k:| Bluetown-Iglesia Antigua: | 12.0% (10,182) |
| Texas: | 9.2% (340,166) |
Number of households with income $30k - 40k:| Bluetown-Iglesia Antigua: | 10.7% (9,071) |
| State: | 9.5% (354,336) |
Number of households with income $40k - 50k:| Bluetown-Iglesia Antigua: | 7.8% (6,642) |
| Texas: | 8.8% (327,013) |
Number of households with income $50k - 60k:| Bluetown-Iglesia Antigua: | 7.5% (6,326) |
| State: | 8.3% (308,818) |
Number of households with income $60k - 75k:| Bluetown-Iglesia Antigua: | 10.3% (8,689) |
| State: | 10.9% (405,109) |
Number of households with income $75k - 100k:| Bluetown-Iglesia Antigua: | 13.7% (11,610) |
| Texas: | 13.8% (511,639) |
Number of households with income $100k - 125k:| Bluetown-Iglesia Antigua: | 6.3% (5,302) |
| State: | 8.6% (319,728) |
Number of households with income $125k - 150k:| Bluetown-Iglesia Antigua: | 4.4% (3,733) |
| Texas: | 5.7% (210,932) |
Number of households with income $150k - 200k:| Bluetown-Iglesia Antigua: | 4.6% (3,895) |
| State: | 6.4% (236,055) |
Number of households with income > $200k:| Bluetown-Iglesia Antigua: | 2.3% (1,920) |
| State: | 5.1% (189,259) |
Aggregate household income in Bluetown-Iglesia Antigua in 2022: $10,681,919
Median family income in Bluetown-Iglesia Antigua in 2022:| Bluetown-Iglesia Antigua: | $36,299 |
| State: | $65,080 |
Number of families with income $10k - 20k:| Bluetown-Iglesia Antigua: | 10.5% (14) |
| State: | 6.3% (174,531) |
Number of families with income $40k - 50k:| Bluetown-Iglesia Antigua: | 7.2% (9) |
| State: | 8.6% (240,188) |
Number of families with income $75k - 100k:| Bluetown-Iglesia Antigua: | 12.8% (17) |
| State: | 14.3% (398,554) |
Number of families with income $125k - 150k:| Bluetown-Iglesia Antigua: | 19.9% (26) |
| Texas: | 6.2% (171,274) |
Number of families with income $150k - 200k:| Bluetown-Iglesia Antigua: | 49.6% (64) |
| State: | 7.3% (202,259) |
Median non-family income in Bluetown-Iglesia Antigua in 2022:| Bluetown-Iglesia Antigua: | $22,973 |
| State: | $39,934 |
Median per capita income in Bluetown-Iglesia Antigua in 2022:| Bluetown-Iglesia Antigua: | $12,182 |
| State: | $24,862 |
Change in median per capita income between 2000 and 2022:| Bluetown-Iglesia Antigua, Texas: | +128.2% |
| State: | +130.8% |
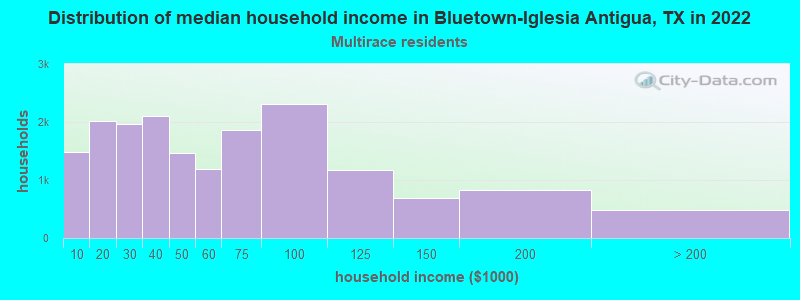
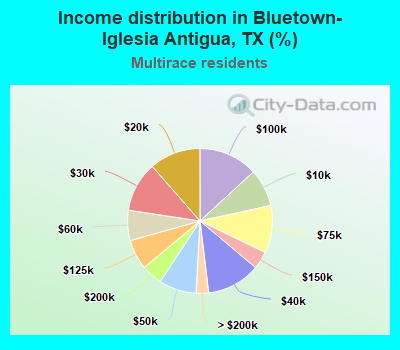
Income statistics for Multirace residents
Median household income in Bluetown-Iglesia Antigua, TX in 2022:| Bluetown-Iglesia Antigua: | $12,026 |
| State: | $62,748 |
Change in median household income between 2000 and 2022:| Bluetown-Iglesia Antigua, Texas: | +92.4% |
| State: | +92.3% |
Number of households with income < $10k:| Bluetown-Iglesia Antigua: | 8.4% (1,482) |
| Texas: | 5.5% (122,324) |
Number of households with income $10k - 20k:| Bluetown-Iglesia Antigua: | 11.4% (2,009) |
| Texas: | 8.2% (182,232) |
Number of households with income $20k - 30k:| Bluetown-Iglesia Antigua: | 11.2% (1,967) |
| State: | 8.5% (189,456) |
Number of households with income $30k - 40k:| Bluetown-Iglesia Antigua: | 12.0% (2,104) |
| Texas: | 8.9% (197,499) |
Number of households with income $40k - 50k:| Bluetown-Iglesia Antigua: | 8.4% (1,474) |
| State: | 8.7% (191,735) |
Number of households with income $50k - 60k:| Bluetown-Iglesia Antigua: | 6.7% (1,186) |
| State: | 8.0% (177,535) |
Number of households with income $60k - 75k:| Bluetown-Iglesia Antigua: | 10.6% (1,863) |
| State: | 10.5% (232,479) |
Number of households with income $75k - 100k:| Bluetown-Iglesia Antigua: | 13.2% (2,313) |
| State: | 13.1% (290,448) |
Number of households with income $100k - 125k:| Bluetown-Iglesia Antigua: | 6.7% (1,176) |
| State: | 8.6% (191,595) |
Number of households with income $125k - 150k:| Bluetown-Iglesia Antigua: | 3.9% (694) |
| Texas: | 6.0% (133,361) |
Number of households with income $150k - 200k:| Bluetown-Iglesia Antigua: | 4.7% (827) |
| State: | 7.2% (159,195) |
Number of households with income > $200k:| Bluetown-Iglesia Antigua: | 2.8% (490) |
| State: | 6.7% (148,064) |
Aggregate household income in Bluetown-Iglesia Antigua in 2022: $769,104
Median family income in Bluetown-Iglesia Antigua in 2022:| Bluetown-Iglesia Antigua: | $12,872 |
| State: | $69,780 |
Number of families with income < $10k:| Bluetown-Iglesia Antigua: | 100.0% (16) |
| State: | 4.4% (70,825) |
Median per capita income in Bluetown-Iglesia Antigua in 2022:| Bluetown-Iglesia Antigua: | $6,227 |
| State: | $26,785 |
Change in median per capita income between 2000 and 2022:| Bluetown-Iglesia Antigua, Texas: | +98.6% |
| State: | +110.9% |
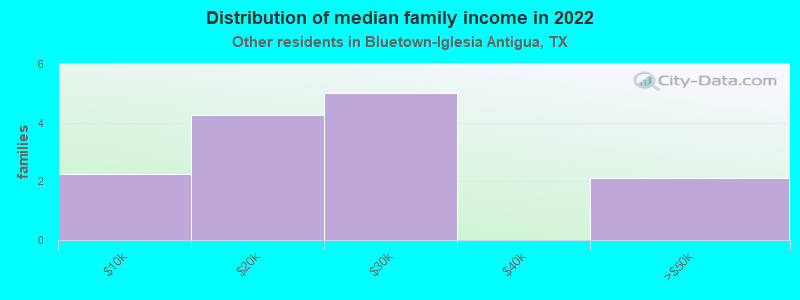
Income statistics for other residents
Number of households with income < $10k:| Bluetown-Iglesia Antigua: | 11.8% (2) |
| State: | 5.9% (54,162) |
Number of households with income $10k - 20k:| Bluetown-Iglesia Antigua: | 11.8% (2) |
| Texas: | 6.8% (62,891) |
Number of households with income $20k - 30k:| Bluetown-Iglesia Antigua: | 11.8% (2) |
| State: | 10.6% (97,294) |
Number of households with income $30k - 40k:| Bluetown-Iglesia Antigua: | 5.9% (1) |
| State: | 10.8% (99,670) |
Number of households with income $40k - 50k:| Bluetown-Iglesia Antigua: | 11.8% (2) |
| State: | 9.3% (85,548) |
Number of households with income $50k - 60k:| Bluetown-Iglesia Antigua: | 5.9% (1) |
| State: | 9.0% (82,757) |
Number of households with income $60k - 75k:| Bluetown-Iglesia Antigua: | 11.8% (2) |
| State: | 10.9% (100,326) |
Number of households with income $75k - 100k:| Bluetown-Iglesia Antigua: | 17.6% (3) |
| State: | 14.0% (128,767) |
Number of households with income $100k - 125k:| Bluetown-Iglesia Antigua: | 5.9% (1) |
| Texas: | 8.2% (75,218) |
Number of households with income $125k - 150k:| Bluetown-Iglesia Antigua: | 0.0% (0) |
| State: | 4.8% (44,223) |
Number of households with income $150k - 200k:| Bluetown-Iglesia Antigua: | 5.9% (1) |
| State: | 5.6% (51,376) |
Number of households with income > $200k:| Bluetown-Iglesia Antigua: | 0.0% (0) |
| State: | 4.0% (36,393) |
Aggregate household income in Bluetown-Iglesia Antigua in 2022: $1,000,494
Median family income in Bluetown-Iglesia Antigua in 2022:| Bluetown-Iglesia Antigua: | $33,128 |
| State: | $60,064 |
Number of families with income < $10k:| Bluetown-Iglesia Antigua: | 16.6% (2) |
| State: | 6.8% (47,502) |
Number of families with income $10k - 20k:| Bluetown-Iglesia Antigua: | 31.1% (4) |
| Texas: | 6.0% (41,763) |
Number of families with income $20k - 30k:| Bluetown-Iglesia Antigua: | 36.7% (5) |
| State: | 9.9% (68,761) |
Number of families with income $40k - 50k:| Bluetown-Iglesia Antigua: | 15.5% (2) |
| Texas: | 9.0% (62,441) |
Median non-family income in Bluetown-Iglesia Antigua in 2022:| Bluetown-Iglesia Antigua: | $21,311 |
| Texas: | $38,690 |
Median per capita income in Bluetown-Iglesia Antigua in 2022:| Bluetown-Iglesia Antigua: | $14,848 |
| State: | $23,899 |