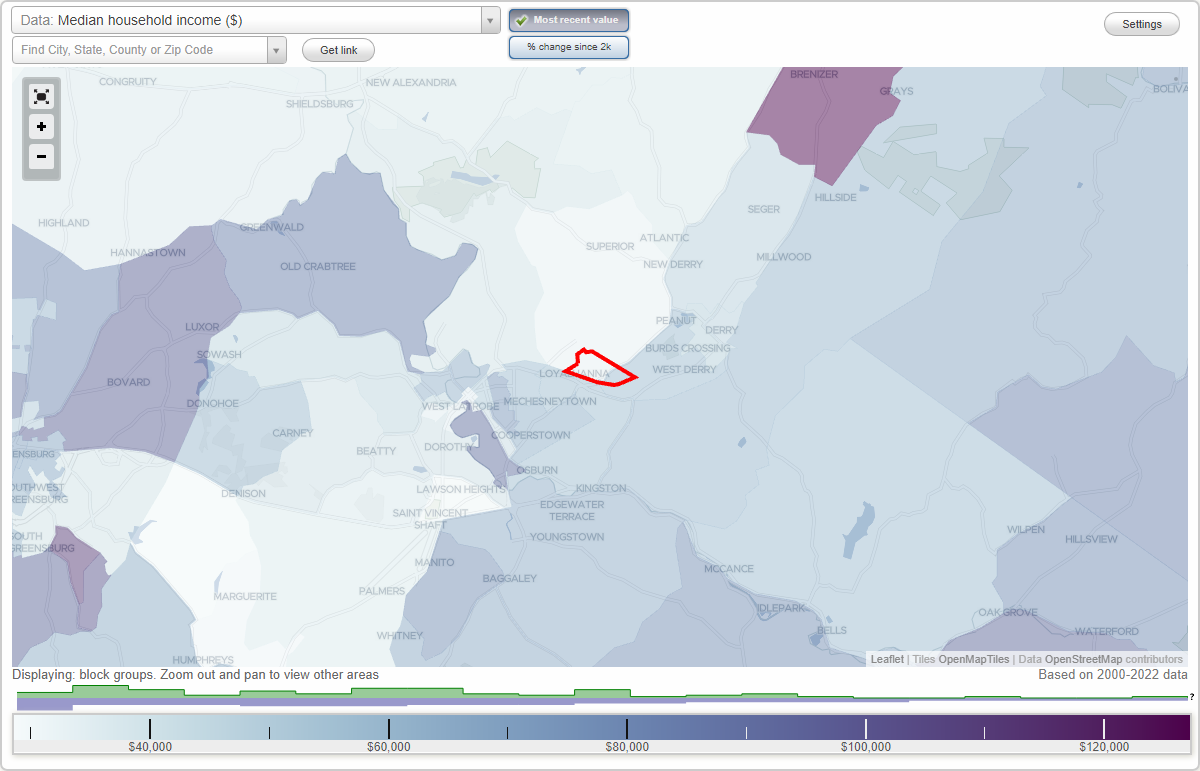
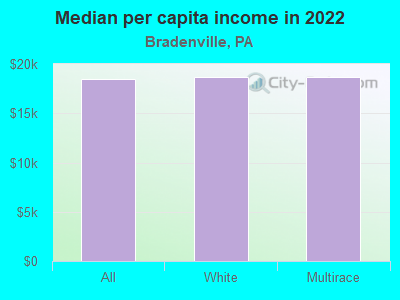
The median household income in Bradenville, PA in 2022 was $49,447, which was 45.2% less than the median annual income of $71,798 across the entire state of Pennsylvania. Compared to the median income of $37,106 in 2000 this represents an increase of 25.0%. The per capita income in 2022 was $18,518, which means a decrease of 6.2% compared to 2000 when it was $19,674.
Whole page based on the data from 2000 / 2022 when the population of Bradenville, Pennsylvania was 545 / 446
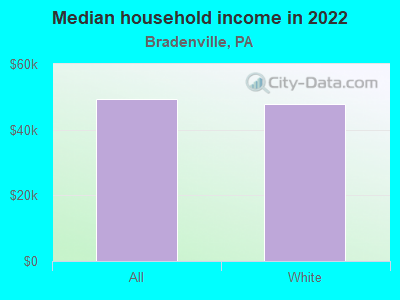
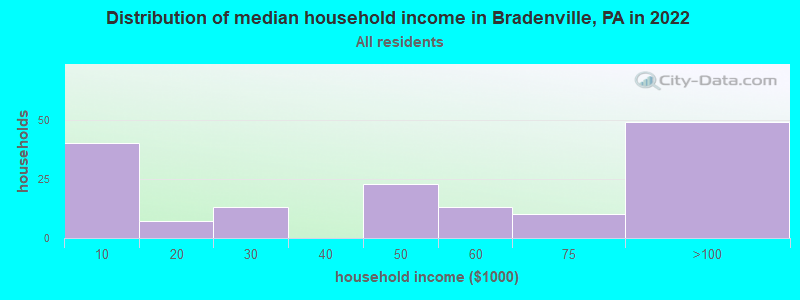
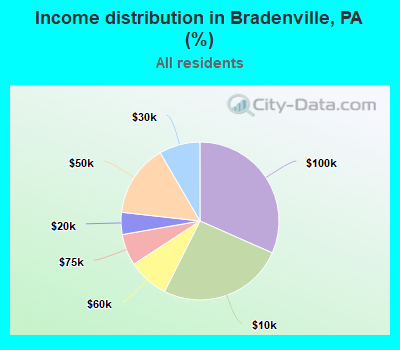
Income statistics for all residents
Median household income in Bradenville, PA in 2022:
Bradenville:
$49,448
Pennsylvania:
$71,798
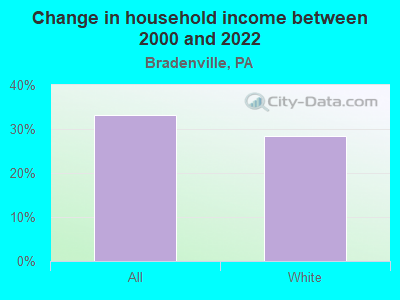
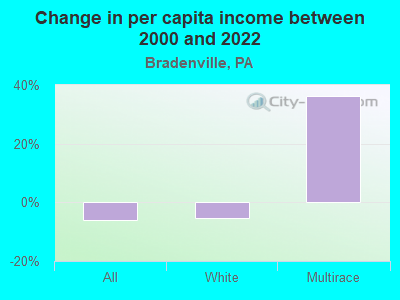
Change in median household income between 2000 and 2022:
Bradenville, Pennsylvania:
+33.3%
State:
+79.0%
Number of households with income < $10k:
Bradenville:
25.8% (40)
State:
5.5% (291,562)
Number of households with income $10k - 20k:
Bradenville:
4.5% (7)
State:
7.3% (384,726)
Number of households with income $20k - 30k:
Bradenville:
8.4% (13)
State:
7.4% (389,464)
Number of households with income $30k - 40k:
Bradenville:
0.0% (0)
State:
7.6% (402,138)
Number of households with income $40k - 50k:
Bradenville:
14.8% (23)
Pennsylvania:
7.3% (387,945)
Number of households with income $50k - 60k:
Bradenville:
8.4% (13)
State:
7.0% (372,468)
Number of households with income $60k - 75k:
Bradenville:
6.5% (10)
Pennsylvania:
9.9% (524,786)
Number of households with income $75k - 100k:
Bradenville:
31.6% (49)
Pennsylvania:
12.6% (666,253)
Number of households with income $100k - 125k:
Bradenville:
0.0% (0)
State:
9.9% (526,402)
Number of households with income $125k - 150k:
Bradenville:
0.0% (0)
Pennsylvania:
6.9% (362,702)
Number of households with income $150k - 200k:
Bradenville:
0.0% (0)
State:
8.3% (440,827)
Number of households with income > $200k:
Bradenville:
0.0% (0)
State:
10.3% (544,792)
Aggregate household income in Bradenville in 2022: $8,007,779
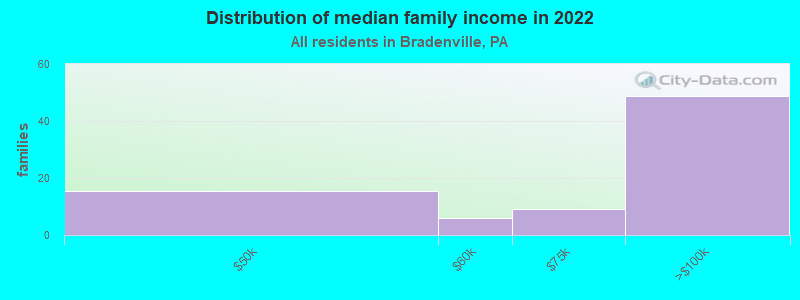
Median family income in Bradenville in 2022:
Bradenville:
$97,522
State:
$93,029
Number of families with income $40k - 50k:
Bradenville:
19.4% (15)
State:
6.4% (211,380)
Number of families with income $50k - 60k:
Bradenville:
7.7% (6)
State:
6.4% (209,910)
Number of families with income $60k - 75k:
Bradenville:
11.7% (9)
State:
9.7% (318,991)
Number of families with income $75k - 100k:
Bradenville:
61.3% (49)
State:
14.0% (461,021)
Median income for families with 0 earners:
Bradenville:
$0
State:
$48,949
Median income for families with 1 earner:
Bradenville:
$0
State:
$64,277
Median income for families with 2 earners:
Bradenville:
$85,600
Pennsylvania:
$118,220
Median income for families with 3+ earners:
Bradenville:
$0
State:
$150,374
Median per capita income in Bradenville in 2022:
Bradenville:
$18,519
State:
$41,489
Change in median per capita income between 2000 and 2022:: -5.9%
Bradenville, Pennsylvania:
-5.9%
State:
+98.7%
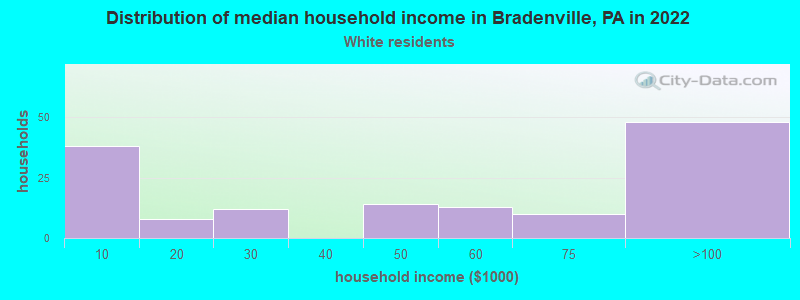
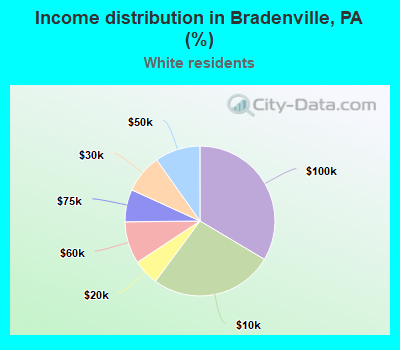
Income statistics for White residents
Median household income in Bradenville, PA in 2022:
Bradenville:
$47,860
State:
$76,765
Change in median household income between 2000 and 2022:
Bradenville, Pennsylvania:
+28.5%
State:
+84.3%
Number of households with income < $10k:
Bradenville:
26.6% (38)
State:
4.3% (179,792)
Number of households with income $10k - 20k:
Bradenville:
5.6% (8)
State:
6.5% (268,738)
Number of households with income $20k - 30k:
Bradenville:
8.4% (12)
State:
7.0% (288,138)
Number of households with income $30k - 40k:
Bradenville:
0.0% (0)
State:
7.2% (300,208)
Number of households with income $40k - 50k:
Bradenville:
9.8% (14)
State:
7.2% (298,756)
Number of households with income $50k - 60k:
Bradenville:
9.1% (13)
State:
6.8% (283,251)
Number of households with income $60k - 75k:
Bradenville:
7.0% (10)
State:
9.9% (408,159)
Number of households with income $75k - 100k:
Bradenville:
33.6% (48)
State:
13.2% (547,809)
Number of households with income $100k - 125k:
Bradenville:
0.0% (0)
State:
10.5% (436,652)
Number of households with income $125k - 150k:
Bradenville:
0.0% (0)
Pennsylvania:
7.3% (304,132)
Number of households with income $150k - 200k:
Bradenville:
0.0% (0)
State:
9.0% (374,658)
Number of households with income > $200k:
Bradenville:
0.0% (0)
State:
10.9% (452,618)
Aggregate household income in Bradenville in 2022: $7,434,702
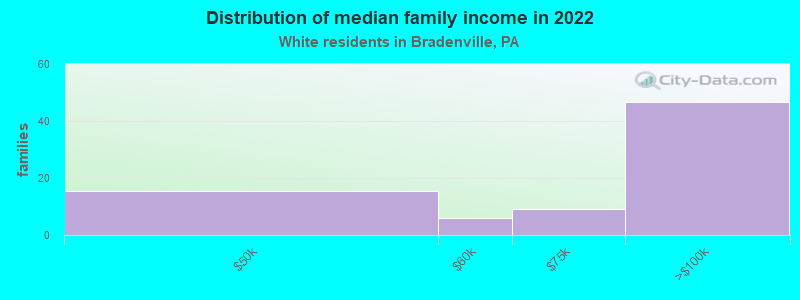
Median family income in Bradenville in 2022:
Bradenville:
$97,105
State:
$99,396
Number of families with income $40k - 50k:
Bradenville:
20.0% (15)
State:
6.0% (154,327)
Number of families with income $50k - 60k:
Bradenville:
7.6% (6)
State:
6.1% (157,983)
Number of families with income $60k - 75k:
Bradenville:
11.9% (9)
State:
9.6% (249,292)
Number of families with income $75k - 100k:
Bradenville:
60.5% (47)
State:
14.7% (379,316)
Median per capita income in Bradenville in 2022:
Bradenville:
$18,714
State:
$45,306
Change in median per capita income between 2000 and 2022:: -5.3%
Bradenville, Pennsylvania:
-5.3%
State:
+105.4%
Income statistics for Multirace residents
Number of households with income < $10k:
Bradenville:
0.0% (0)
Pennsylvania:
7.8% (21,911)
Number of households with income $10k - 20k:
Bradenville:
0.0% (0)
State:
8.2% (22,847)
Number of households with income $20k - 30k:
Bradenville:
0.0% (0)
State:
8.7% (24,252)
Number of households with income $30k - 40k:
Bradenville:
0.0% (0)
State:
7.3% (20,502)
Number of households with income $40k - 50k:
Bradenville:
100.0% (14)
Pennsylvania:
7.7% (21,525)
Number of households with income $50k - 60k:
Bradenville:
0.0% (0)
State:
8.6% (24,174)
Number of households with income $60k - 75k:
Bradenville:
0.0% (0)
State:
11.9% (33,350)
Number of households with income $75k - 100k:
Bradenville:
0.0% (0)
State:
11.5% (32,274)
Number of households with income $100k - 125k:
Bradenville:
0.0% (0)
Pennsylvania:
8.3% (23,361)
Number of households with income $125k - 150k:
Bradenville:
0.0% (0)
State:
5.3% (14,784)
Number of households with income $150k - 200k:
Bradenville:
0.0% (0)
Pennsylvania:
6.9% (19,314)
Number of households with income > $200k:
Bradenville:
0.0% (0)
State:
7.8% (21,759)
Aggregate household income in Bradenville in 2022: $406,034,200
Median per capita income in Bradenville in 2022:
Bradenville:
$18,723
State:
$27,581
Change in median per capita income between 2000 and 2022:
Bradenville, Pennsylvania:
+36.3%
State:
+139.6%
Discuss Bradenville, Pennsylvania (PA) on our hugely popular Pennsylvania forum.