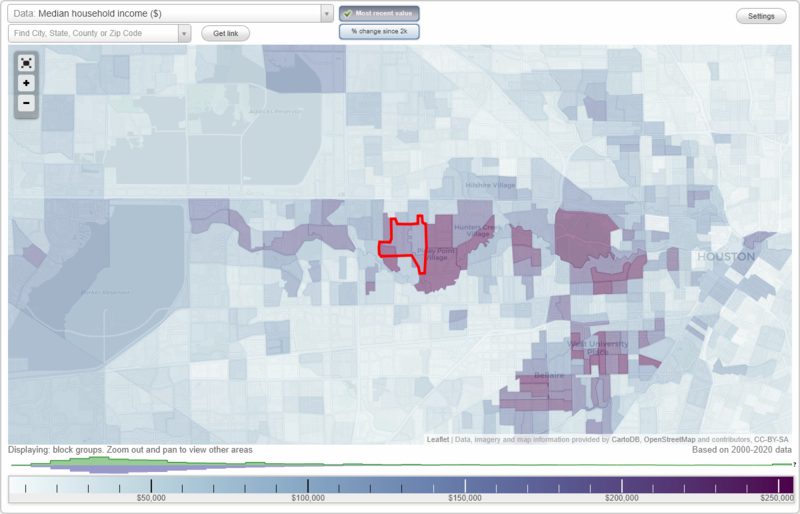
The median household income in Bunker Hill Village, TX in 2022 was $242,644, which was 70.2% greater than the median annual income of $72,284 across the entire state of Texas. Compared to the median income of $177,274 in 2000 this represents an increase of 26.9%. The per capita income in 2022 was $131,666, which means an increase of 34.4% compared to 2000 when it was $86,434.
Whole page based on the data from 2000 / 2022 when the population of Bunker Hill Village, Texas was 3,654 / 3,864
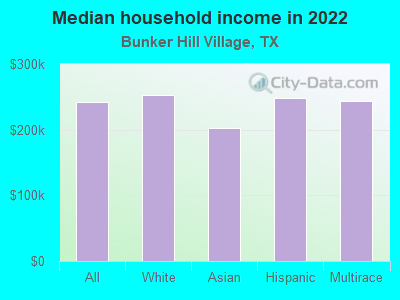
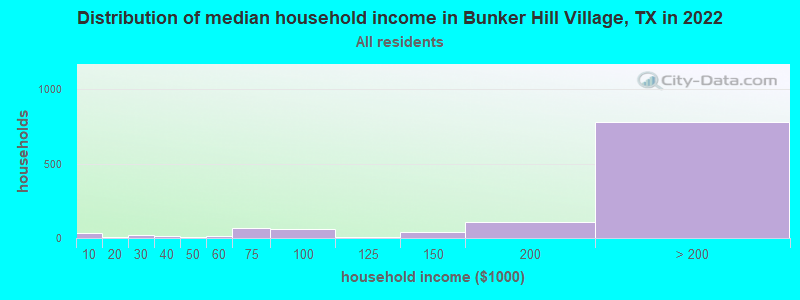
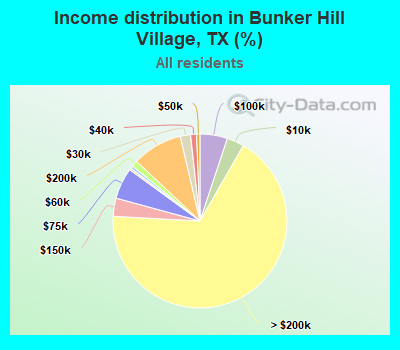
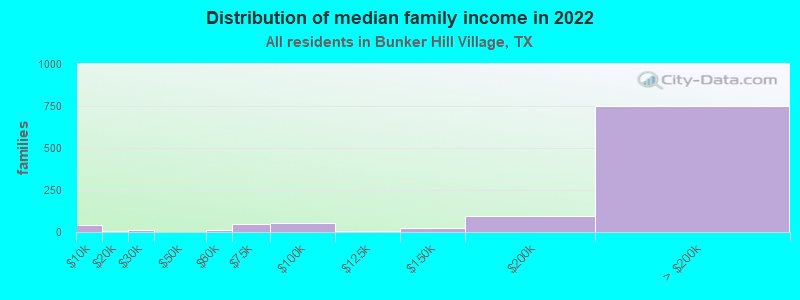
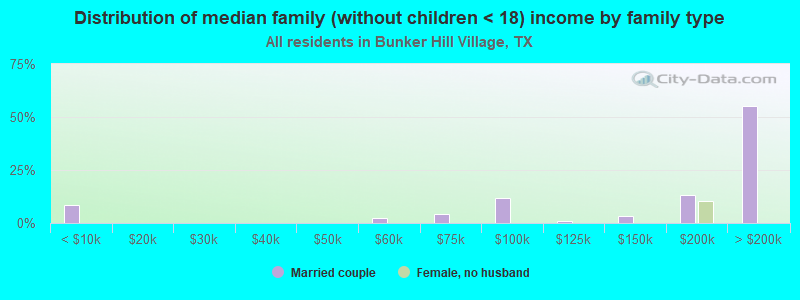
Income statistics for all residents
Median household income in Bunker Hill Village, TX in 2022:
Bunker Hill Village:
$242,645
State:
$72,284
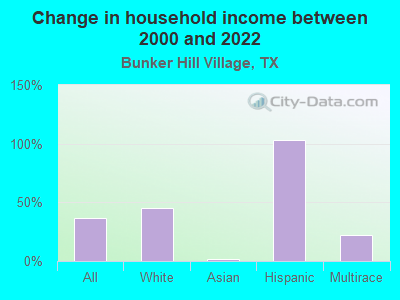
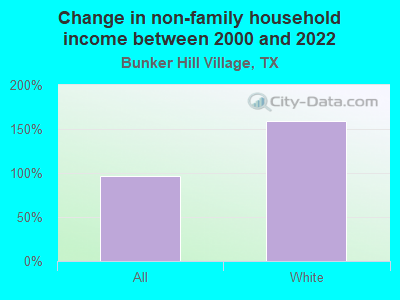
Change in median household income between 2000 and 2022:
Bunker Hill Village, Texas:
+36.9%
State:
+81.0%
Number of households with income < $10k:
Bunker Hill Village:
3.2% (37)
State:
5.5% (611,011)
Number of households with income $10k - 20k:
Bunker Hill Village:
0.3% (4)
State:
6.7% (743,157)
Number of households with income $20k - 30k:
Bunker Hill Village:
1.9% (22)
State:
7.2% (803,381)
Number of households with income $30k - 40k:
Bunker Hill Village:
1.1% (13)
State:
7.8% (866,080)
Number of households with income $40k - 50k:
Bunker Hill Village:
0.6% (7)
Texas:
7.3% (810,440)
Number of households with income $50k - 60k:
Bunker Hill Village:
1.1% (13)
State:
7.2% (799,783)
Number of households with income $60k - 75k:
Bunker Hill Village:
5.8% (67)
State:
9.9% (1,095,384)
Number of households with income $75k - 100k:
Bunker Hill Village:
5.1% (59)
State:
12.8% (1,419,057)
Number of households with income $100k - 125k:
Bunker Hill Village:
0.5% (6)
State:
9.5% (1,054,577)
Number of households with income $125k - 150k:
Bunker Hill Village:
3.4% (39)
State:
6.7% (741,518)
Number of households with income $150k - 200k:
Bunker Hill Village:
9.3% (108)
State:
8.7% (961,776)
Number of households with income > $200k:
Bunker Hill Village:
67.6% (781)
Texas:
10.7% (1,181,544)
Aggregate household income in Bunker Hill Village in 2022: $513,653,381
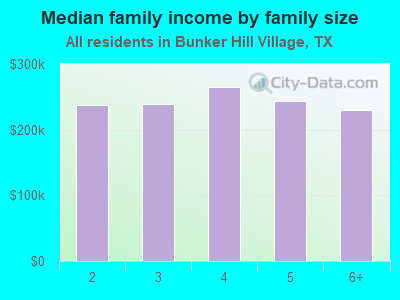
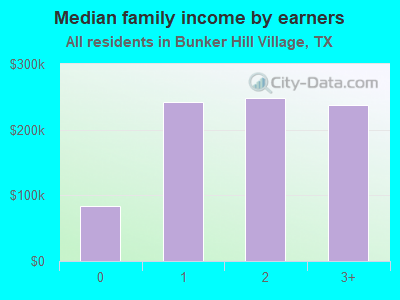
Median family income in Bunker Hill Village in 2022:
Bunker Hill Village:
$239,705
Texas:
$86,267
Number of families with income < $10k:
Bunker Hill Village:
4.1% (43)
State:
4.0% (297,884)
Number of families with income $10k - 20k:
Bunker Hill Village:
0.4% (4)
State:
4.3% (324,514)
Number of families with income $20k - 30k:
Bunker Hill Village:
1.1% (12)
State:
5.8% (430,949)
Number of families with income $50k - 60k:
Bunker Hill Village:
1.2% (13)
Texas:
6.6% (492,203)
Number of families with income $60k - 75k:
Bunker Hill Village:
4.8% (50)
State:
9.5% (710,229)
Number of families with income $75k - 100k:
Bunker Hill Village:
5.1% (53)
Texas:
13.6% (1,015,480)
Number of families with income $100k - 125k:
Bunker Hill Village:
0.6% (6)
Texas:
10.7% (797,961)
Number of families with income $125k - 150k:
Bunker Hill Village:
2.2% (24)
State:
8.1% (602,985)
Number of families with income $150k - 200k:
Bunker Hill Village:
9.2% (97)
State:
10.7% (804,459)
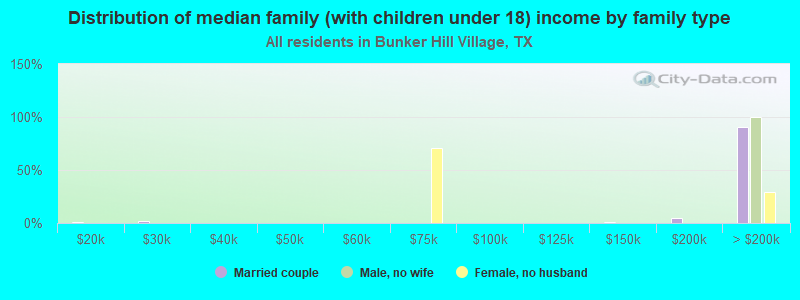
Number of families with income > $200k:
Bunker Hill Village:
71.3% (748)
State:
13.5% (1,013,514)
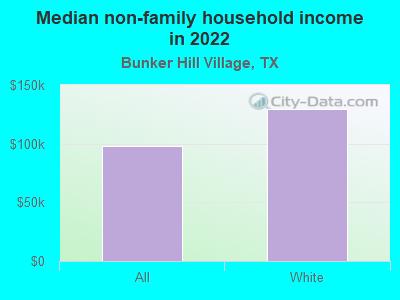
Median non-family income in Bunker Hill Village in 2022:
Bunker Hill Village:
$98,435
Texas:
$45,999
Change in median non-family income between 2000 and 2022:
Bunker Hill Village, Texas:
+96.9%
State:
+79.5%
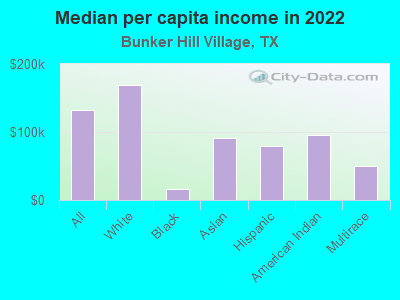
Median per capita income in Bunker Hill Village in 2022:
Bunker Hill Village:
$131,666
Texas:
$38,123
Change in median per capita income between 2000 and 2022:
Bunker Hill Village, Texas:
+52.3%
Texas:
+94.3%
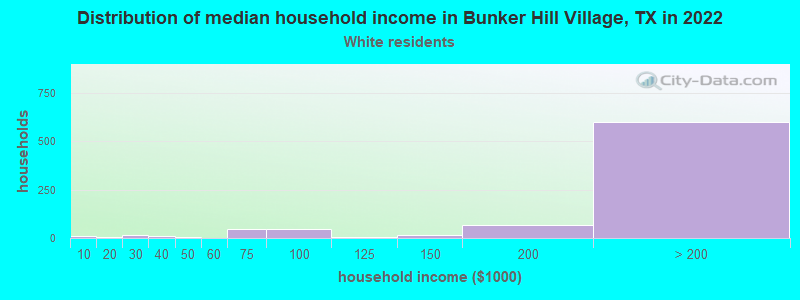
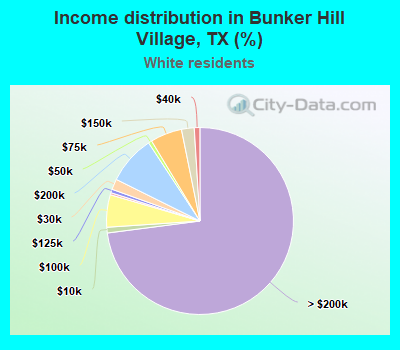
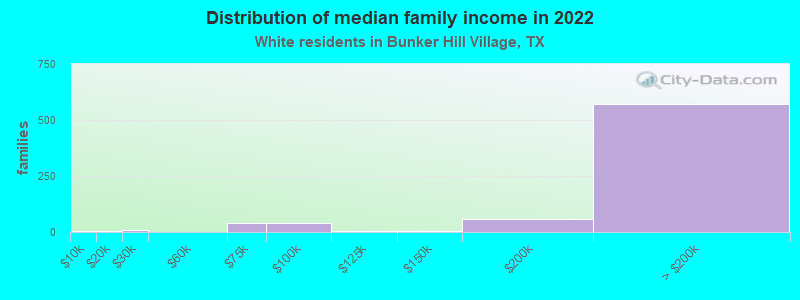
Income statistics for White residents
Median household income in Bunker Hill Village, TX in 2022:
Bunker Hill Village:
$252,799
Texas:
$82,032
Change in median household income between 2000 and 2022:
Bunker Hill Village, Texas:
+44.8%
Texas:
+91.0%
Number of households with income < $10k:
Bunker Hill Village:
1.0% (8)
State:
4.7% (273,716)
Number of households with income $10k - 20k:
Bunker Hill Village:
0.4% (3)
State:
5.5% (322,702)
Number of households with income $20k - 30k:
Bunker Hill Village:
1.8% (15)
Texas:
6.2% (363,947)
Number of households with income $30k - 40k:
Bunker Hill Village:
1.0% (8)
Texas:
6.8% (399,275)
Number of households with income $40k - 50k:
Bunker Hill Village:
0.6% (5)
State:
6.5% (383,417)
Number of households with income $50k - 60k:
Bunker Hill Village:
0.0% (0)
State:
6.6% (388,535)
Number of households with income $60k - 75k:
Bunker Hill Village:
5.5% (45)
State:
9.7% (566,295)
Number of households with income $75k - 100k:
Bunker Hill Village:
5.6% (46)
State:
13.0% (760,276)
Number of households with income $100k - 125k:
Bunker Hill Village:
0.6% (5)
State:
10.2% (597,596)
Number of households with income $125k - 150k:
Bunker Hill Village:
2.2% (18)
State:
7.4% (436,830)
Number of households with income $150k - 200k:
Bunker Hill Village:
8.4% (69)
Texas:
9.9% (583,067)
Number of households with income > $200k:
Bunker Hill Village:
73.0% (599)
State:
13.5% (792,647)
Aggregate household income in Bunker Hill Village in 2022: $385,896,896
Median family income in Bunker Hill Village in 2022:
Bunker Hill Village:
$267,282
State:
$101,788
Number of families with income < $10k:
Bunker Hill Village:
0.8% (6)
State:
2.8% (108,142)
Number of families with income $10k - 20k:
Bunker Hill Village:
0.4% (3)
Texas:
2.9% (113,421)
Number of families with income $20k - 30k:
Bunker Hill Village:
0.9% (7)
State:
4.1% (157,688)
Number of families with income $60k - 75k:
Bunker Hill Village:
5.6% (41)
Texas:
9.0% (346,106)
Number of families with income $75k - 100k:
Bunker Hill Village:
5.5% (41)
State:
13.7% (527,363)
Number of families with income $100k - 125k:
Bunker Hill Village:
0.6% (4)
Texas:
11.6% (448,411)
Number of families with income $125k - 150k:
Bunker Hill Village:
0.7% (5)
State:
9.2% (355,798)
Number of families with income $150k - 200k:
Bunker Hill Village:
8.1% (60)
State:
12.5% (480,185)
Number of families with income > $200k:
Bunker Hill Village:
77.4% (571)
Texas:
17.6% (677,490)
Median non-family income in Bunker Hill Village in 2022:
Bunker Hill Village:
$129,272
State:
$50,587
Median per capita income in Bunker Hill Village in 2022:
Bunker Hill Village:
$168,915
State:
$47,740
Change in median per capita income between 2000 and 2022:
Bunker Hill Village, Texas:
+89.9%
Texas:
+114.3%
Income statistics for Black or African American residents
Median per capita income in Bunker Hill Village in 2022:
Bunker Hill Village:
$15,504
State:
$30,490
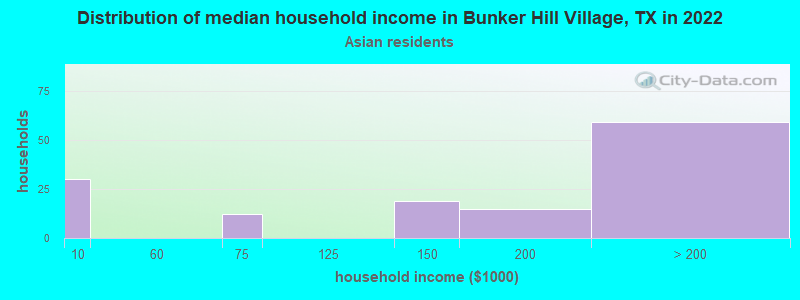
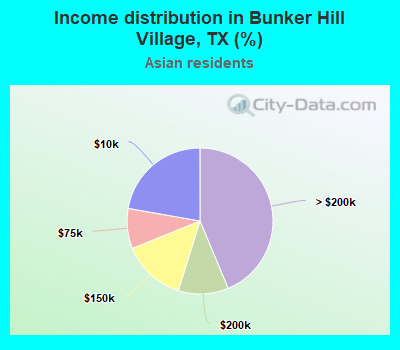
Income statistics for Asian residents
Median household income in Bunker Hill Village, TX in 2022:
Bunker Hill Village:
$203,120
Texas:
$107,673
Change in median household income between 2000 and 2022:
Bunker Hill Village, Texas:
+1.6%
State:
+115.1%
Number of households with income < $10k:
Bunker Hill Village:
22.2% (30)
Texas:
5.2% (29,885)
Number of households with income $10k - 20k:
Bunker Hill Village:
0.0% (0)
State:
4.7% (27,044)
Number of households with income $20k - 30k:
Bunker Hill Village:
0.0% (0)
State:
4.1% (23,363)
Number of households with income $30k - 40k:
Bunker Hill Village:
0.0% (0)
Texas:
4.1% (23,309)
Number of households with income $40k - 50k:
Bunker Hill Village:
0.0% (0)
State:
5.2% (29,826)
Number of households with income $50k - 60k:
Bunker Hill Village:
0.0% (0)
State:
4.7% (26,512)
Number of households with income $60k - 75k:
Bunker Hill Village:
8.9% (12)
State:
6.5% (36,905)
Number of households with income $75k - 100k:
Bunker Hill Village:
0.0% (0)
Texas:
11.3% (64,350)
Number of households with income $100k - 125k:
Bunker Hill Village:
0.0% (0)
Texas:
11.4% (64,714)
Number of households with income $125k - 150k:
Bunker Hill Village:
14.1% (19)
State:
9.3% (52,719)
Number of households with income $150k - 200k:
Bunker Hill Village:
11.1% (15)
State:
12.5% (70,953)
Number of households with income > $200k:
Bunker Hill Village:
43.7% (59)
State:
21.1% (120,260)
Aggregate household income in Bunker Hill Village in 2022: $36,628,584
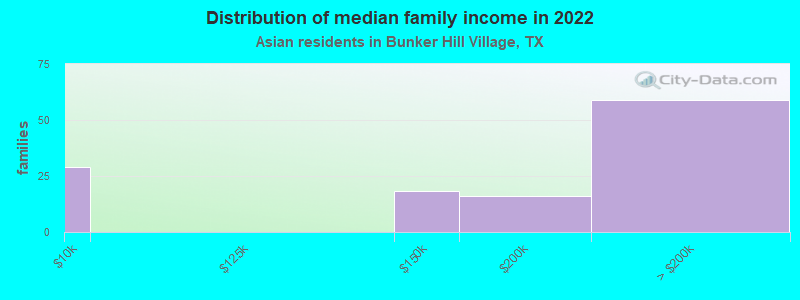
Median family income in Bunker Hill Village in 2022:
Bunker Hill Village:
$200,373
State:
$123,328
Number of families with income < $10k:
Bunker Hill Village:
23.7% (29)
Texas:
3.1% (13,567)
Number of families with income $125k - 150k:
Bunker Hill Village:
15.0% (18)
State:
9.8% (43,043)
Number of families with income $150k - 200k:
Bunker Hill Village:
13.1% (16)
State:
14.7% (64,203)
Number of families with income > $200k:
Bunker Hill Village:
48.2% (59)
State:
24.8% (108,511)
Median per capita income in Bunker Hill Village in 2022:
Bunker Hill Village:
$91,376
State:
$48,626
Change in median per capita income between 2000 and 2022:
Bunker Hill Village, Texas:
+60.1%
State:
+132.0%
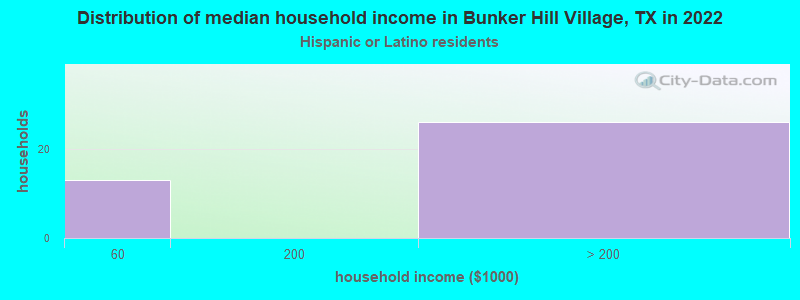
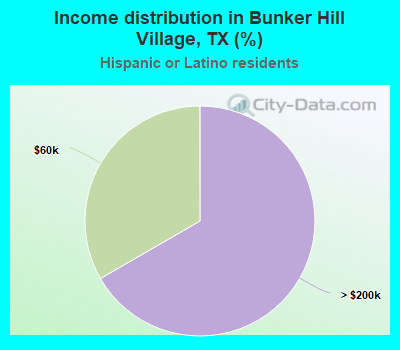
Income statistics for Hispanic or Latino residents
Median household income in Bunker Hill Village, TX in 2022:
Bunker Hill Village:
$247,748
Texas:
$60,504
Change in median household income between 2000 and 2022:
Bunker Hill Village, Texas:
+102.9%
State:
+102.5%
Number of households with income < $10k:
Bunker Hill Village:
0.0% (0)
State:
5.8% (213,953)
Number of households with income $10k - 20k:
Bunker Hill Village:
0.0% (0)
Texas:
8.0% (297,456)
Number of households with income $20k - 30k:
Bunker Hill Village:
0.0% (0)
State:
9.2% (340,166)
Number of households with income $30k - 40k:
Bunker Hill Village:
0.0% (0)
State:
9.5% (354,336)
Number of households with income $40k - 50k:
Bunker Hill Village:
0.0% (0)
Texas:
8.8% (327,013)
Number of households with income $50k - 60k:
Bunker Hill Village:
33.3% (13)
State:
8.3% (308,818)
Number of households with income $60k - 75k:
Bunker Hill Village:
0.0% (0)
State:
10.9% (405,109)
Number of households with income $75k - 100k:
Bunker Hill Village:
0.0% (0)
State:
13.8% (511,639)
Number of households with income $100k - 125k:
Bunker Hill Village:
0.0% (0)
State:
8.6% (319,728)
Number of households with income $125k - 150k:
Bunker Hill Village:
0.0% (0)
Texas:
5.7% (210,932)
Number of households with income $150k - 200k:
Bunker Hill Village:
0.0% (0)
State:
6.4% (236,055)
Number of households with income > $200k:
Bunker Hill Village:
66.7% (26)
Texas:
5.1% (189,259)
Aggregate household income in Bunker Hill Village in 2022: $10,507,254
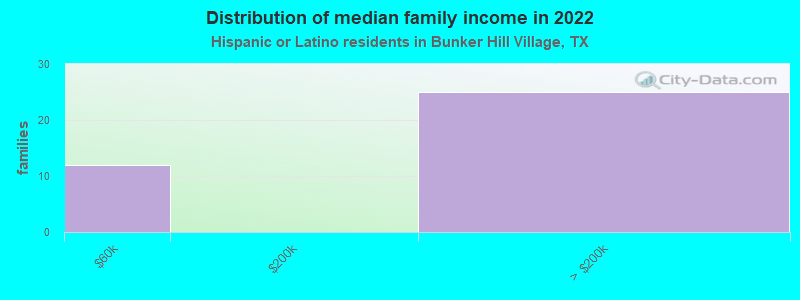
Median family income in Bunker Hill Village in 2022:
Bunker Hill Village:
$243,707
State:
$65,080
Number of families with income $50k - 60k:
Bunker Hill Village:
32.2% (12)
State:
8.0% (223,566)
Number of families with income > $200k:
Bunker Hill Village:
67.8% (25)
State:
5.9% (165,129)
Median per capita income in Bunker Hill Village in 2022:
Bunker Hill Village:
$79,502
Texas:
$24,862
Change in median per capita income between 2000 and 2022:
Bunker Hill Village, Texas:
+92.7%
State:
+130.8%
Income statistics for American Indian and Alaska Native residents
Aggregate household income in Bunker Hill Village in 2022: $2,355,443
Median per capita income in Bunker Hill Village in 2022:
Bunker Hill Village:
$95,976
State:
$28,166
Change in median per capita income between 2000 and 2022:
Bunker Hill Village, Texas:
+42.2%
Texas:
+77.2%
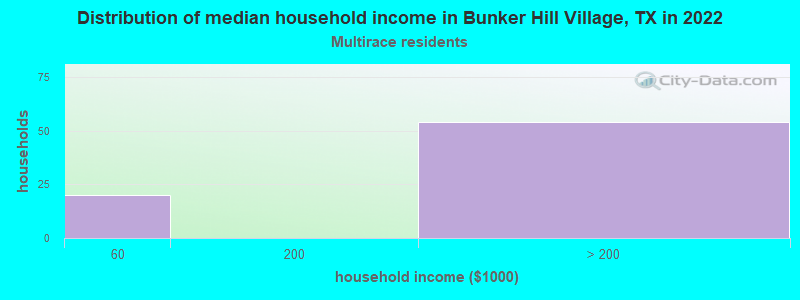
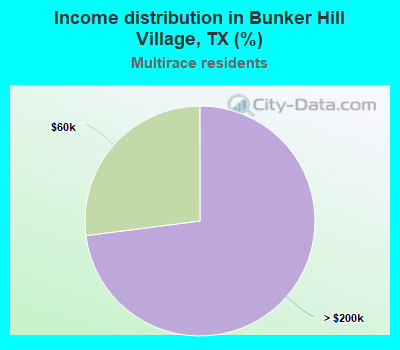
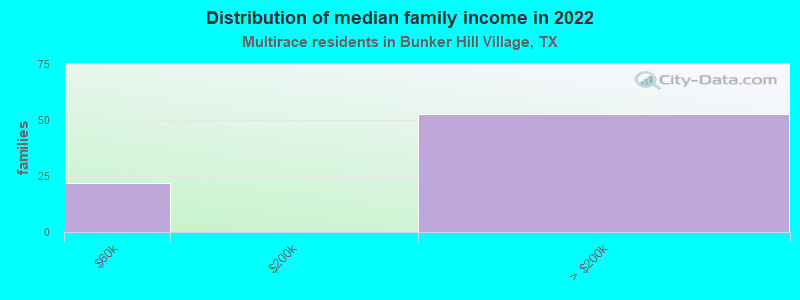
Income statistics for Multirace residents
Median household income in Bunker Hill Village, TX in 2022:
Bunker Hill Village:
$243,463
State:
$62,748
Change in median household income between 2000 and 2022:
Bunker Hill Village, Texas:
+21.7%
State:
+92.3%
Number of households with income < $10k:
Bunker Hill Village:
0.0% (0)
Texas:
5.5% (122,324)
Number of households with income $10k - 20k:
Bunker Hill Village:
0.0% (0)
Texas:
8.2% (182,232)
Number of households with income $20k - 30k:
Bunker Hill Village:
0.0% (0)
State:
8.5% (189,456)
Number of households with income $30k - 40k:
Bunker Hill Village:
0.0% (0)
State:
8.9% (197,499)
Number of households with income $40k - 50k:
Bunker Hill Village:
0.0% (0)
State:
8.7% (191,735)
Number of households with income $50k - 60k:
Bunker Hill Village:
27.0% (20)
State:
8.0% (177,535)
Number of households with income $60k - 75k:
Bunker Hill Village:
0.0% (0)
State:
10.5% (232,479)
Number of households with income $75k - 100k:
Bunker Hill Village:
0.0% (0)
Texas:
13.1% (290,448)
Number of households with income $100k - 125k:
Bunker Hill Village:
0.0% (0)
Texas:
8.6% (191,595)
Number of households with income $125k - 150k:
Bunker Hill Village:
0.0% (0)
State:
6.0% (133,361)
Number of households with income $150k - 200k:
Bunker Hill Village:
0.0% (0)
Texas:
7.2% (159,195)
Number of households with income > $200k:
Bunker Hill Village:
73.0% (54)
Texas:
6.7% (148,064)
Aggregate household income in Bunker Hill Village in 2022: $26,948,372
Median family income in Bunker Hill Village in 2022:
Bunker Hill Village:
$243,368
State:
$69,780
Number of families with income $50k - 60k:
Bunker Hill Village:
29.5% (22)
Texas:
7.9% (127,739)
Number of families with income > $200k:
Bunker Hill Village:
70.5% (53)
State:
7.9% (127,299)
Median per capita income in Bunker Hill Village in 2022:
Bunker Hill Village:
$50,302
State:
$26,785
Change in median per capita income between 2000 and 2022:: -59.0%
Bunker Hill Village, Texas:
-59.0%
Texas:
+110.9%
Discuss Bunker Hill Village, Texas (TX) on our hugely popular Texas forum.