Chireno-Martinsville, Texas (TX) income map, earnings map, and wages data
The median household income in Chireno-Martinsville, TX in 2022 was $57,836, which was 25.0% less than the median annual income of $72,284 across the entire state of Texas. Compared to the median income of $31,372 in 2000 this represents an increase of 45.8%. The per capita income in 2022 was $30,532, which means an increase of 48.5% compared to 2000 when it was $15,721.
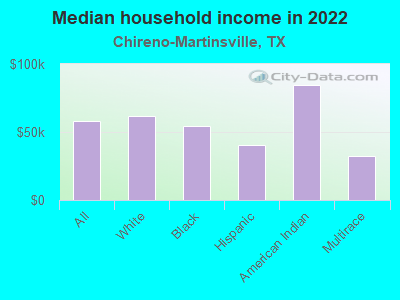
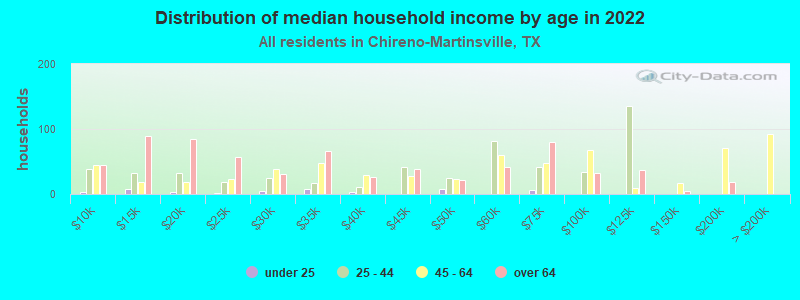
Income statistics for all residents
Median household income in Chireno-Martinsville, TX in 2022:| Chireno-Martinsville: | $57,837 |
| State: | $72,284 |
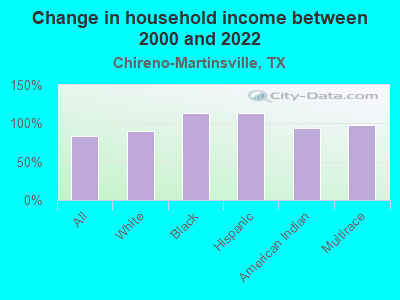
Change in median household income between 2000 and 2022:| Chireno-Martinsville, Texas: | +84.4% |
| State: | +81.0% |
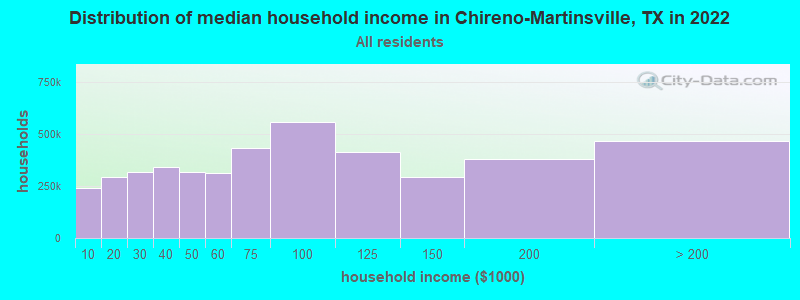
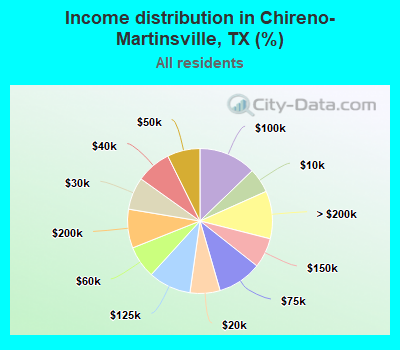
Number of households with income < $10k:| Chireno-Martinsville: | 5.5% (239,915) |
| Texas: | 5.5% (611,011) |
Number of households with income $10k - 20k:| Chireno-Martinsville: | 6.7% (291,954) |
| State: | 6.7% (743,157) |
Number of households with income $20k - 30k:| Chireno-Martinsville: | 7.2% (315,622) |
| Texas: | 7.2% (803,381) |
Number of households with income $30k - 40k:| Chireno-Martinsville: | 7.8% (340,217) |
| State: | 7.8% (866,080) |
Number of households with income $40k - 50k:| Chireno-Martinsville: | 7.3% (318,372) |
| Texas: | 7.3% (810,440) |
Number of households with income $50k - 60k:| Chireno-Martinsville: | 7.2% (314,144) |
| State: | 7.2% (799,783) |
Number of households with income $60k - 75k:| Chireno-Martinsville: | 9.9% (430,274) |
| Texas: | 9.9% (1,095,384) |
Number of households with income $75k - 100k:| Chireno-Martinsville: | 12.8% (557,566) |
| Texas: | 12.8% (1,419,057) |
Number of households with income $100k - 125k:| Chireno-Martinsville: | 9.5% (414,399) |
| State: | 9.5% (1,054,577) |
Number of households with income $125k - 150k:| Chireno-Martinsville: | 6.7% (291,455) |
| State: | 6.7% (741,518) |
Number of households with income $150k - 200k:| Chireno-Martinsville: | 8.7% (377,816) |
| State: | 8.7% (961,776) |
Number of households with income > $200k:| Chireno-Martinsville: | 10.7% (463,957) |
| State: | 10.7% (1,181,544) |
Aggregate household income in Chireno-Martinsville in 2022: $20,162,787,200
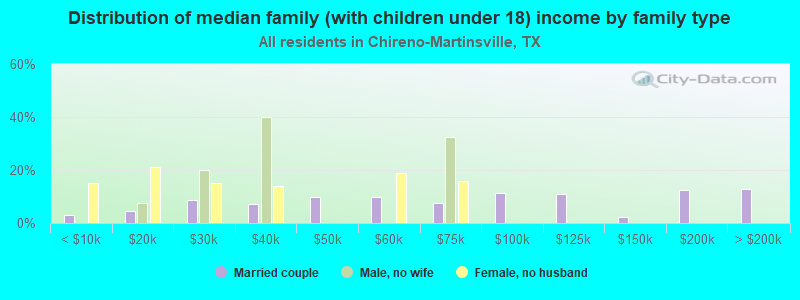
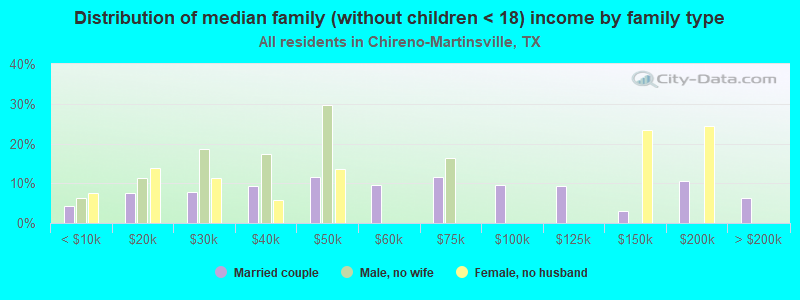
Median family income in Chireno-Martinsville in 2022:| Chireno-Martinsville: | $67,463 |
| Texas: | $86,267 |
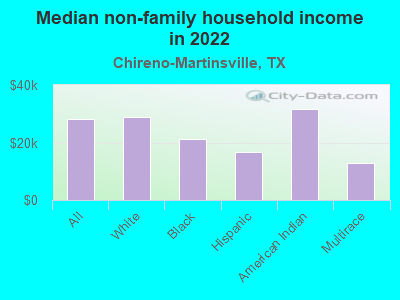
Median non-family income in Chireno-Martinsville in 2022:| Chireno-Martinsville: | $28,063 |
| State: | $45,999 |
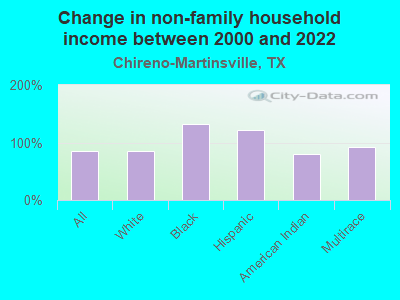
Change in median non-family income between 2000 and 2022:| Chireno-Martinsville, Texas: | +85.2% |
| State: | +79.5% |
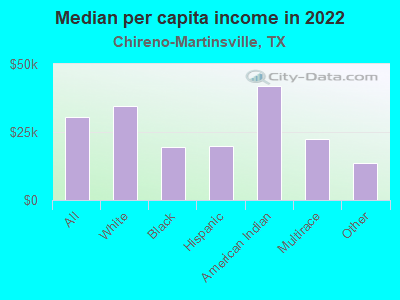
Median per capita income in Chireno-Martinsville in 2022:| Chireno-Martinsville: | $30,532 |
| Texas: | $38,123 |
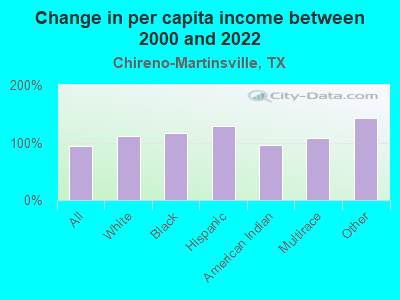
Change in median per capita income between 2000 and 2022:| Chireno-Martinsville, Texas: | +94.2% |
| State: | +94.3% |
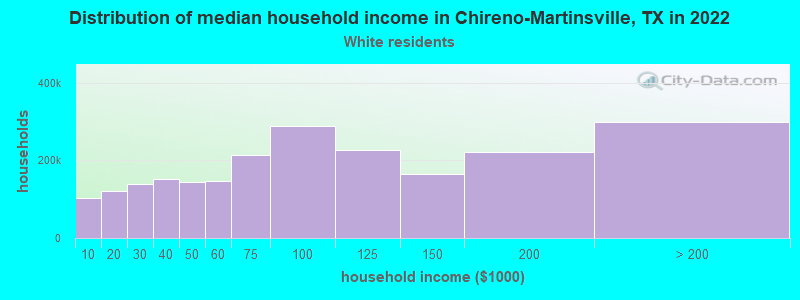
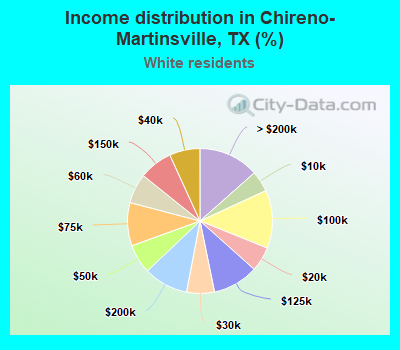
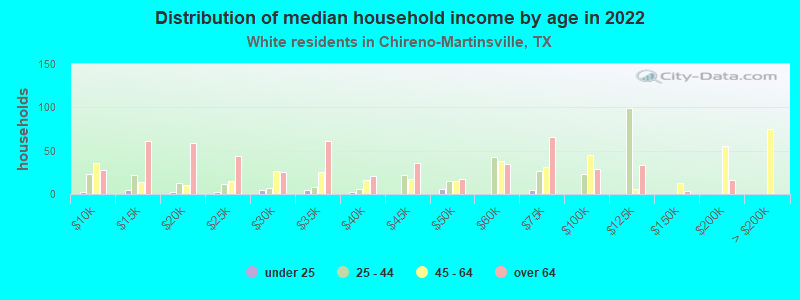
Income statistics for White residents
Median household income in Chireno-Martinsville, TX in 2022:| Chireno-Martinsville: | $62,024 |
| Texas: | $82,032 |
Change in median household income between 2000 and 2022:| Chireno-Martinsville, Texas: | +90.4% |
| Texas: | +91.0% |
Number of households with income < $10k:| Chireno-Martinsville: | 4.7% (103,508) |
| State: | 4.7% (273,716) |
Number of households with income $10k - 20k:| Chireno-Martinsville: | 5.5% (122,257) |
| State: | 5.5% (322,702) |
Number of households with income $20k - 30k:| Chireno-Martinsville: | 6.2% (137,958) |
| State: | 6.2% (363,947) |
Number of households with income $30k - 40k:| Chireno-Martinsville: | 6.8% (151,219) |
| State: | 6.8% (399,275) |
Number of households with income $40k - 50k:| Chireno-Martinsville: | 6.5% (145,161) |
| State: | 6.5% (383,417) |
Number of households with income $50k - 60k:| Chireno-Martinsville: | 6.6% (147,071) |
| State: | 6.6% (388,535) |
Number of households with income $60k - 75k:| Chireno-Martinsville: | 9.6% (214,076) |
| State: | 9.7% (566,295) |
Number of households with income $75k - 100k:| Chireno-Martinsville: | 13.0% (287,682) |
| Texas: | 13.0% (760,276) |
Number of households with income $100k - 125k:| Chireno-Martinsville: | 10.2% (226,129) |
| Texas: | 10.2% (597,596) |
Number of households with income $125k - 150k:| Chireno-Martinsville: | 7.4% (165,249) |
| State: | 7.4% (436,830) |
Number of households with income $150k - 200k:| Chireno-Martinsville: | 9.9% (220,394) |
| State: | 9.9% (583,067) |
Number of households with income > $200k:| Chireno-Martinsville: | 13.5% (298,832) |
| State: | 13.5% (792,647) |
Aggregate household income in Chireno-Martinsville in 2022: $11,520,355,535
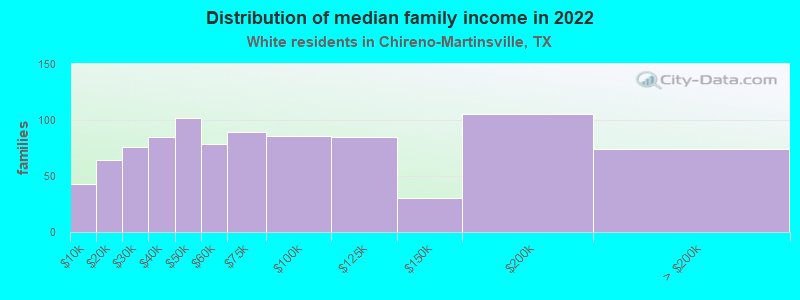
Median family income in Chireno-Martinsville in 2022:| Chireno-Martinsville: | $73,448 |
| State: | $101,788 |
Number of families with income < $10k:| Chireno-Martinsville: | 4.7% (43) |
| Texas: | 2.8% (108,142) |
Number of families with income $10k - 20k:| Chireno-Martinsville: | 6.9% (64) |
| State: | 2.9% (113,421) |
Number of families with income $20k - 30k:| Chireno-Martinsville: | 8.3% (76) |
| Texas: | 4.1% (157,688) |
Number of families with income $30k - 40k:| Chireno-Martinsville: | 9.2% (85) |
| Texas: | 5.2% (198,847) |
Number of families with income $40k - 50k:| Chireno-Martinsville: | 11.2% (102) |
| State: | 5.6% (216,490) |
Number of families with income $50k - 60k:| Chireno-Martinsville: | 8.7% (79) |
| Texas: | 5.7% (220,689) |
Number of families with income $60k - 75k:| Chireno-Martinsville: | 9.7% (89) |
| Texas: | 9.0% (346,106) |
Number of families with income $75k - 100k:| Chireno-Martinsville: | 9.4% (86) |
| Texas: | 13.7% (527,363) |
Number of families with income $100k - 125k:| Chireno-Martinsville: | 9.2% (85) |
| State: | 11.6% (448,411) |
Number of families with income $125k - 150k:| Chireno-Martinsville: | 3.3% (30) |
| State: | 9.2% (355,798) |
Number of families with income $150k - 200k:| Chireno-Martinsville: | 11.4% (105) |
| State: | 12.5% (480,185) |
Number of families with income > $200k:| Chireno-Martinsville: | 8.0% (74) |
| Texas: | 17.6% (677,490) |
Median non-family income in Chireno-Martinsville in 2022:| Chireno-Martinsville: | $29,036 |
| State: | $50,587 |
Change in median non-family income between 2000 and 2022:| Chireno-Martinsville, Texas: | +85.8% |
| Texas: | +87.7% |
Median per capita income in Chireno-Martinsville in 2022:| Chireno-Martinsville: | $34,740 |
| State: | $47,740 |
Change in median per capita income between 2000 and 2022:| Chireno-Martinsville, Texas: | +112.1% |
| State: | +114.3% |
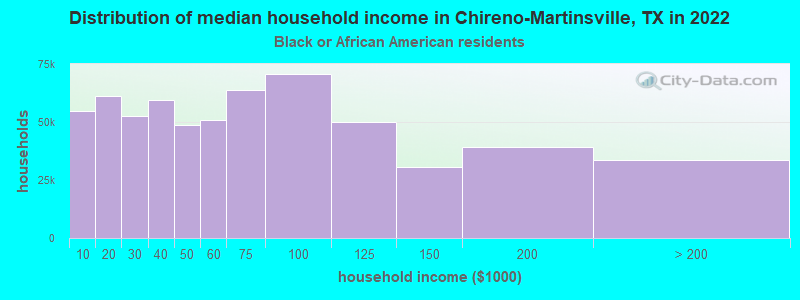
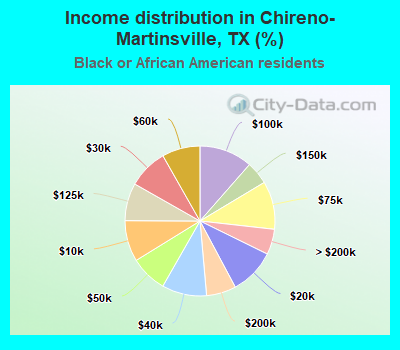
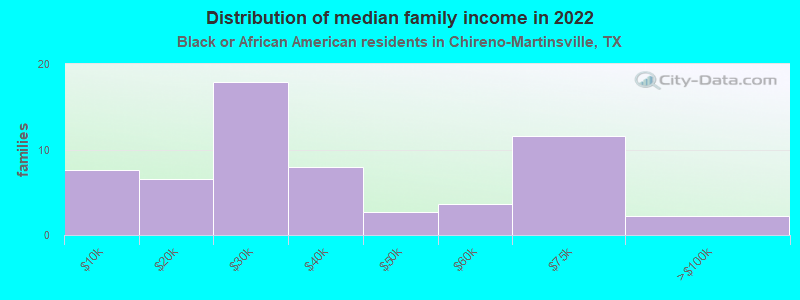
Income statistics for Black or African American residents
Median household income in Chireno-Martinsville, TX in 2022:| Chireno-Martinsville: | $54,412 |
| State: | $55,759 |
Change in median household income between 2000 and 2022:| Chireno-Martinsville, Texas: | +113.5% |
| State: | +90.3% |
Number of households with income < $10k:| Chireno-Martinsville: | 8.9% (54,742) |
| Texas: | 8.9% (126,378) |
Number of households with income $10k - 20k:| Chireno-Martinsville: | 9.9% (61,201) |
| State: | 9.9% (140,369) |
Number of households with income $20k - 30k:| Chireno-Martinsville: | 8.5% (52,655) |
| State: | 8.5% (120,639) |
Number of households with income $30k - 40k:| Chireno-Martinsville: | 9.7% (59,532) |
| State: | 9.7% (137,517) |
Number of households with income $40k - 50k:| Chireno-Martinsville: | 7.9% (48,907) |
| State: | 8.0% (112,973) |
Number of households with income $50k - 60k:| Chireno-Martinsville: | 8.2% (50,676) |
| State: | 8.3% (117,156) |
Number of households with income $60k - 75k:| Chireno-Martinsville: | 10.4% (63,971) |
| State: | 10.4% (147,462) |
Number of households with income $75k - 100k:| Chireno-Martinsville: | 11.5% (70,635) |
| State: | 11.5% (162,718) |
Number of households with income $100k - 125k:| Chireno-Martinsville: | 8.1% (50,151) |
| Texas: | 8.2% (115,829) |
Number of households with income $125k - 150k:| Chireno-Martinsville: | 4.9% (30,391) |
| Texas: | 4.9% (69,556) |
Number of households with income $150k - 200k:| Chireno-Martinsville: | 6.4% (39,361) |
| State: | 6.4% (90,701) |
Number of households with income > $200k:| Chireno-Martinsville: | 5.5% (33,816) |
| Texas: | 5.5% (77,988) |
Aggregate household income in Chireno-Martinsville in 2022: $63,535,124
Median family income in Chireno-Martinsville in 2022:| Chireno-Martinsville: | $58,317 |
| State: | $69,134 |
Number of families with income < $10k:| Chireno-Martinsville: | 12.7% (8) |
| State: | 6.8% (55,625) |
Number of families with income $10k - 20k:| Chireno-Martinsville: | 11.0% (7) |
| State: | 6.8% (55,300) |
Number of families with income $20k - 30k:| Chireno-Martinsville: | 29.8% (18) |
| State: | 7.1% (57,877) |
Number of families with income $30k - 40k:| Chireno-Martinsville: | 13.2% (8) |
| State: | 8.5% (68,776) |
Number of families with income $40k - 50k:| Chireno-Martinsville: | 4.5% (3) |
| State: | 7.1% (57,907) |
Number of families with income $50k - 60k:| Chireno-Martinsville: | 6.0% (4) |
| State: | 7.3% (59,511) |
Number of families with income $60k - 75k:| Chireno-Martinsville: | 19.2% (12) |
| Texas: | 10.1% (81,994) |
Number of families with income $75k - 100k:| Chireno-Martinsville: | 3.6% (2) |
| State: | 12.7% (103,723) |
Median non-family income in Chireno-Martinsville in 2022:| Chireno-Martinsville: | $21,362 |
| Texas: | $40,133 |
Change in median non-family income between 2000 and 2022:| Chireno-Martinsville, Texas: | +133.0% |
| State: | +102.2% |
Median per capita income in Chireno-Martinsville in 2022:| Chireno-Martinsville: | $19,385 |
| State: | $30,490 |
Change in median per capita income between 2000 and 2022:| Chireno-Martinsville, Texas: | +116.3% |
| Texas: | +113.9% |
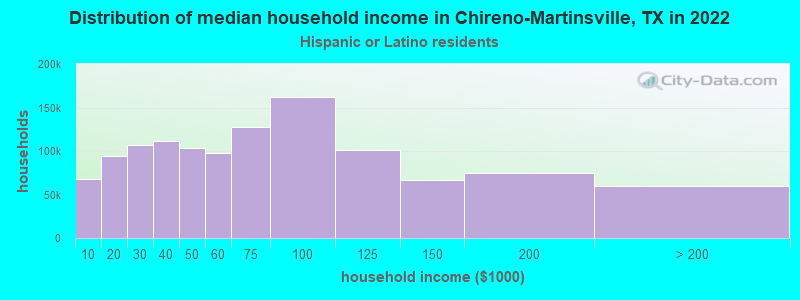
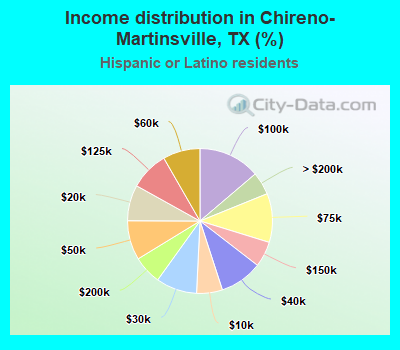
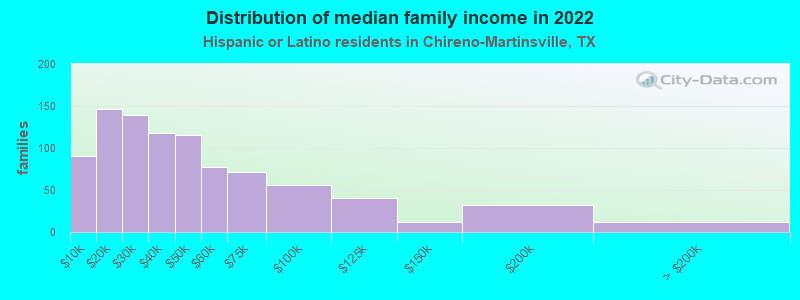
Income statistics for Hispanic or Latino residents
Median household income in Chireno-Martinsville, TX in 2022:| Chireno-Martinsville: | $40,140 |
| State: | $60,504 |
Change in median household income between 2000 and 2022:| Chireno-Martinsville, Texas: | +112.9% |
| Texas: | +102.5% |
Number of households with income < $10k:| Chireno-Martinsville: | 5.8% (67,592) |
| Texas: | 5.8% (213,953) |
Number of households with income $10k - 20k:| Chireno-Martinsville: | 8.0% (94,005) |
| State: | 8.0% (297,456) |
Number of households with income $20k - 30k:| Chireno-Martinsville: | 9.2% (107,407) |
| State: | 9.2% (340,166) |
Number of households with income $30k - 40k:| Chireno-Martinsville: | 9.5% (111,982) |
| State: | 9.5% (354,336) |
Number of households with income $40k - 50k:| Chireno-Martinsville: | 8.8% (103,277) |
| State: | 8.8% (327,013) |
Number of households with income $50k - 60k:| Chireno-Martinsville: | 8.3% (97,473) |
| Texas: | 8.3% (308,818) |
Number of households with income $60k - 75k:| Chireno-Martinsville: | 10.9% (127,978) |
| Texas: | 10.9% (405,109) |
Number of households with income $75k - 100k:| Chireno-Martinsville: | 13.8% (161,704) |
| State: | 13.8% (511,639) |
Number of households with income $100k - 125k:| Chireno-Martinsville: | 8.6% (101,057) |
| State: | 8.6% (319,728) |
Number of households with income $125k - 150k:| Chireno-Martinsville: | 5.7% (66,727) |
| State: | 5.7% (210,932) |
Number of households with income $150k - 200k:| Chireno-Martinsville: | 6.4% (74,522) |
| State: | 6.4% (236,055) |
Number of households with income > $200k:| Chireno-Martinsville: | 5.1% (59,831) |
| State: | 5.1% (189,259) |
Aggregate household income in Chireno-Martinsville in 2022: $132,565,231
Median family income in Chireno-Martinsville in 2022:| Chireno-Martinsville: | $42,263 |
| State: | $65,080 |
Number of families with income < $10k:| Chireno-Martinsville: | 9.9% (90) |
| State: | 5.3% (147,493) |
Number of families with income $10k - 20k:| Chireno-Martinsville: | 16.0% (146) |
| State: | 6.3% (174,531) |
Number of families with income $20k - 30k:| Chireno-Martinsville: | 15.3% (139) |
| State: | 8.6% (238,528) |
Number of families with income $30k - 40k:| Chireno-Martinsville: | 12.9% (118) |
| State: | 9.1% (251,999) |
Number of families with income $40k - 50k:| Chireno-Martinsville: | 12.7% (116) |
| State: | 8.6% (240,188) |
Number of families with income $50k - 60k:| Chireno-Martinsville: | 8.4% (77) |
| Texas: | 8.0% (223,566) |
Number of families with income $60k - 75k:| Chireno-Martinsville: | 7.9% (72) |
| Texas: | 10.9% (302,688) |
Number of families with income $75k - 100k:| Chireno-Martinsville: | 6.2% (56) |
| Texas: | 14.3% (398,554) |
Number of families with income $100k - 125k:| Chireno-Martinsville: | 4.4% (40) |
| State: | 9.5% (264,007) |
Number of families with income $125k - 150k:| Chireno-Martinsville: | 1.3% (12) |
| Texas: | 6.2% (171,274) |
Number of families with income $150k - 200k:| Chireno-Martinsville: | 3.6% (32) |
| State: | 7.3% (202,259) |
Number of families with income > $200k:| Chireno-Martinsville: | 1.3% (12) |
| State: | 5.9% (165,129) |
Median non-family income in Chireno-Martinsville in 2022:| Chireno-Martinsville: | $16,561 |
| State: | $39,934 |
Change in median non-family income between 2000 and 2022:| Chireno-Martinsville, Texas: | +120.8% |
| State: | +109.1% |
Median per capita income in Chireno-Martinsville in 2022:| Chireno-Martinsville: | $19,818 |
| Texas: | $24,862 |
Change in median per capita income between 2000 and 2022:| Chireno-Martinsville, Texas: | +128.5% |
| State: | +130.8% |
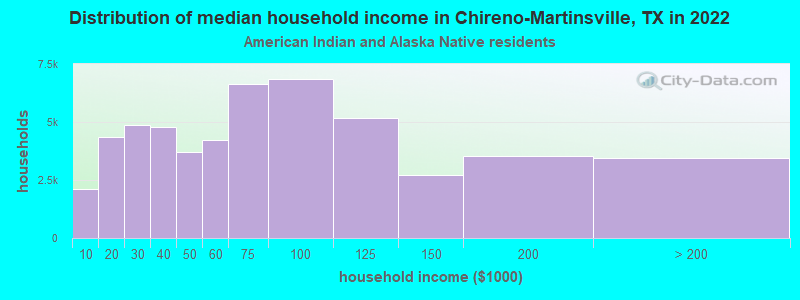
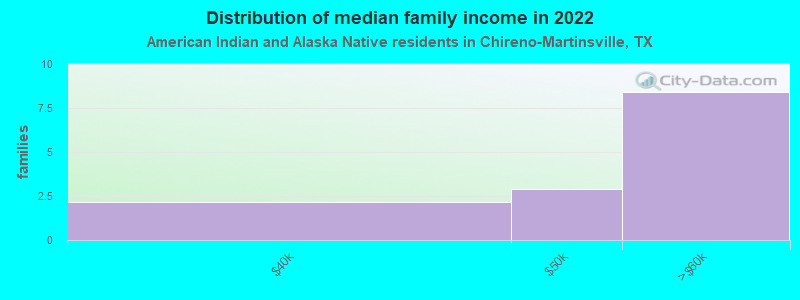
Income statistics for American Indian and Alaska Native residents
Median household income in Chireno-Martinsville, TX in 2022:| Chireno-Martinsville: | $84,753 |
| State: | $65,765 |
Change in median household income between 2000 and 2022:| Chireno-Martinsville, Texas: | +93.7% |
| State: | +88.3% |
Number of households with income < $10k:| Chireno-Martinsville: | 4.1% (2,132) |
| State: | 4.1% (3,398) |
Number of households with income $10k - 20k:| Chireno-Martinsville: | 8.3% (4,359) |
| State: | 8.3% (6,949) |
Number of households with income $20k - 30k:| Chireno-Martinsville: | 9.3% (4,858) |
| Texas: | 9.3% (7,742) |
Number of households with income $30k - 40k:| Chireno-Martinsville: | 9.1% (4,779) |
| Texas: | 9.1% (7,627) |
Number of households with income $40k - 50k:| Chireno-Martinsville: | 7.1% (3,719) |
| State: | 7.1% (5,922) |
Number of households with income $50k - 60k:| Chireno-Martinsville: | 8.1% (4,243) |
| Texas: | 8.1% (6,761) |
Number of households with income $60k - 75k:| Chireno-Martinsville: | 12.7% (6,640) |
| State: | 12.7% (10,588) |
Number of households with income $75k - 100k:| Chireno-Martinsville: | 13.0% (6,842) |
| State: | 13.0% (10,903) |
Number of households with income $100k - 125k:| Chireno-Martinsville: | 9.9% (5,181) |
| Texas: | 9.9% (8,256) |
Number of households with income $125k - 150k:| Chireno-Martinsville: | 5.2% (2,730) |
| State: | 5.2% (4,355) |
Number of households with income $150k - 200k:| Chireno-Martinsville: | 6.7% (3,524) |
| State: | 6.7% (5,623) |
Number of households with income > $200k:| Chireno-Martinsville: | 6.6% (3,460) |
| State: | 6.6% (5,522) |
Aggregate household income in Chireno-Martinsville in 2022: $2,086,954
Median family income in Chireno-Martinsville in 2022:| Chireno-Martinsville: | $100,509 |
| State: | $72,369 |
Number of families with income $30k - 40k:| Chireno-Martinsville: | 16.1% (2) |
| State: | 7.5% (4,592) |
Number of families with income $40k - 50k:| Chireno-Martinsville: | 21.6% (3) |
| State: | 7.9% (4,855) |
Number of families with income $50k - 60k:| Chireno-Martinsville: | 62.2% (8) |
| State: | 7.1% (4,347) |
Median non-family income in Chireno-Martinsville in 2022:| Chireno-Martinsville: | $31,524 |
| State: | $40,351 |
Change in median non-family income between 2000 and 2022:| Chireno-Martinsville, Texas: | +80.1% |
| State: | +71.9% |
Median per capita income in Chireno-Martinsville in 2022:| Chireno-Martinsville: | $41,937 |
| State: | $28,166 |
Change in median per capita income between 2000 and 2022:| Chireno-Martinsville, Texas: | +95.5% |
| State: | +77.2% |
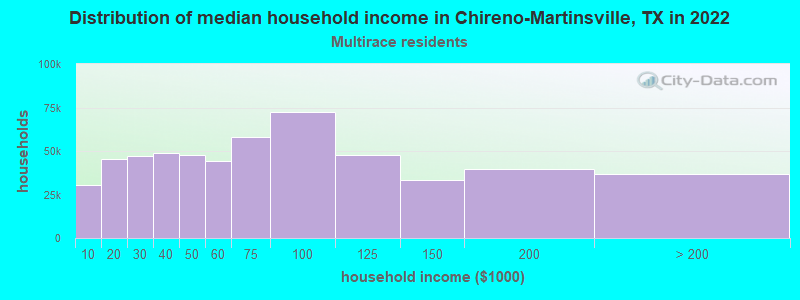
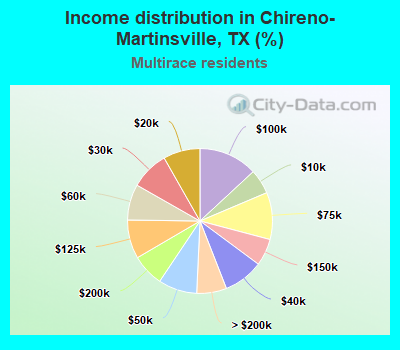
Income statistics for Multirace residents
Median household income in Chireno-Martinsville, TX in 2022:| Chireno-Martinsville: | $32,165 |
| Texas: | $62,748 |
Change in median household income between 2000 and 2022:| Chireno-Martinsville, Texas: | +97.9% |
| State: | +92.3% |
Number of households with income < $10k:| Chireno-Martinsville: | 5.5% (30,429) |
| State: | 5.5% (122,324) |
Number of households with income $10k - 20k:| Chireno-Martinsville: | 8.2% (45,332) |
| State: | 8.2% (182,232) |
Number of households with income $20k - 30k:| Chireno-Martinsville: | 8.5% (47,080) |
| State: | 8.5% (189,456) |
Number of households with income $30k - 40k:| Chireno-Martinsville: | 8.9% (49,116) |
| State: | 8.9% (197,499) |
Number of households with income $40k - 50k:| Chireno-Martinsville: | 8.7% (47,708) |
| Texas: | 8.7% (191,735) |
Number of households with income $50k - 60k:| Chireno-Martinsville: | 8.0% (44,126) |
| Texas: | 8.0% (177,535) |
Number of households with income $60k - 75k:| Chireno-Martinsville: | 10.5% (57,836) |
| Texas: | 10.5% (232,479) |
Number of households with income $75k - 100k:| Chireno-Martinsville: | 13.1% (72,234) |
| Texas: | 13.1% (290,448) |
Number of households with income $100k - 125k:| Chireno-Martinsville: | 8.6% (47,670) |
| State: | 8.6% (191,595) |
Number of households with income $125k - 150k:| Chireno-Martinsville: | 6.0% (33,204) |
| Texas: | 6.0% (133,361) |
Number of households with income $150k - 200k:| Chireno-Martinsville: | 7.2% (39,547) |
| State: | 7.2% (159,195) |
Number of households with income > $200k:| Chireno-Martinsville: | 6.7% (36,821) |
| Texas: | 6.7% (148,064) |
Aggregate household income in Chireno-Martinsville in 2022: $19,009,966
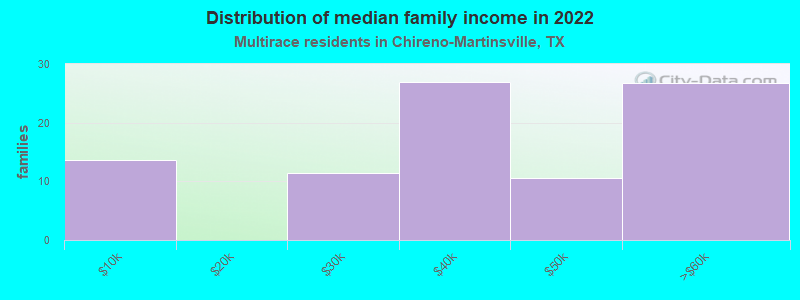
Median family income in Chireno-Martinsville in 2022:| Chireno-Martinsville: | $70,589 |
| Texas: | $69,780 |
Number of families with income < $10k:| Chireno-Martinsville: | 15.2% (14) |
| State: | 4.4% (70,825) |
Number of families with income $20k - 30k:| Chireno-Martinsville: | 12.8% (11) |
| State: | 7.8% (126,627) |
Number of families with income $30k - 40k:| Chireno-Martinsville: | 30.1% (27) |
| State: | 8.5% (137,626) |
Number of families with income $40k - 50k:| Chireno-Martinsville: | 11.9% (11) |
| State: | 8.4% (135,809) |
Number of families with income $50k - 60k:| Chireno-Martinsville: | 30.0% (27) |
| State: | 7.9% (127,739) |
Median non-family income in Chireno-Martinsville in 2022:| Chireno-Martinsville: | $12,877 |
| State: | $40,634 |
Change in median non-family income between 2000 and 2022:| Chireno-Martinsville, Texas: | +93.2% |
| State: | +77.2% |
Median per capita income in Chireno-Martinsville in 2022:| Chireno-Martinsville: | $22,273 |
| State: | $26,785 |
Change in median per capita income between 2000 and 2022:| Chireno-Martinsville, Texas: | +108.4% |
| State: | +110.9% |
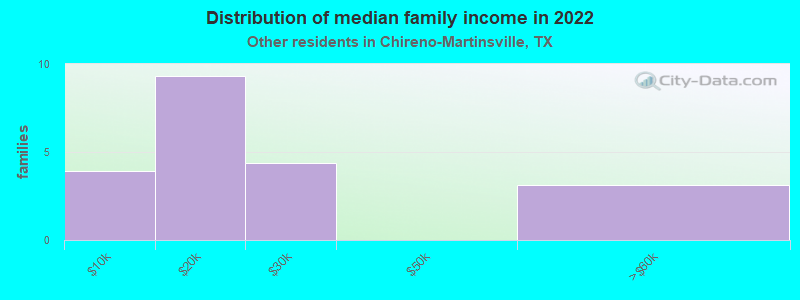
Income statistics for other residents
Number of households with income < $10k:| Chireno-Martinsville: | 5.6% (8) |
| State: | 5.9% (54,162) |
Number of households with income $10k - 20k:| Chireno-Martinsville: | 7.0% (10) |
| State: | 6.8% (62,891) |
Number of households with income $20k - 30k:| Chireno-Martinsville: | 10.6% (15) |
| State: | 10.6% (97,294) |
Number of households with income $30k - 40k:| Chireno-Martinsville: | 10.6% (15) |
| Texas: | 10.8% (99,670) |
Number of households with income $40k - 50k:| Chireno-Martinsville: | 9.2% (13) |
| State: | 9.3% (85,548) |
Number of households with income $50k - 60k:| Chireno-Martinsville: | 9.2% (13) |
| Texas: | 9.0% (82,757) |
Number of households with income $60k - 75k:| Chireno-Martinsville: | 10.6% (15) |
| State: | 10.9% (100,326) |
Number of households with income $75k - 100k:| Chireno-Martinsville: | 14.1% (20) |
| Texas: | 14.0% (128,767) |
Number of households with income $100k - 125k:| Chireno-Martinsville: | 8.5% (12) |
| Texas: | 8.2% (75,218) |
Number of households with income $125k - 150k:| Chireno-Martinsville: | 4.9% (7) |
| State: | 4.8% (44,223) |
Number of households with income $150k - 200k:| Chireno-Martinsville: | 5.6% (8) |
| State: | 5.6% (51,376) |
Number of households with income > $200k:| Chireno-Martinsville: | 4.2% (6) |
| State: | 4.0% (36,393) |
Aggregate household income in Chireno-Martinsville in 2022: $10,386,551
Median family income in Chireno-Martinsville in 2022:| Chireno-Martinsville: | $38,247 |
| State: | $60,064 |
Number of families with income < $10k:| Chireno-Martinsville: | 18.8% (4) |
| State: | 6.8% (47,502) |
Number of families with income $10k - 20k:| Chireno-Martinsville: | 45.0% (9) |
| State: | 6.0% (41,763) |
Number of families with income $20k - 30k:| Chireno-Martinsville: | 21.2% (4) |
| State: | 9.9% (68,761) |
Number of families with income $50k - 60k:| Chireno-Martinsville: | 15.1% (3) |
| State: | 8.5% (59,321) |
Median per capita income in Chireno-Martinsville in 2022:| Chireno-Martinsville: | $13,524 |
| Texas: | $23,899 |
Change in median per capita income between 2000 and 2022:| Chireno-Martinsville, Texas: | +141.8% |
| Texas: | +135.2% |