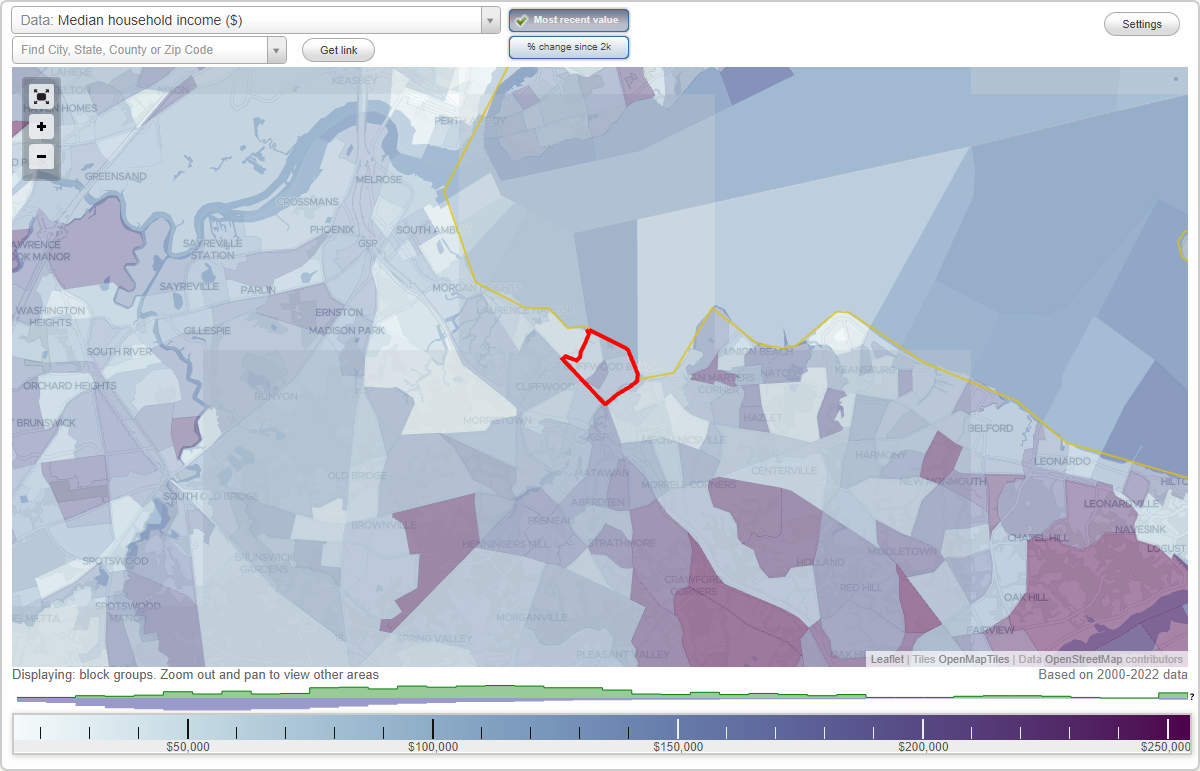
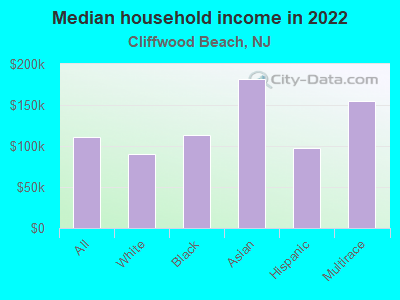
The median household income in Cliffwood Beach, NJ in 2022 was $111,471, which was 13.6% greater than the median annual income of $96,346 across the entire state of New Jersey. Compared to the median income of $57,098 in 2000 this represents an increase of 48.8%. The per capita income in 2022 was $46,748, which means an increase of 51.1% compared to 2000 when it was $22,874.
Whole page based on the data from 2000 / 2022 when the population of Cliffwood Beach, New Jersey was 3,538 / 3,013
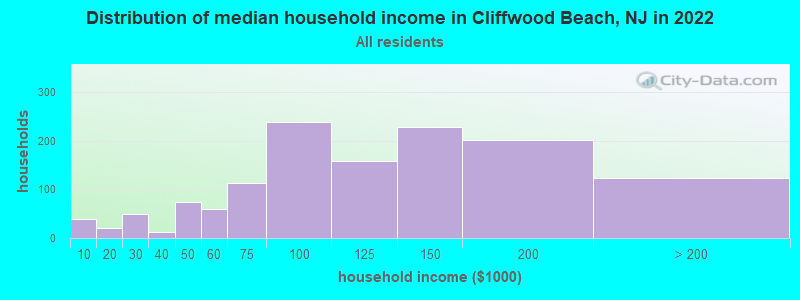
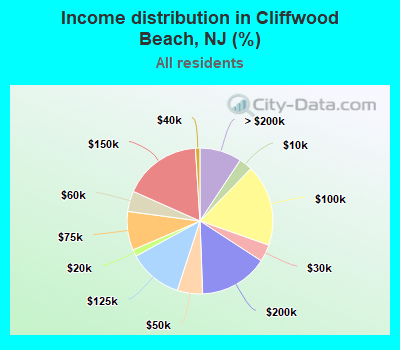
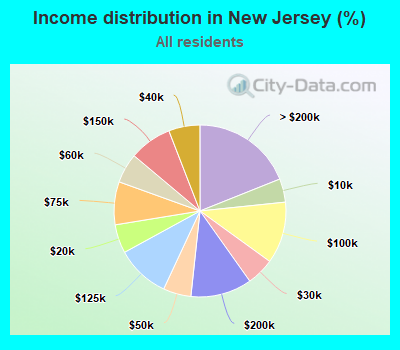
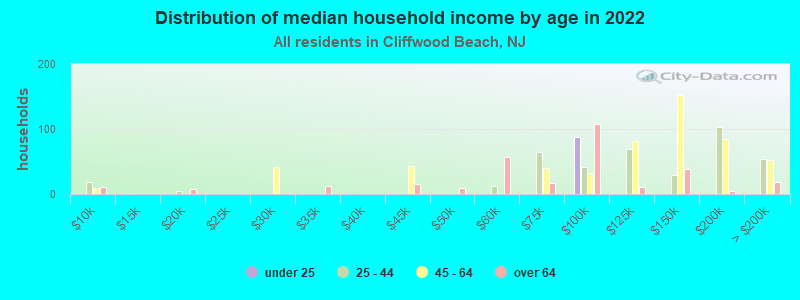
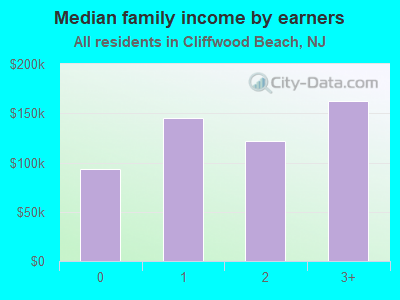
Income statistics for all residents
Median household income in Cliffwood Beach, NJ in 2022:
Cliffwood Beach:
$111,472
State:
$96,346
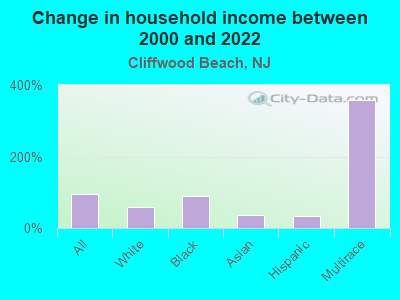
Change in median household income between 2000 and 2022:
Cliffwood Beach, New Jersey:
+95.2%
State:
+74.7%
Number of households with income < $10k:
Cliffwood Beach:
3.0% (39)
State:
4.4% (155,271)
Number of households with income $10k - 20k:
Cliffwood Beach:
1.5% (20)
State:
5.4% (189,888)
Number of households with income $20k - 30k:
Cliffwood Beach:
3.8% (50)
State:
5.2% (183,402)
Number of households with income $30k - 40k:
Cliffwood Beach:
1.0% (13)
New Jersey:
5.9% (206,969)
Number of households with income $40k - 50k:
Cliffwood Beach:
5.6% (74)
State:
5.2% (184,153)
Number of households with income $50k - 60k:
Cliffwood Beach:
4.5% (60)
New Jersey:
5.6% (197,270)
Number of households with income $60k - 75k:
Cliffwood Beach:
8.6% (113)
New Jersey:
8.1% (284,245)
Number of households with income $75k - 100k:
Cliffwood Beach:
18.1% (239)
State:
11.6% (408,272)
Number of households with income $100k - 125k:
Cliffwood Beach:
12.0% (158)
New Jersey:
10.1% (354,738)
Number of households with income $125k - 150k:
Cliffwood Beach:
17.4% (229)
State:
8.0% (281,341)
Number of households with income $150k - 200k:
Cliffwood Beach:
15.2% (201)
State:
11.5% (404,977)
Number of households with income > $200k:
Cliffwood Beach:
9.3% (123)
State:
18.9% (666,452)
Aggregate household income in Cliffwood Beach in 2022: $148,955,808
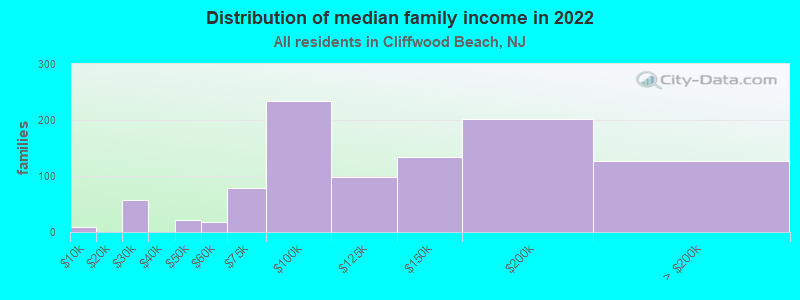
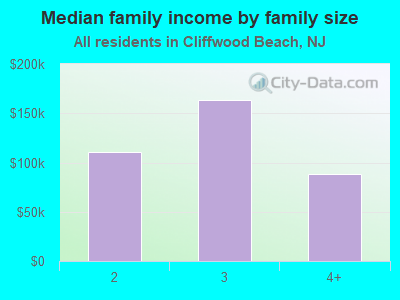
Median family income in Cliffwood Beach in 2022:
Cliffwood Beach:
$116,124
State:
$117,988
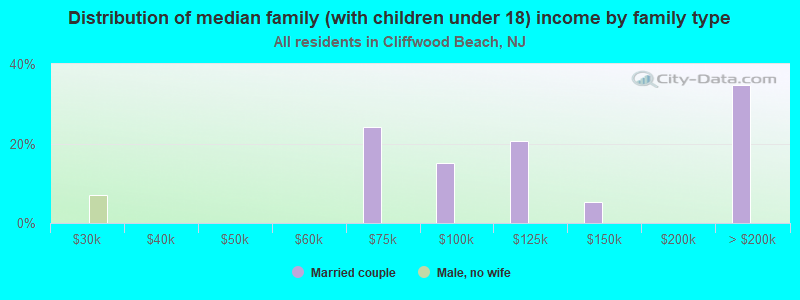
Number of families with income < $10k:
Cliffwood Beach:
0.9% (9)
State:
2.2% (53,316)
Number of families with income $20k - 30k:
Cliffwood Beach:
5.8% (57)
State:
3.5% (82,889)
Number of families with income $40k - 50k:
Cliffwood Beach:
2.2% (21)
State:
4.5% (107,202)
Number of families with income $50k - 60k:
Cliffwood Beach:
1.9% (18)
State:
4.8% (114,765)
Number of families with income $60k - 75k:
Cliffwood Beach:
8.1% (79)
State:
7.5% (179,372)
Number of families with income $75k - 100k:
Cliffwood Beach:
23.9% (234)
New Jersey:
11.5% (274,497)
Number of families with income $100k - 125k:
Cliffwood Beach:
10.1% (99)
State:
10.9% (260,033)
Number of families with income $125k - 150k:
Cliffwood Beach:
13.7% (134)
State:
9.0% (214,872)
Number of families with income $150k - 200k:
Cliffwood Beach:
20.5% (201)
State:
13.8% (328,605)
Number of families with income > $200k:
Cliffwood Beach:
12.8% (126)
State:
24.3% (578,135)
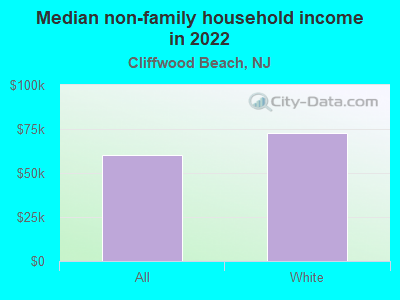
Median non-family income in Cliffwood Beach in 2022:
Cliffwood Beach:
$60,227
State:
$54,589
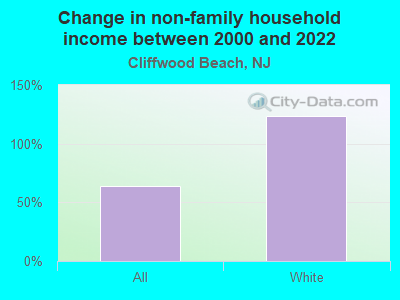
Change in median non-family income between 2000 and 2022:
Cliffwood Beach, New Jersey:
+63.6%
State:
+74.4%
Median per capita income in Cliffwood Beach in 2022:
Cliffwood Beach:
$46,749
State:
$51,272
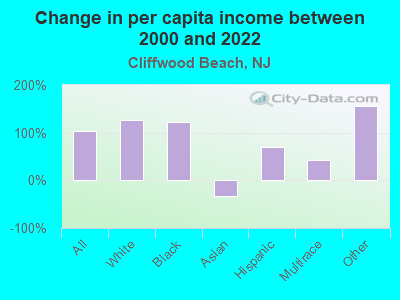
Change in median per capita income between 2000 and 2022:
Cliffwood Beach, New Jersey:
+104.4%
New Jersey:
+89.9%
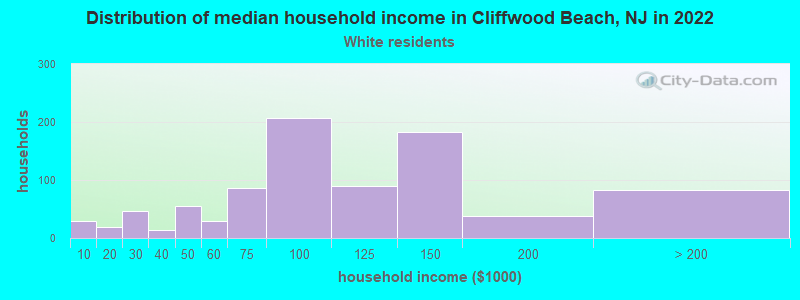
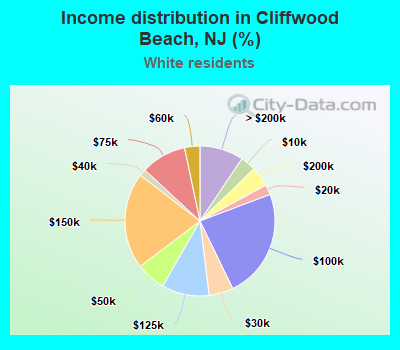
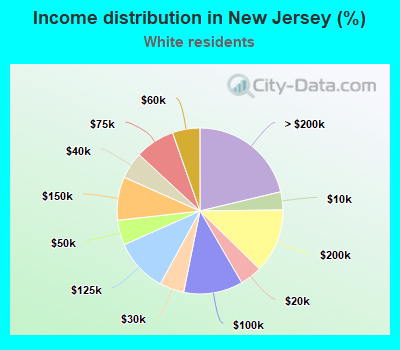
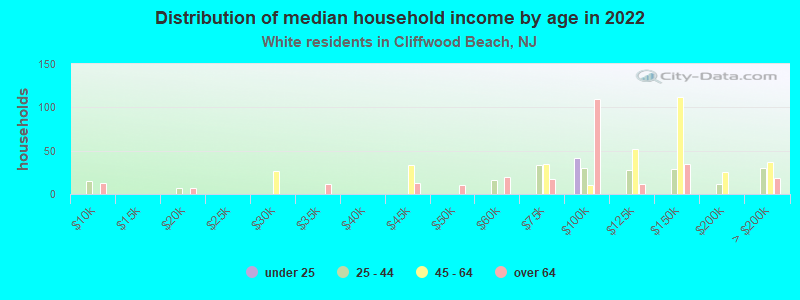
Income statistics for White residents
Median household income in Cliffwood Beach, NJ in 2022:
Cliffwood Beach:
$89,785
State:
$105,428
Change in median household income between 2000 and 2022:
Cliffwood Beach, New Jersey:
+60.2%
State:
+78.2%
Number of households with income < $10k:
Cliffwood Beach:
3.3% (29)
State:
3.5% (73,676)
Number of households with income $10k - 20k:
Cliffwood Beach:
2.2% (19)
State:
4.3% (90,086)
Number of households with income $20k - 30k:
Cliffwood Beach:
5.2% (46)
State:
4.7% (99,511)
Number of households with income $30k - 40k:
Cliffwood Beach:
1.5% (13)
State:
5.2% (109,051)
Number of households with income $40k - 50k:
Cliffwood Beach:
6.4% (56)
State:
4.9% (101,931)
Number of households with income $50k - 60k:
Cliffwood Beach:
3.3% (29)
State:
5.4% (112,379)
Number of households with income $60k - 75k:
Cliffwood Beach:
9.8% (86)
State:
7.7% (162,379)
Number of households with income $75k - 100k:
Cliffwood Beach:
23.6% (207)
New Jersey:
11.6% (242,478)
Number of households with income $100k - 125k:
Cliffwood Beach:
10.3% (90)
State:
10.4% (218,622)
Number of households with income $125k - 150k:
Cliffwood Beach:
20.7% (182)
State:
8.5% (177,925)
Number of households with income $150k - 200k:
Cliffwood Beach:
4.3% (38)
State:
12.5% (262,429)
Number of households with income > $200k:
Cliffwood Beach:
9.5% (83)
New Jersey:
21.3% (446,393)
Aggregate household income in Cliffwood Beach in 2022: $90,915,514
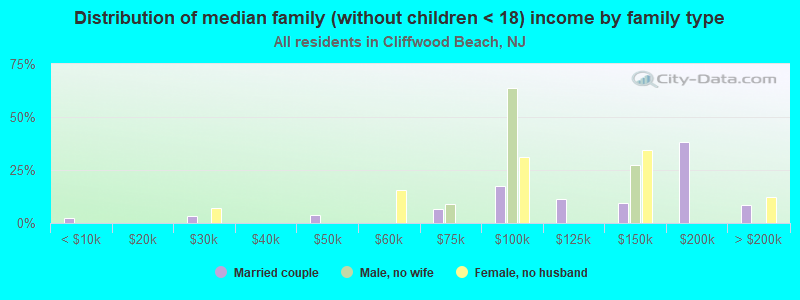
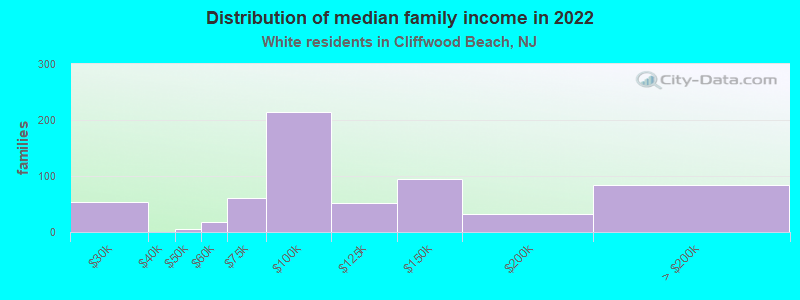
Median family income in Cliffwood Beach in 2022:
Cliffwood Beach:
$89,034
State:
$133,117
Number of families with income $20k - 30k:
Cliffwood Beach:
8.7% (54)
State:
2.4% (33,161)
Number of families with income $40k - 50k:
Cliffwood Beach:
1.0% (6)
State:
3.5% (48,685)
Number of families with income $50k - 60k:
Cliffwood Beach:
3.0% (18)
New Jersey:
4.1% (57,095)
Number of families with income $60k - 75k:
Cliffwood Beach:
9.8% (60)
State:
6.7% (92,267)
Number of families with income $75k - 100k:
Cliffwood Beach:
35.0% (215)
New Jersey:
11.5% (158,630)
Number of families with income $100k - 125k:
Cliffwood Beach:
8.3% (51)
State:
11.5% (158,059)
Number of families with income $125k - 150k:
Cliffwood Beach:
15.3% (94)
State:
9.8% (134,575)
Number of families with income $150k - 200k:
Cliffwood Beach:
5.2% (32)
State:
15.5% (212,728)
Number of families with income > $200k:
Cliffwood Beach:
13.7% (84)
State:
28.3% (389,541)
Median non-family income in Cliffwood Beach in 2022:
Cliffwood Beach:
$72,584
New Jersey:
$58,680
Change in median non-family income between 2000 and 2022:
Cliffwood Beach, New Jersey:
+124.5%
State:
+81.6%
Median per capita income in Cliffwood Beach in 2022:
Cliffwood Beach:
$51,588
State:
$61,044
Change in median per capita income between 2000 and 2022:
Cliffwood Beach, New Jersey:
+126.9%
New Jersey:
+101.8%
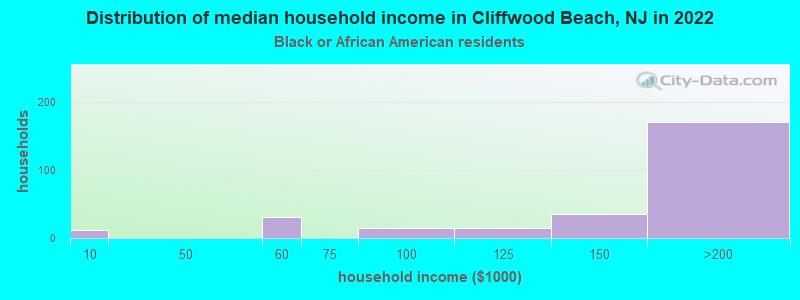
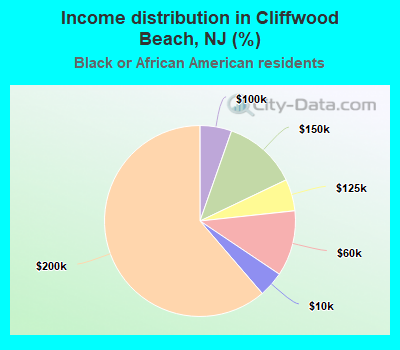
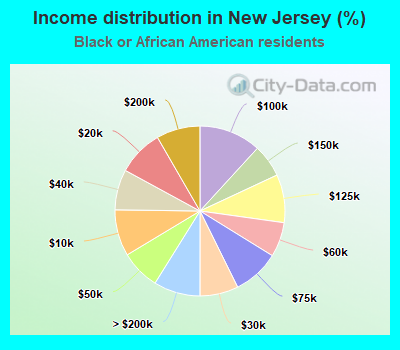
Income statistics for Black or African American residents
Median household income in Cliffwood Beach, NJ in 2022:
Cliffwood Beach:
$113,786
New Jersey:
$65,850
Change in median household income between 2000 and 2022:
Cliffwood Beach, New Jersey:
+90.1%
New Jersey:
+71.0%
Number of households with income < $10k:
Cliffwood Beach:
4.3% (12)
State:
8.9% (38,971)
Number of households with income $10k - 20k:
Cliffwood Beach:
0.0% (0)
State:
8.7% (38,456)
Number of households with income $20k - 30k:
Cliffwood Beach:
0.0% (0)
New Jersey:
7.3% (32,276)
Number of households with income $30k - 40k:
Cliffwood Beach:
0.0% (0)
State:
7.7% (33,867)
Number of households with income $40k - 50k:
Cliffwood Beach:
0.0% (0)
New Jersey:
7.5% (32,945)
Number of households with income $50k - 60k:
Cliffwood Beach:
11.1% (31)
State:
6.6% (29,115)
Number of households with income $60k - 75k:
Cliffwood Beach:
0.0% (0)
New Jersey:
8.9% (39,013)
Number of households with income $75k - 100k:
Cliffwood Beach:
5.4% (15)
State:
11.8% (51,915)
Number of households with income $100k - 125k:
Cliffwood Beach:
5.4% (15)
State:
9.1% (40,243)
Number of households with income $125k - 150k:
Cliffwood Beach:
12.5% (35)
State:
6.3% (27,533)
Number of households with income $150k - 200k:
Cliffwood Beach:
61.3% (171)
State:
8.3% (36,645)
Number of households with income > $200k:
Cliffwood Beach:
0.0% (0)
State:
8.9% (38,974)
Aggregate household income in Cliffwood Beach in 2022: $28,005,967
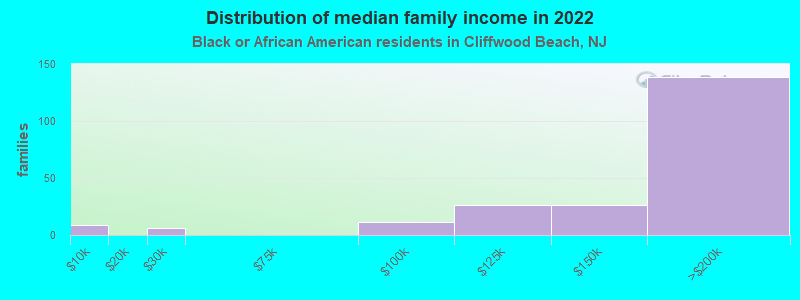
Median family income in Cliffwood Beach in 2022:
Cliffwood Beach:
$146,865
State:
$81,896
Number of families with income < $10k:
Cliffwood Beach:
4.2% (9)
State:
4.7% (12,431)
Number of families with income $20k - 30k:
Cliffwood Beach:
2.9% (6)
New Jersey:
5.5% (14,439)
Number of families with income $75k - 100k:
Cliffwood Beach:
5.2% (11)
State:
12.0% (31,349)
Number of families with income $100k - 125k:
Cliffwood Beach:
12.0% (26)
State:
10.8% (28,173)
Number of families with income $125k - 150k:
Cliffwood Beach:
12.0% (26)
State:
8.2% (21,536)
Number of families with income $150k - 200k:
Cliffwood Beach:
63.7% (139)
State:
11.1% (29,034)
Median per capita income in Cliffwood Beach in 2022:
Cliffwood Beach:
$48,492
State:
$35,632
Change in median per capita income between 2000 and 2022:
Cliffwood Beach, New Jersey:
+123.3%
State:
+104.7%
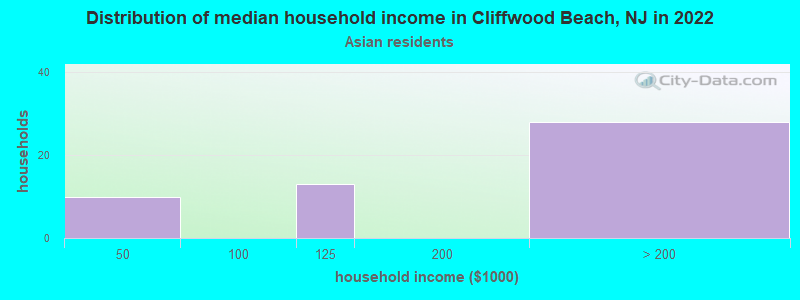
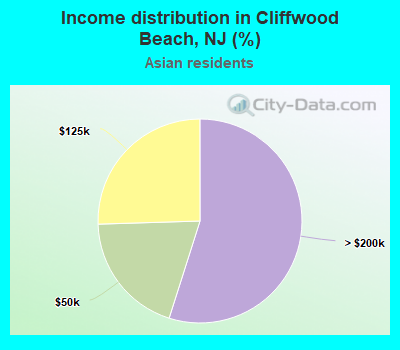
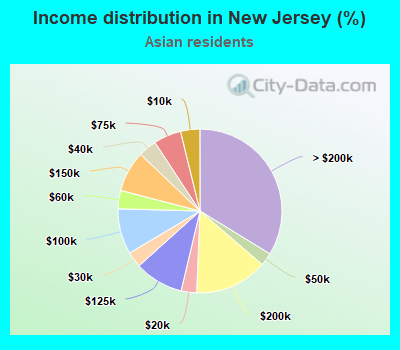
Income statistics for Asian residents
Median household income in Cliffwood Beach, NJ in 2022:
Cliffwood Beach:
$182,311
State:
$144,878
Change in median household income between 2000 and 2022:
Cliffwood Beach, New Jersey:
+35.2%
State:
+100.6%
Number of households with income < $10k:
Cliffwood Beach:
0.0% (0)
State:
3.8% (12,441)
Number of households with income $10k - 20k:
Cliffwood Beach:
0.0% (0)
State:
3.1% (9,957)
Number of households with income $20k - 30k:
Cliffwood Beach:
0.0% (0)
State:
3.1% (10,104)
Number of households with income $30k - 40k:
Cliffwood Beach:
0.0% (0)
State:
3.6% (11,819)
Number of households with income $40k - 50k:
Cliffwood Beach:
19.6% (10)
New Jersey:
2.6% (8,334)
Number of households with income $50k - 60k:
Cliffwood Beach:
0.0% (0)
New Jersey:
3.6% (11,799)
Number of households with income $60k - 75k:
Cliffwood Beach:
0.0% (0)
State:
5.4% (17,671)
Number of households with income $75k - 100k:
Cliffwood Beach:
0.0% (0)
New Jersey:
9.0% (29,301)
Number of households with income $100k - 125k:
Cliffwood Beach:
25.5% (13)
State:
9.6% (31,368)
Number of households with income $125k - 150k:
Cliffwood Beach:
0.0% (0)
New Jersey:
8.1% (26,318)
Number of households with income $150k - 200k:
Cliffwood Beach:
0.0% (0)
State:
14.3% (46,703)
Number of households with income > $200k:
Cliffwood Beach:
54.9% (28)
State:
33.8% (110,048)
Aggregate household income in Cliffwood Beach in 2022: $8,997,343
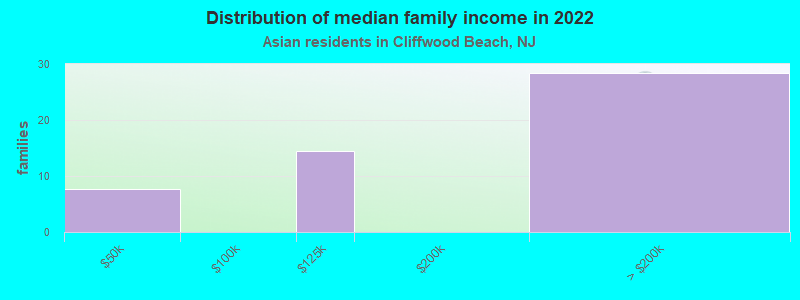
Median family income in Cliffwood Beach in 2022:
Cliffwood Beach:
$194,134
State:
$162,032
Number of families with income $40k - 50k:
Cliffwood Beach:
15.0% (8)
State:
2.1% (5,357)
Number of families with income $100k - 125k:
Cliffwood Beach:
28.7% (14)
State:
9.2% (23,481)
Number of families with income > $200k:
Cliffwood Beach:
56.3% (28)
State:
38.9% (99,016)
Median per capita income in Cliffwood Beach in 2022:
Cliffwood Beach:
$53,825
State:
$62,411
Change in median per capita income between 2000 and 2022:: -32.8%
Cliffwood Beach, New Jersey:
-32.8%
New Jersey:
+126.3%
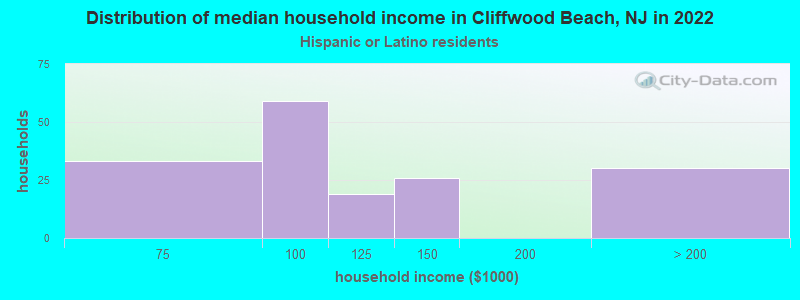
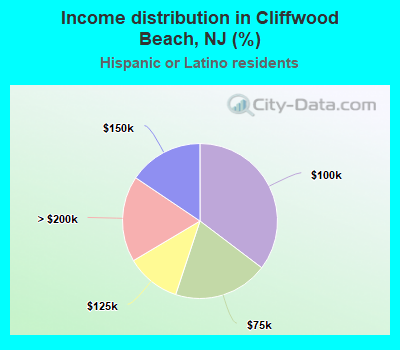
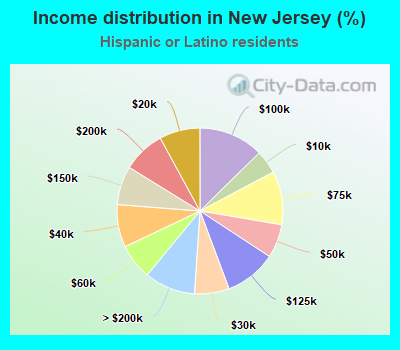
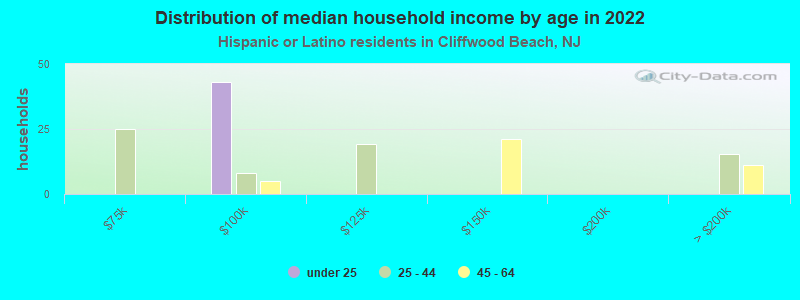
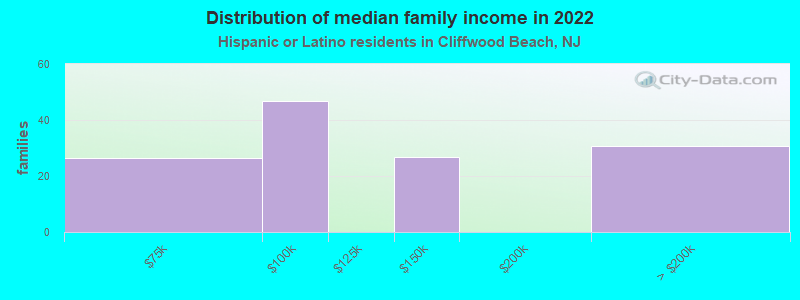
Income statistics for Hispanic or Latino residents
Median household income in Cliffwood Beach, NJ in 2022:
Cliffwood Beach:
$97,513
State:
$72,170
Change in median household income between 2000 and 2022:
Cliffwood Beach, New Jersey:
+33.4%
State:
+82.2%
Number of households with income < $10k:
Cliffwood Beach:
0.0% (0)
State:
4.6% (29,004)
Number of households with income $10k - 20k:
Cliffwood Beach:
0.0% (0)
State:
7.9% (50,233)
Number of households with income $20k - 30k:
Cliffwood Beach:
0.0% (0)
State:
6.7% (42,724)
Number of households with income $30k - 40k:
Cliffwood Beach:
0.0% (0)
State:
8.3% (52,621)
Number of households with income $40k - 50k:
Cliffwood Beach:
0.0% (0)
New Jersey:
6.6% (41,539)
Number of households with income $50k - 60k:
Cliffwood Beach:
0.0% (0)
New Jersey:
6.9% (43,976)
Number of households with income $60k - 75k:
Cliffwood Beach:
19.8% (33)
State:
10.4% (66,157)
Number of households with income $75k - 100k:
Cliffwood Beach:
35.3% (59)
State:
12.7% (80,102)
Number of households with income $100k - 125k:
Cliffwood Beach:
11.4% (19)
State:
10.1% (63,832)
Number of households with income $125k - 150k:
Cliffwood Beach:
15.6% (26)
State:
7.6% (47,874)
Number of households with income $150k - 200k:
Cliffwood Beach:
0.0% (0)
State:
8.3% (52,287)
Number of households with income > $200k:
Cliffwood Beach:
18.0% (30)
New Jersey:
9.9% (62,842)
Aggregate household income in Cliffwood Beach in 2022: $17,712,002
Median family income in Cliffwood Beach in 2022:
Cliffwood Beach:
$89,600
State:
$77,272
Number of families with income $60k - 75k:
Cliffwood Beach:
20.2% (26)
State:
11.1% (52,120)
Number of families with income $75k - 100k:
Cliffwood Beach:
35.8% (47)
State:
13.3% (62,373)
Number of families with income $125k - 150k:
Cliffwood Beach:
20.5% (27)
State:
7.5% (35,076)
Number of families with income > $200k:
Cliffwood Beach:
23.4% (31)
State:
10.9% (51,269)
Median per capita income in Cliffwood Beach in 2022:
Cliffwood Beach:
$28,467
New Jersey:
$30,987
Change in median per capita income between 2000 and 2022:
Cliffwood Beach, New Jersey:
+69.3%
New Jersey:
+109.3%
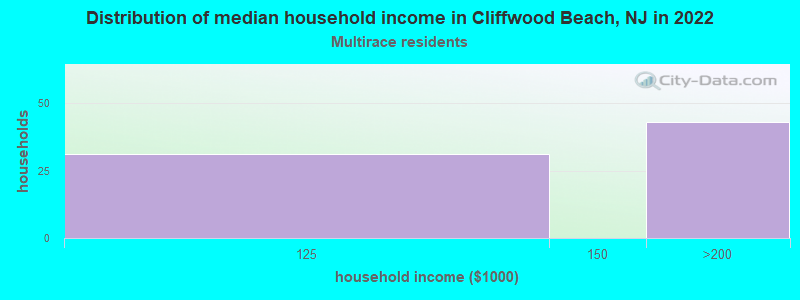
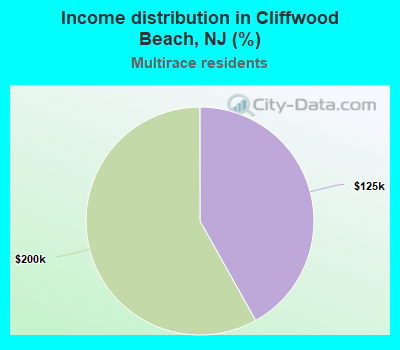
Income statistics for Multirace residents
Median household income in Cliffwood Beach, NJ in 2022:
Cliffwood Beach:
$154,794
New Jersey:
$84,272
Number of households with income < $10k:
Cliffwood Beach:
0.0% (0)
New Jersey:
4.4% (15,172)
Number of households with income $10k - 20k:
Cliffwood Beach:
0.0% (0)
State:
7.1% (24,399)
Number of households with income $20k - 30k:
Cliffwood Beach:
0.0% (0)
New Jersey:
5.8% (19,827)
Number of households with income $30k - 40k:
Cliffwood Beach:
0.0% (0)
State:
6.7% (23,047)
Number of households with income $40k - 50k:
Cliffwood Beach:
0.0% (0)
New Jersey:
5.9% (20,379)
Number of households with income $50k - 60k:
Cliffwood Beach:
0.0% (0)
State:
5.8% (19,984)
Number of households with income $60k - 75k:
Cliffwood Beach:
0.0% (0)
State:
9.4% (32,244)
Number of households with income $75k - 100k:
Cliffwood Beach:
0.0% (0)
New Jersey:
12.8% (43,746)
Number of households with income $100k - 125k:
Cliffwood Beach:
41.9% (31)
State:
10.4% (35,588)
Number of households with income $125k - 150k:
Cliffwood Beach:
0.0% (0)
State:
7.7% (26,354)
Number of households with income $150k - 200k:
Cliffwood Beach:
58.1% (43)
State:
9.9% (33,977)
Number of households with income > $200k:
Cliffwood Beach:
0.0% (0)
New Jersey:
14.1% (48,377)
Aggregate household income in Cliffwood Beach in 2022: $9,292,566
Median per capita income in Cliffwood Beach in 2022:
Cliffwood Beach:
$7,254
State:
$36,016
Change in median per capita income between 2000 and 2022:
Cliffwood Beach, New Jersey:
+43.0%
New Jersey:
+129.2%
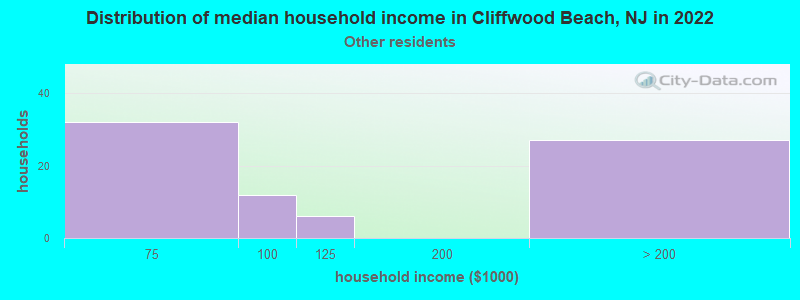
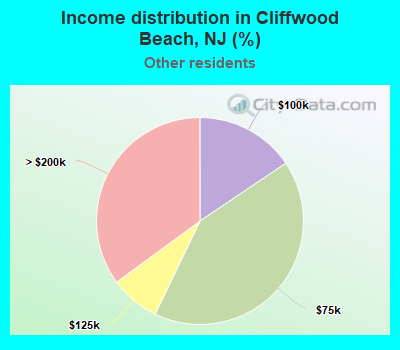
Income statistics for other residents
Number of households with income < $10k:
Cliffwood Beach:
0.0% (0)
New Jersey:
4.7% (13,969)
Number of households with income $10k - 20k:
Cliffwood Beach:
0.0% (0)
New Jersey:
8.9% (26,341)
Number of households with income $20k - 30k:
Cliffwood Beach:
0.0% (0)
State:
7.1% (21,158)
Number of households with income $30k - 40k:
Cliffwood Beach:
0.0% (0)
New Jersey:
9.6% (28,479)
Number of households with income $40k - 50k:
Cliffwood Beach:
0.0% (0)
New Jersey:
6.6% (19,415)
Number of households with income $50k - 60k:
Cliffwood Beach:
0.0% (0)
State:
7.5% (22,348)
Number of households with income $60k - 75k:
Cliffwood Beach:
41.6% (32)
New Jersey:
10.5% (31,179)
Number of households with income $75k - 100k:
Cliffwood Beach:
15.6% (12)
State:
13.3% (39,515)
Number of households with income $100k - 125k:
Cliffwood Beach:
7.8% (6)
State:
9.4% (27,806)
Number of households with income $125k - 150k:
Cliffwood Beach:
0.0% (0)
State:
7.1% (20,898)
Number of households with income $150k - 200k:
Cliffwood Beach:
0.0% (0)
State:
7.8% (23,101)
Number of households with income > $200k:
Cliffwood Beach:
35.1% (27)
New Jersey:
7.4% (21,791)
Aggregate household income in Cliffwood Beach in 2022: $9,877,127
Median per capita income in Cliffwood Beach in 2022:
Cliffwood Beach:
$43,885
New Jersey:
$27,830
Discuss Cliffwood Beach, New Jersey (NJ) on our hugely popular New Jersey forum.