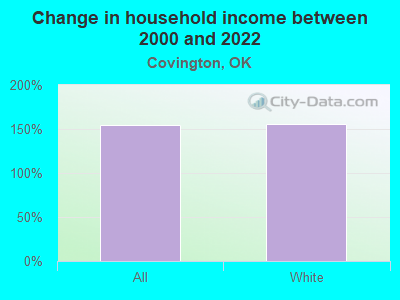
The median household income in Covington, OK in 2022 was $68,678, which was 13.1% greater than the median annual income of $59,673 across the entire state of Oklahoma. Compared to the median income of $26,979 in 2000 this represents an increase of 60.7%. The per capita income in 2022 was $28,497, which means an increase of 55.1% compared to 2000 when it was $12,788.
Whole page based on the data from 2000 / 2022 when the population of Covington, Oklahoma was 553 / 397
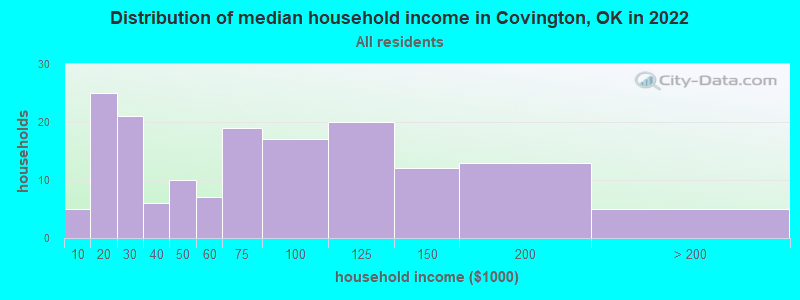
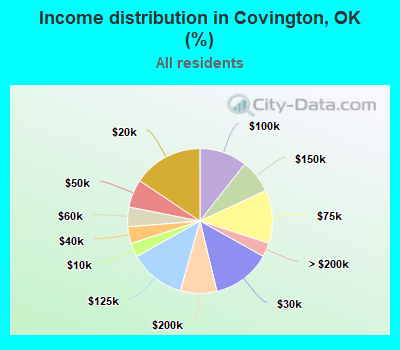
Income statistics for all residents
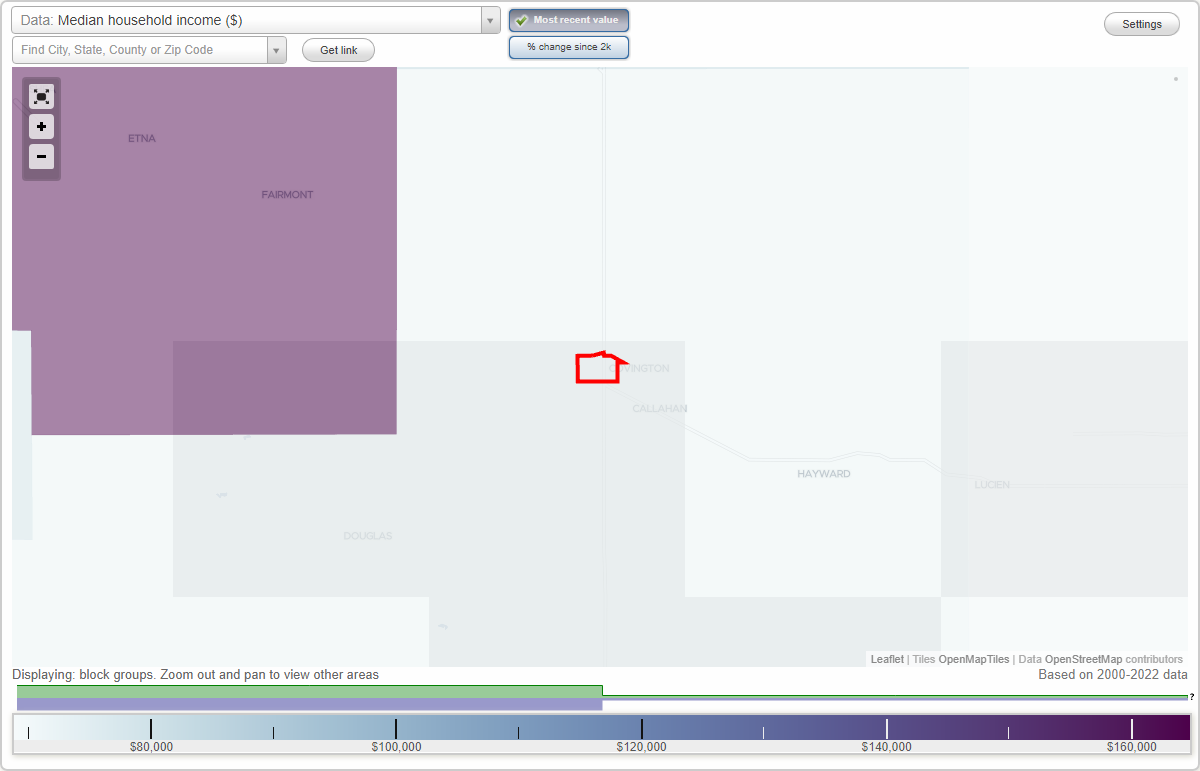
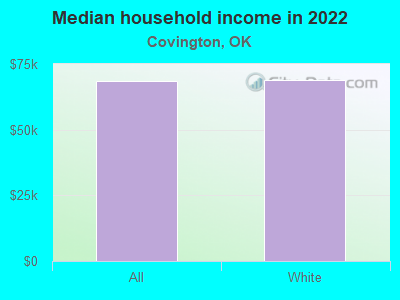
Median household income in Covington, OK in 2022:
Covington:
$68,679
State:
$59,673
Number of households with income < $10k:
Covington:
3.1% (5)
State:
6.4% (100,950)
Number of households with income $10k - 20k:
Covington:
15.6% (25)
Oklahoma:
8.8% (137,709)
Number of households with income $20k - 30k:
Covington:
13.1% (21)
State:
9.1% (143,661)
Number of households with income $30k - 40k:
Covington:
3.8% (6)
State:
9.0% (141,098)
Number of households with income $40k - 50k:
Covington:
6.2% (10)
State:
8.9% (140,217)
Number of households with income $50k - 60k:
Covington:
4.4% (7)
State:
8.1% (126,882)
Number of households with income $60k - 75k:
Covington:
11.9% (19)
State:
10.0% (157,916)
Number of households with income $75k - 100k:
Covington:
10.6% (17)
State:
12.4% (195,015)
Number of households with income $100k - 125k:
Covington:
12.5% (20)
State:
9.0% (141,779)
Number of households with income $125k - 150k:
Covington:
7.5% (12)
Oklahoma:
5.8% (91,594)
Number of households with income $150k - 200k:
Covington:
8.1% (13)
State:
6.3% (98,589)
Number of households with income > $200k:
Covington:
3.1% (5)
State:
6.2% (97,770)
Aggregate household income in Covington in 2022: $12,345,417
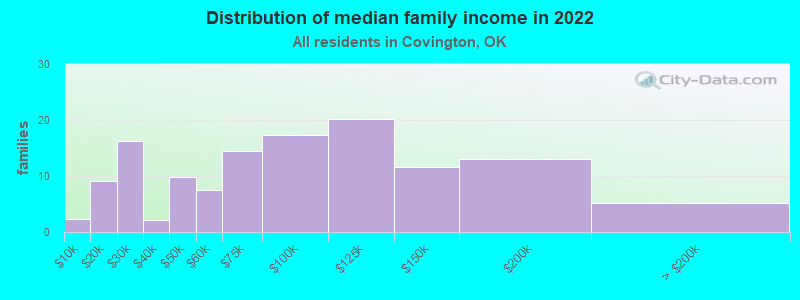
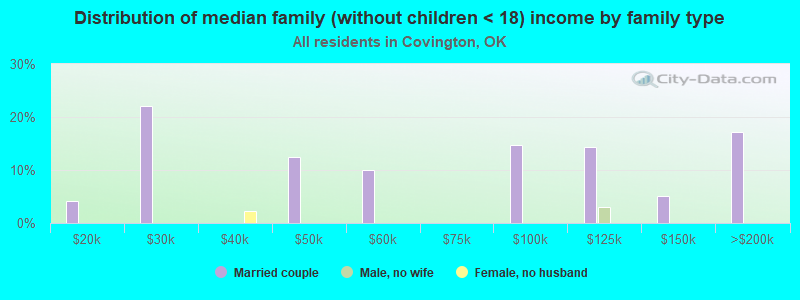
Median family income in Covington in 2022:
Covington:
$81,922
State:
$75,476
Number of families with income < $10k:
Covington:
1.8% (2)
State:
4.2% (42,724)
Number of families with income $10k - 20k:
Covington:
7.1% (9)
State:
4.9% (49,571)
Number of families with income $20k - 30k:
Covington:
12.5% (16)
State:
6.3% (64,367)
Number of families with income $30k - 40k:
Covington:
1.7% (2)
Oklahoma:
7.5% (76,467)
Number of families with income $40k - 50k:
Covington:
7.7% (10)
State:
8.3% (84,578)
Number of families with income $50k - 60k:
Covington:
5.8% (8)
State:
7.8% (79,642)
Number of families with income $60k - 75k:
Covington:
11.2% (14)
State:
10.6% (108,169)
Number of families with income $75k - 100k:
Covington:
13.5% (17)
State:
14.6% (148,857)
Number of families with income $100k - 125k:
Covington:
15.6% (20)
State:
11.2% (113,480)
Number of families with income $125k - 150k:
Covington:
9.0% (12)
Oklahoma:
7.6% (77,253)
Number of families with income $150k - 200k:
Covington:
10.2% (13)
State:
8.4% (85,947)
Number of families with income > $200k:
Covington:
4.0% (5)
Oklahoma:
8.5% (86,531)
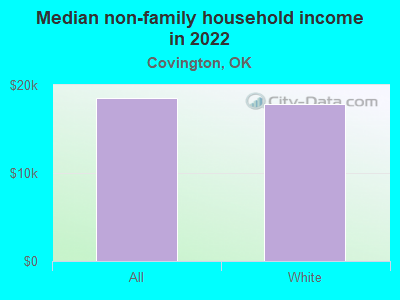
Median non-family income in Covington in 2022:
Covington:
$18,533
State:
$35,419
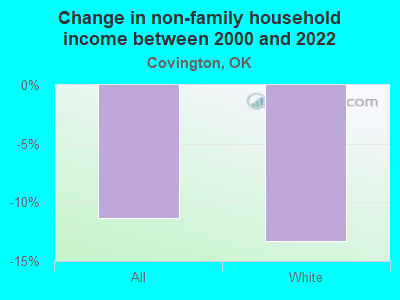
Change in median non-family income between 2000 and 2022:: -11.3%
Covington, Oklahoma:
-11.3%
State:
+83.2%
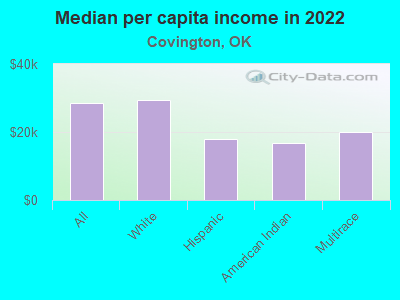
Median per capita income in Covington in 2022:
Covington:
$28,497
State:
$32,930
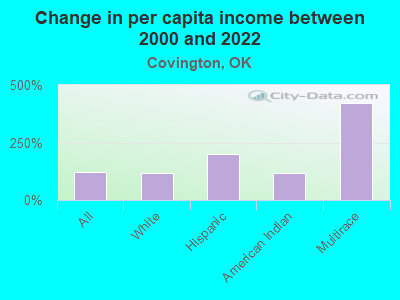
Change in median per capita income between 2000 and 2022:
Covington, Oklahoma:
+122.8%
State:
+86.6%
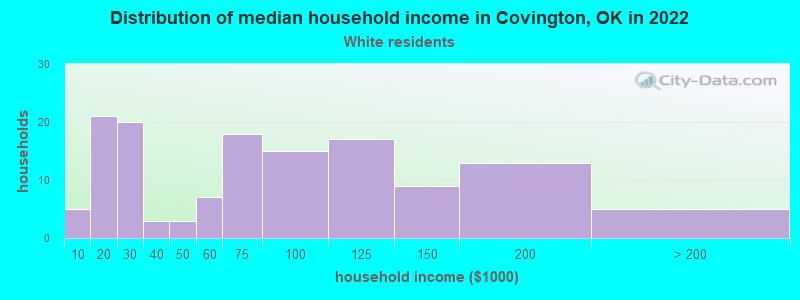
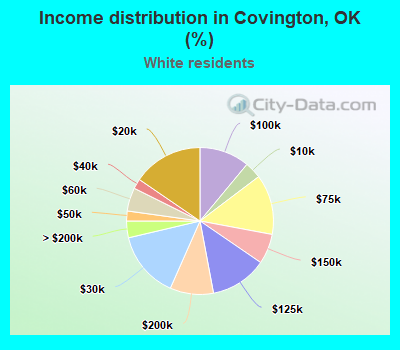
Income statistics for White residents
Median household income in Covington, OK in 2022:
Covington:
$69,046
State:
$63,444
Number of households with income < $10k:
Covington:
3.7% (5)
Oklahoma:
5.5% (60,994)
Number of households with income $10k - 20k:
Covington:
15.4% (21)
State:
8.2% (91,263)
Number of households with income $20k - 30k:
Covington:
14.7% (20)
State:
8.7% (96,988)
Number of households with income $30k - 40k:
Covington:
2.2% (3)
State:
8.4% (93,121)
Number of households with income $40k - 50k:
Covington:
2.2% (3)
State:
8.6% (95,446)
Number of households with income $50k - 60k:
Covington:
5.1% (7)
State:
7.9% (87,723)
Number of households with income $60k - 75k:
Covington:
13.2% (18)
State:
9.9% (109,955)
Number of households with income $75k - 100k:
Covington:
11.0% (15)
State:
12.9% (143,880)
Number of households with income $100k - 125k:
Covington:
12.5% (17)
State:
9.7% (107,851)
Number of households with income $125k - 150k:
Covington:
6.6% (9)
State:
6.3% (69,802)
Number of households with income $150k - 200k:
Covington:
9.6% (13)
State:
6.9% (76,863)
Number of households with income > $200k:
Covington:
3.7% (5)
State:
7.0% (78,099)
Aggregate household income in Covington in 2022: $10,793,151
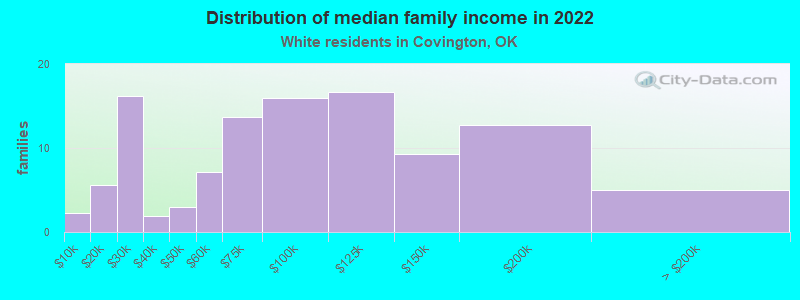
Median family income in Covington in 2022:
Covington:
$84,554
State:
$82,251
Number of families with income < $10k:
Covington:
2.0% (2)
State:
3.4% (24,057)
Number of families with income $10k - 20k:
Covington:
5.1% (6)
State:
4.1% (29,440)
Number of families with income $20k - 30k:
Covington:
14.8% (16)
Oklahoma:
5.7% (40,670)
Number of families with income $30k - 40k:
Covington:
1.8% (2)
State:
6.5% (46,540)
Number of families with income $40k - 50k:
Covington:
2.8% (3)
State:
7.7% (55,082)
Number of families with income $50k - 60k:
Covington:
6.5% (7)
State:
7.5% (53,408)
Number of families with income $60k - 75k:
Covington:
12.5% (14)
State:
10.4% (74,624)
Number of families with income $75k - 100k:
Covington:
14.6% (16)
State:
15.3% (109,679)
Number of families with income $100k - 125k:
Covington:
15.3% (17)
State:
12.0% (86,208)
Number of families with income $125k - 150k:
Covington:
8.5% (9)
State:
8.3% (59,328)
Number of families with income $150k - 200k:
Covington:
11.6% (13)
State:
9.4% (67,640)
Number of families with income > $200k:
Covington:
4.5% (5)
State:
9.7% (69,551)
Median non-family income in Covington in 2022:
Covington:
$17,808
Oklahoma:
$36,941
Change in median non-family income between 2000 and 2022:: -13.3%
Covington, Oklahoma:
-13.3%
State:
+83.5%
Median per capita income in Covington in 2022:
Covington:
$29,405
State:
$37,390
Change in median per capita income between 2000 and 2022:
Covington, Oklahoma:
+119.3%
State:
+92.4%
Income statistics for Hispanic or Latino residents
Median per capita income in Covington in 2022:
Covington:
$18,045
Oklahoma:
$19,473
Income statistics for American Indian and Alaska Native residents
Aggregate household income in Covington in 2022: $796,285
Median per capita income in Covington in 2022:
Covington:
$16,777
State:
$25,549
Change in median per capita income between 2000 and 2022:
Covington, Oklahoma:
+118.8%
State:
+118.7%
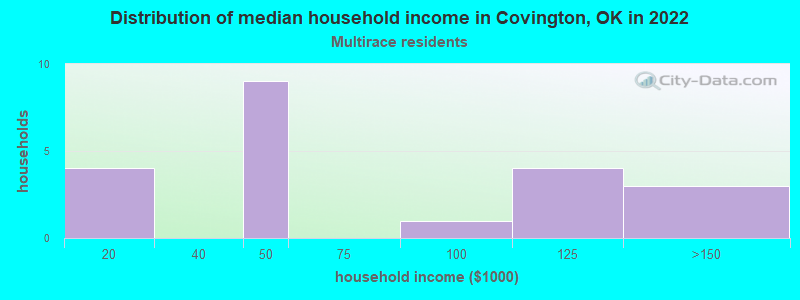
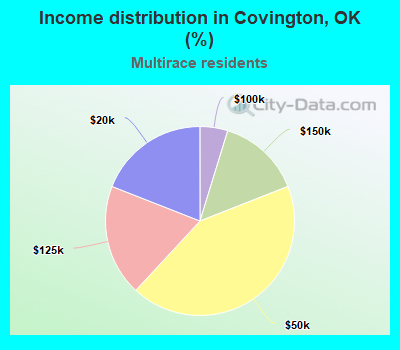
Income statistics for Multirace residents
Number of households with income < $10k:
Covington:
0.0% (0)
State:
6.8% (11,975)
Number of households with income $10k - 20k:
Covington:
19.0% (4)
Oklahoma:
8.9% (15,797)
Number of households with income $20k - 30k:
Covington:
0.0% (0)
State:
10.2% (18,071)
Number of households with income $30k - 40k:
Covington:
0.0% (0)
Oklahoma:
11.0% (19,477)
Number of households with income $40k - 50k:
Covington:
42.9% (9)
State:
9.3% (16,501)
Number of households with income $50k - 60k:
Covington:
0.0% (0)
State:
8.9% (15,635)
Number of households with income $60k - 75k:
Covington:
0.0% (0)
State:
10.9% (19,250)
Number of households with income $75k - 100k:
Covington:
4.8% (1)
State:
11.5% (20,279)
Number of households with income $100k - 125k:
Covington:
19.0% (4)
Oklahoma:
8.0% (14,067)
Number of households with income $125k - 150k:
Covington:
14.3% (3)
State:
4.9% (8,612)
Number of households with income $150k - 200k:
Covington:
0.0% (0)
State:
5.0% (8,897)
Number of households with income > $200k:
Covington:
0.0% (0)
Oklahoma:
4.5% (7,970)
Aggregate household income in Covington in 2022: $1,386,999
Median per capita income in Covington in 2022:
Covington:
$19,920
Oklahoma:
$23,085
Discuss Covington, Oklahoma (OK) on our hugely popular Oklahoma forum.