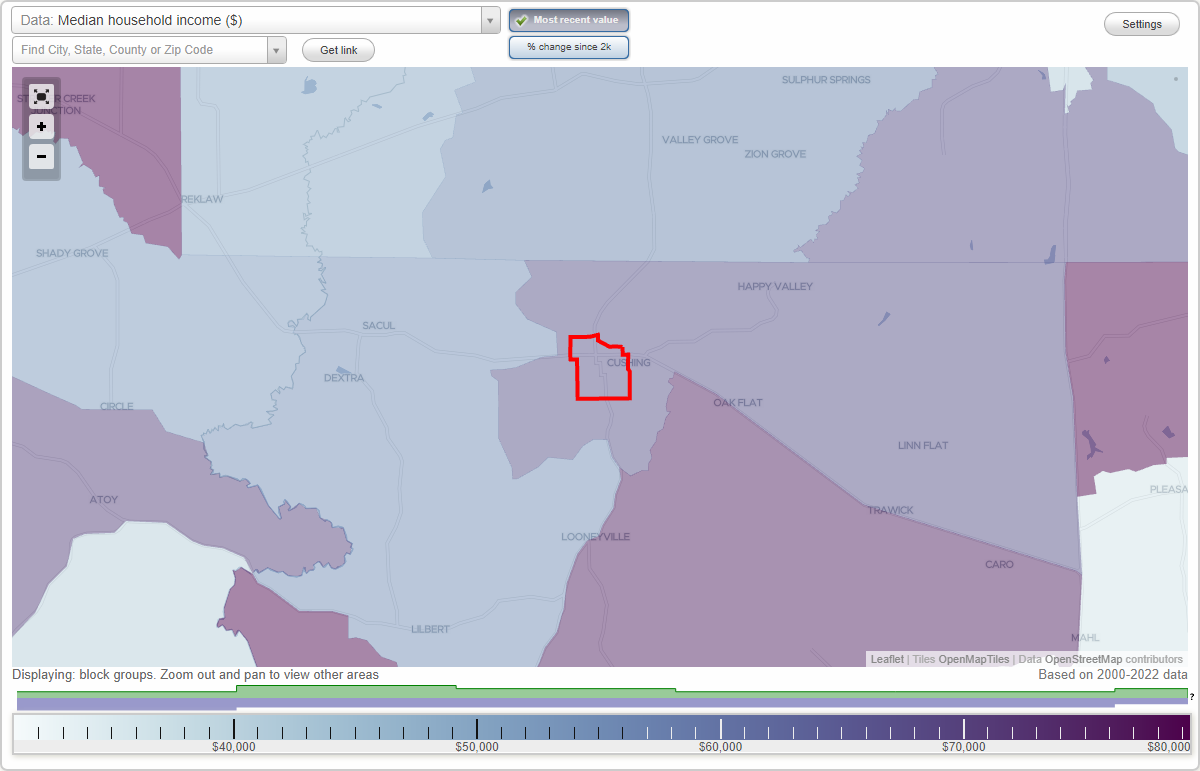
The median household income in Cushing, TX in 2022 was $57,459, which was 25.8% less than the median annual income of $72,284 across the entire state of Texas. Compared to the median income of $28,333 in 2000 this represents an increase of 50.7%. The per capita income in 2022 was $40,197, which means an increase of 61.3% compared to 2000 when it was $15,570.
Whole page based on the data from 2000 / 2022 when the population of Cushing, Texas was 637 / 742
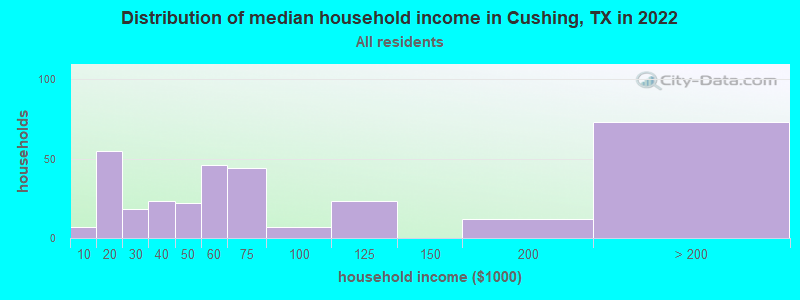
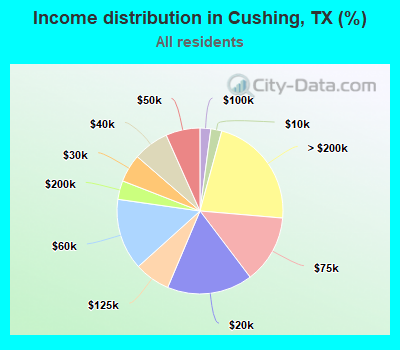
Income statistics for all residents
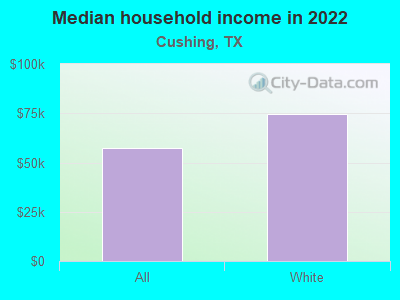
Median household income in Cushing, TX in 2022:
Cushing:
$57,459
Texas:
$72,284
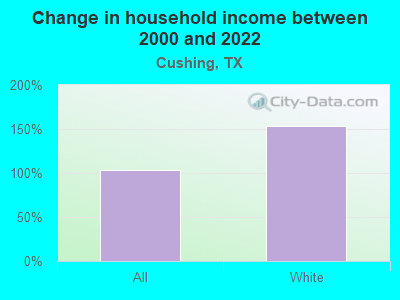
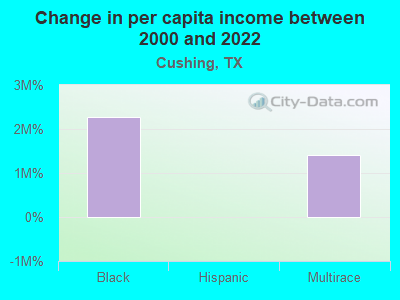
Change in median household income between 2000 and 2022:
Cushing, Texas:
+102.8%
Texas:
+81.0%
Number of households with income < $10k:
Cushing:
2.1% (7)
State:
5.5% (611,011)
Number of households with income $10k - 20k:
Cushing:
16.7% (55)
Texas:
6.7% (743,157)
Number of households with income $20k - 30k:
Cushing:
5.5% (18)
Texas:
7.2% (803,381)
Number of households with income $30k - 40k:
Cushing:
7.0% (23)
Texas:
7.8% (866,080)
Number of households with income $40k - 50k:
Cushing:
6.7% (22)
State:
7.3% (810,440)
Number of households with income $50k - 60k:
Cushing:
13.9% (46)
State:
7.2% (799,783)
Number of households with income $60k - 75k:
Cushing:
13.3% (44)
State:
9.9% (1,095,384)
Number of households with income $75k - 100k:
Cushing:
2.1% (7)
Texas:
12.8% (1,419,057)
Number of households with income $100k - 125k:
Cushing:
7.0% (23)
State:
9.5% (1,054,577)
Number of households with income $125k - 150k:
Cushing:
0.0% (0)
Texas:
6.7% (741,518)
Number of households with income $150k - 200k:
Cushing:
3.6% (12)
State:
8.7% (961,776)
Number of households with income > $200k:
Cushing:
22.1% (73)
State:
10.7% (1,181,544)
Aggregate household income in Cushing in 2022: $29,619,494
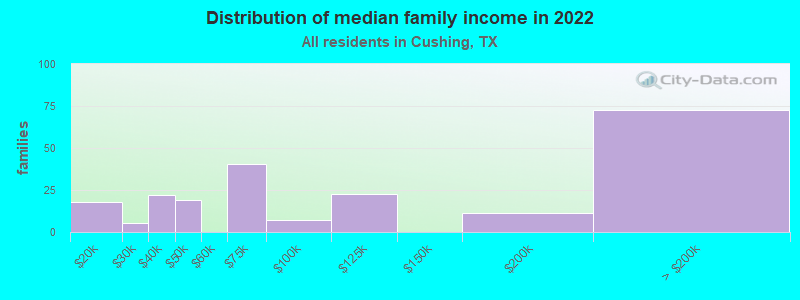
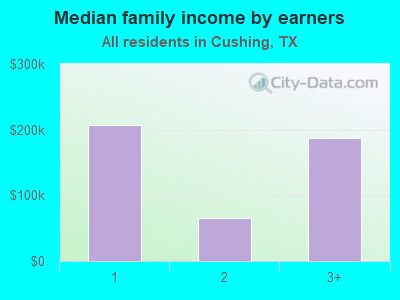
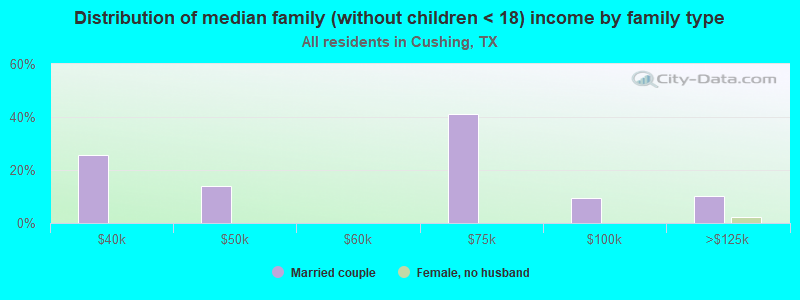
Median family income in Cushing in 2022:
Cushing:
$82,833
State:
$86,267
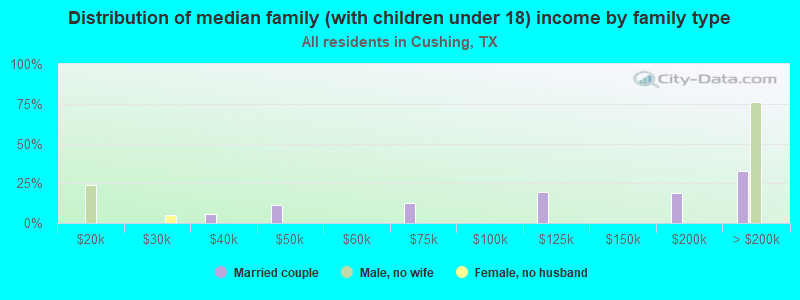
Number of families with income $10k - 20k:
Cushing:
8.2% (18)
State:
4.3% (324,514)
Number of families with income $20k - 30k:
Cushing:
2.3% (5)
Texas:
5.8% (430,949)
Number of families with income $30k - 40k:
Cushing:
10.2% (22)
State:
6.6% (493,535)
Number of families with income $40k - 50k:
Cushing:
8.6% (19)
State:
6.7% (499,663)
Number of families with income $60k - 75k:
Cushing:
18.6% (41)
State:
9.5% (710,229)
Number of families with income $75k - 100k:
Cushing:
3.4% (7)
State:
13.6% (1,015,480)
Number of families with income $100k - 125k:
Cushing:
10.2% (22)
State:
10.7% (797,961)
Number of families with income $150k - 200k:
Cushing:
5.3% (12)
State:
10.7% (804,459)
Number of families with income > $200k:
Cushing:
33.2% (72)
State:
13.5% (1,013,514)
Median income for 3 person families:
Cushing:
$73,029
Texas:
$86,290
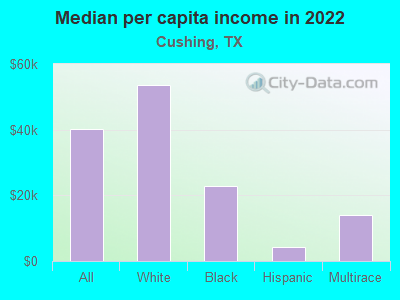
Median per capita income in Cushing in 2022:
Cushing:
$40,197
State:
$38,123
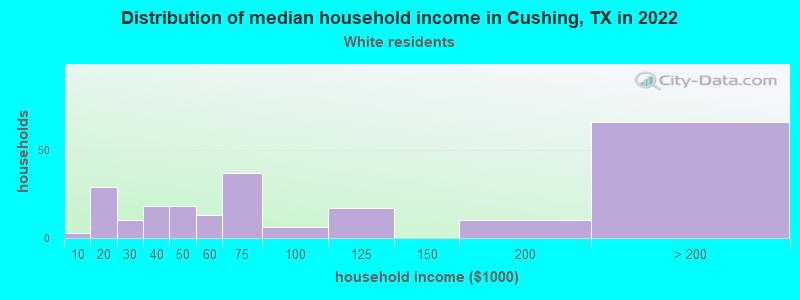
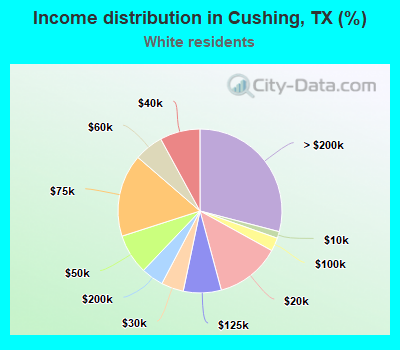
Income statistics for White residents
Median household income in Cushing, TX in 2022:
Cushing:
$74,439
State:
$82,032
Number of households with income < $10k:
Cushing:
1.3% (3)
State:
4.7% (273,716)
Number of households with income $10k - 20k:
Cushing:
12.8% (29)
State:
5.5% (322,702)
Number of households with income $20k - 30k:
Cushing:
4.4% (10)
State:
6.2% (363,947)
Number of households with income $30k - 40k:
Cushing:
7.9% (18)
State:
6.8% (399,275)
Number of households with income $40k - 50k:
Cushing:
7.9% (18)
Texas:
6.5% (383,417)
Number of households with income $50k - 60k:
Cushing:
5.7% (13)
State:
6.6% (388,535)
Number of households with income $60k - 75k:
Cushing:
16.3% (37)
Texas:
9.7% (566,295)
Number of households with income $75k - 100k:
Cushing:
2.6% (6)
State:
13.0% (760,276)
Number of households with income $100k - 125k:
Cushing:
7.5% (17)
State:
10.2% (597,596)
Number of households with income $125k - 150k:
Cushing:
0.0% (0)
Texas:
7.4% (436,830)
Number of households with income $150k - 200k:
Cushing:
4.4% (10)
State:
9.9% (583,067)
Number of households with income > $200k:
Cushing:
29.1% (66)
Texas:
13.5% (792,647)
Aggregate household income in Cushing in 2022: $23,935,550
Median non-family income in Cushing in 2022:
Cushing:
$18,340
Texas:
$50,587
Change in median non-family income between 2000 and 2022:
Cushing, Texas:
+48.8%
State:
+87.7%
Median per capita income in Cushing in 2022:
Cushing:
$53,491
State:
$47,740
Income statistics for Black or African American residents
Median per capita income in Cushing in 2022:
Cushing:
$22,716
State:
$30,490
Income statistics for Hispanic or Latino residents
Aggregate household income in Cushing in 2022: $575,129
Median per capita income in Cushing in 2022:
Cushing:
$4,161
State:
$24,862
Change in median per capita income between 2000 and 2022:: -61.4%
Cushing, Texas:
-61.4%
Texas:
+130.8%
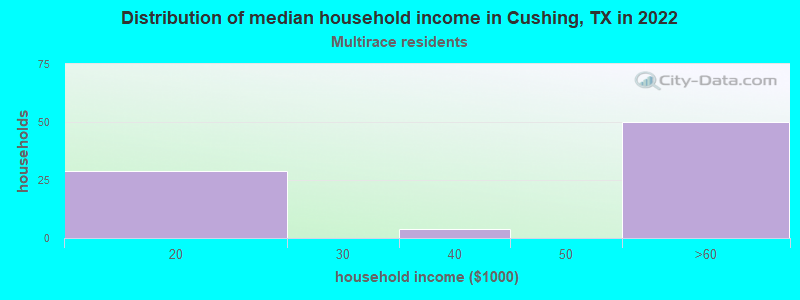
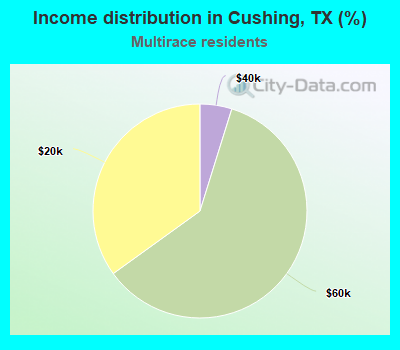
Income statistics for Multirace residents
Number of households with income < $10k:
Cushing:
0.0% (0)
Texas:
5.5% (122,324)
Number of households with income $10k - 20k:
Cushing:
34.9% (29)
State:
8.2% (182,232)
Number of households with income $20k - 30k:
Cushing:
0.0% (0)
State:
8.5% (189,456)
Number of households with income $30k - 40k:
Cushing:
4.8% (4)
State:
8.9% (197,499)
Number of households with income $40k - 50k:
Cushing:
0.0% (0)
State:
8.7% (191,735)
Number of households with income $50k - 60k:
Cushing:
60.2% (50)
State:
8.0% (177,535)
Number of households with income $60k - 75k:
Cushing:
0.0% (0)
State:
10.5% (232,479)
Number of households with income $75k - 100k:
Cushing:
0.0% (0)
State:
13.1% (290,448)
Number of households with income $100k - 125k:
Cushing:
0.0% (0)
State:
8.6% (191,595)
Number of households with income $125k - 150k:
Cushing:
0.0% (0)
State:
6.0% (133,361)
Number of households with income $150k - 200k:
Cushing:
0.0% (0)
State:
7.2% (159,195)
Number of households with income > $200k:
Cushing:
0.0% (0)
State:
6.7% (148,064)
Aggregate household income in Cushing in 2022: $3,039,878
Median per capita income in Cushing in 2022:
Cushing:
$14,146
Texas:
$26,785
Discuss Cushing, Texas (TX) on our hugely popular Texas forum.