East Bridgewater, Massachusetts (MA) income map, earnings map, and wages data
The median household income in East Bridgewater, MA in 2022 was $111,884, which was 15.5% greater than the median annual income of $94,488 across the entire state of Massachusetts. Compared to the median income of $60,311 in 2000 this represents an increase of 46.1%. The per capita income in 2022 was $51,416, which means an increase of 54.2% compared to 2000 when it was $23,532.
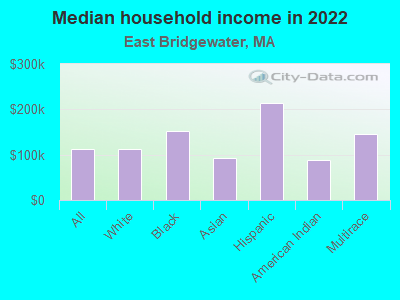
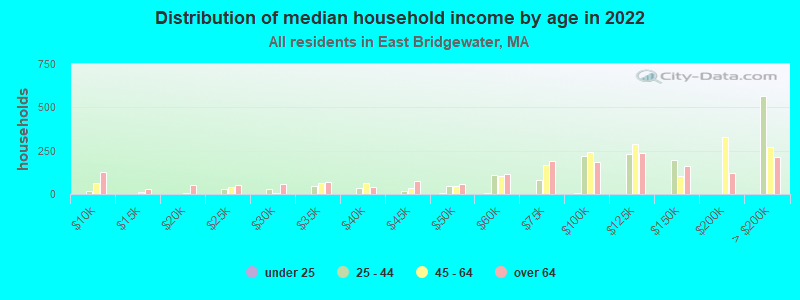
Income statistics for all residents
Median household income in East Bridgewater, MA in 2022:| East Bridgewater: | $111,885 |
| State: | $94,488 |
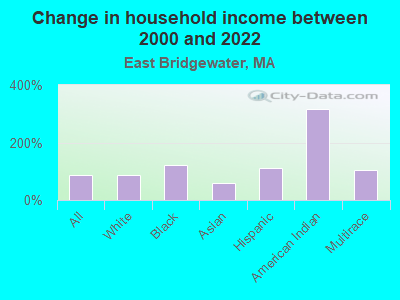
Change in median household income between 2000 and 2022:| East Bridgewater, Massachusetts: | +85.5% |
| State: | +87.1% |
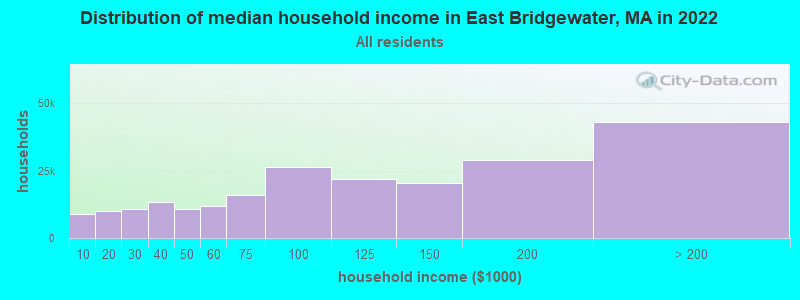
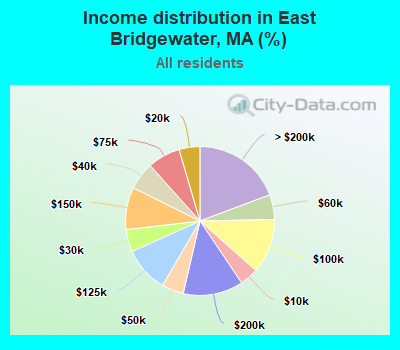
Number of households with income < $10k:| East Bridgewater: | 4.0% (8,961) |
| State: | 5.2% (146,170) |
Number of households with income $10k - 20k:| East Bridgewater: | 4.5% (10,073) |
| Massachusetts: | 6.4% (180,001) |
Number of households with income $20k - 30k:| East Bridgewater: | 4.9% (10,871) |
| State: | 5.6% (156,667) |
Number of households with income $30k - 40k:| East Bridgewater: | 6.0% (13,358) |
| State: | 5.6% (157,168) |
Number of households with income $40k - 50k:| East Bridgewater: | 4.8% (10,599) |
| Massachusetts: | 5.4% (151,455) |
Number of households with income $50k - 60k:| East Bridgewater: | 5.4% (12,008) |
| State: | 5.1% (142,726) |
Number of households with income $60k - 75k:| East Bridgewater: | 7.1% (15,843) |
| Massachusetts: | 7.6% (212,203) |
Number of households with income $75k - 100k:| East Bridgewater: | 11.8% (26,367) |
| State: | 11.3% (317,064) |
Number of households with income $100k - 125k:| East Bridgewater: | 9.9% (22,023) |
| State: | 9.7% (270,603) |
Number of households with income $125k - 150k:| East Bridgewater: | 9.2% (20,433) |
| Massachusetts: | 8.0% (223,140) |
Number of households with income $150k - 200k:| East Bridgewater: | 13.1% (29,044) |
| Massachusetts: | 11.0% (308,695) |
Number of households with income > $200k:| East Bridgewater: | 19.3% (42,965) |
| State: | 19.0% (531,884) |
Aggregate household income in East Bridgewater in 2022: $4,019,199,047
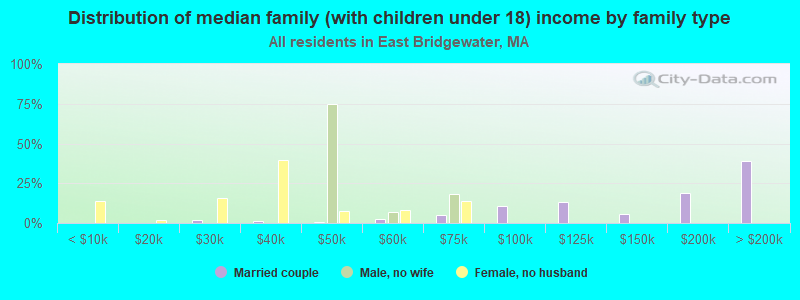
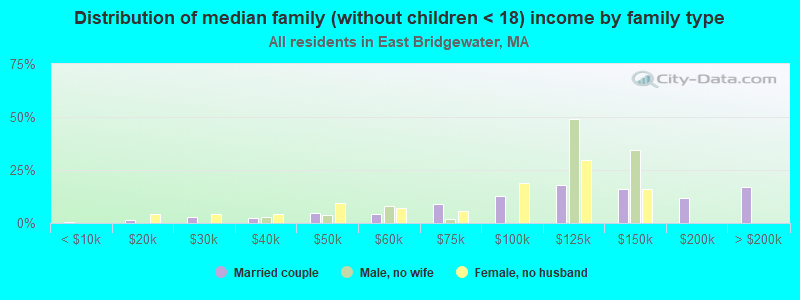
Median family income in East Bridgewater in 2022:| East Bridgewater: | $128,180 |
| State: | $120,263 |
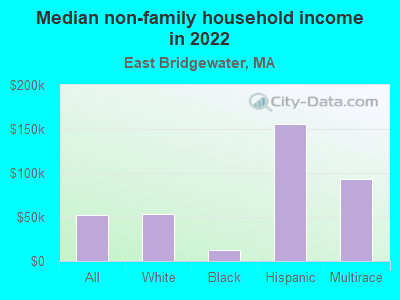
Median non-family income in East Bridgewater in 2022:| East Bridgewater: | $52,637 |
| State: | $55,979 |
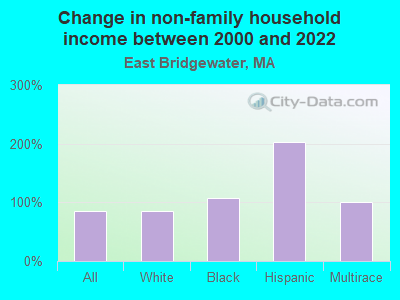
Change in median non-family income between 2000 and 2022:| East Bridgewater, Massachusetts: | +86.5% |
| Massachusetts: | +88.0% |
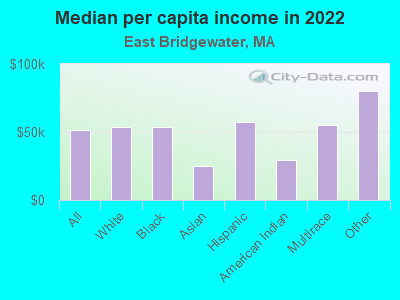
Median per capita income in East Bridgewater in 2022:| East Bridgewater: | $51,417 |
| State: | $54,025 |
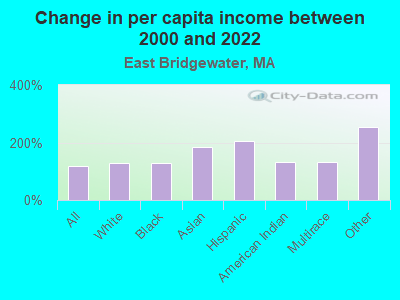
Change in median per capita income between 2000 and 2022:| East Bridgewater, Massachusetts: | +118.5% |
| State: | +108.2% |
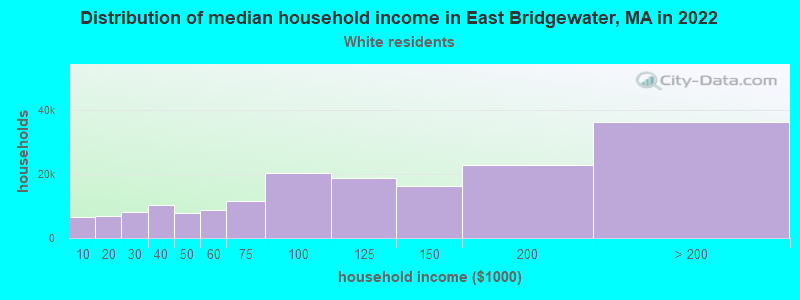
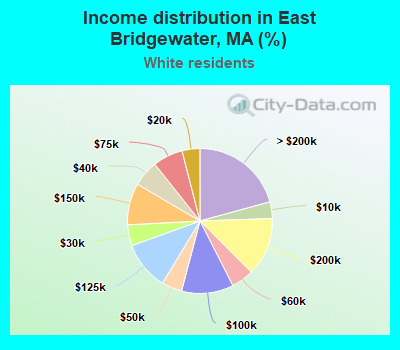
Income statistics for White residents
Median household income in East Bridgewater, MA in 2022:| East Bridgewater: | $112,630 |
| State: | $101,391 |
Change in median household income between 2000 and 2022:| East Bridgewater, Massachusetts: | +87.1% |
| Massachusetts: | +93.3% |
Number of households with income < $10k:| East Bridgewater: | 3.7% (6,470) |
| State: | 4.4% (91,120) |
Number of households with income $10k - 20k:| East Bridgewater: | 4.0% (6,952) |
| State: | 5.9% (122,055) |
Number of households with income $20k - 30k:| East Bridgewater: | 4.7% (8,165) |
| Massachusetts: | 5.1% (105,311) |
Number of households with income $30k - 40k:| East Bridgewater: | 5.9% (10,222) |
| State: | 5.3% (110,239) |
Number of households with income $40k - 50k:| East Bridgewater: | 4.6% (7,949) |
| State: | 5.0% (104,636) |
Number of households with income $50k - 60k:| East Bridgewater: | 5.0% (8,775) |
| State: | 4.8% (99,486) |
Number of households with income $60k - 75k:| East Bridgewater: | 6.7% (11,673) |
| State: | 7.5% (155,124) |
Number of households with income $75k - 100k:| East Bridgewater: | 11.6% (20,203) |
| Massachusetts: | 11.4% (236,252) |
Number of households with income $100k - 125k:| East Bridgewater: | 10.8% (18,870) |
| State: | 9.9% (204,731) |
Number of households with income $125k - 150k:| East Bridgewater: | 9.3% (16,244) |
| Massachusetts: | 8.5% (175,324) |
Number of households with income $150k - 200k:| East Bridgewater: | 13.0% (22,725) |
| State: | 11.7% (242,980) |
Number of households with income > $200k:| East Bridgewater: | 20.8% (36,232) |
| State: | 20.5% (425,966) |
Aggregate household income in East Bridgewater in 2022: $3,238,685,735
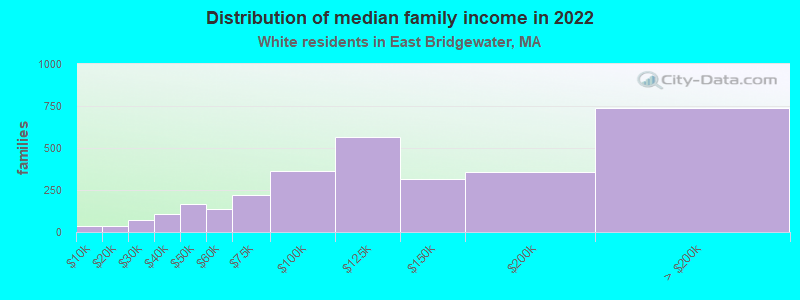
Median family income in East Bridgewater in 2022:| East Bridgewater: | $132,429 |
| Massachusetts: | $133,153 |
Number of families with income < $10k:| East Bridgewater: | 1.2% (37) |
| State: | 2.0% (25,038) |
Number of families with income $10k - 20k:| East Bridgewater: | 1.1% (36) |
| Massachusetts: | 2.1% (26,403) |
Number of families with income $20k - 30k:| East Bridgewater: | 2.4% (74) |
| State: | 2.6% (32,525) |
Number of families with income $30k - 40k:| East Bridgewater: | 3.5% (110) |
| Massachusetts: | 3.9% (48,079) |
Number of families with income $40k - 50k:| East Bridgewater: | 5.3% (165) |
| State: | 3.8% (46,908) |
Number of families with income $50k - 60k:| East Bridgewater: | 4.3% (136) |
| Massachusetts: | 3.8% (46,476) |
Number of families with income $60k - 75k:| East Bridgewater: | 7.1% (223) |
| State: | 6.4% (79,040) |
Number of families with income $75k - 100k:| East Bridgewater: | 11.7% (364) |
| State: | 11.1% (137,395) |
Number of families with income $100k - 125k:| East Bridgewater: | 18.1% (566) |
| State: | 11.1% (136,771) |
Number of families with income $125k - 150k:| East Bridgewater: | 10.2% (318) |
| State: | 10.0% (123,709) |
Number of families with income $150k - 200k:| East Bridgewater: | 11.5% (360) |
| Massachusetts: | 14.7% (181,602) |
Number of families with income > $200k:| East Bridgewater: | 23.6% (736) |
| State: | 28.5% (351,887) |
Median non-family income in East Bridgewater in 2022:| East Bridgewater: | $53,430 |
| Massachusetts: | $59,323 |
Change in median non-family income between 2000 and 2022:| East Bridgewater, Massachusetts: | +86.1% |
| State: | +94.3% |
Median per capita income in East Bridgewater in 2022:| East Bridgewater: | $53,685 |
| Massachusetts: | $60,804 |
Change in median per capita income between 2000 and 2022:| East Bridgewater, Massachusetts: | +127.4% |
| State: | +118.7% |
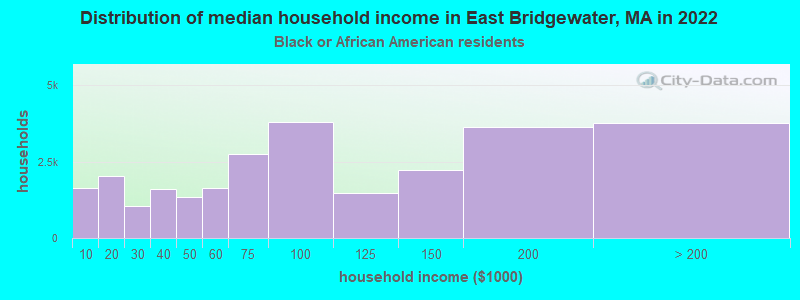
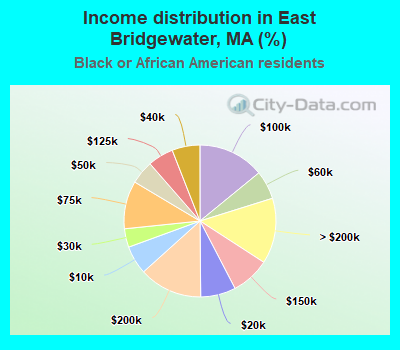
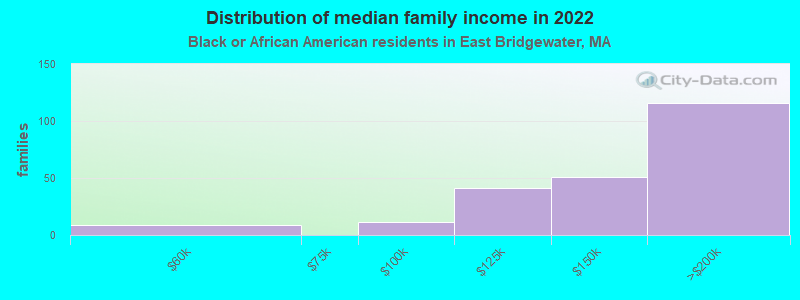
Income statistics for Black or African American residents
Median household income in East Bridgewater, MA in 2022:| East Bridgewater: | $151,970 |
| State: | $63,189 |
Change in median household income between 2000 and 2022:| East Bridgewater, Massachusetts: | +121.0% |
| State: | +87.4% |
Number of households with income < $10k:| East Bridgewater: | 6.1% (1,636) |
| State: | 9.1% (15,797) |
Number of households with income $10k - 20k:| East Bridgewater: | 7.5% (2,015) |
| State: | 9.4% (16,267) |
Number of households with income $20k - 30k:| East Bridgewater: | 3.9% (1,063) |
| State: | 7.8% (13,520) |
Number of households with income $30k - 40k:| East Bridgewater: | 5.9% (1,600) |
| State: | 8.3% (14,412) |
Number of households with income $40k - 50k:| East Bridgewater: | 5.0% (1,352) |
| Massachusetts: | 7.9% (13,790) |
Number of households with income $50k - 60k:| East Bridgewater: | 6.1% (1,634) |
| State: | 5.8% (10,041) |
Number of households with income $60k - 75k:| East Bridgewater: | 10.2% (2,744) |
| State: | 8.5% (14,822) |
Number of households with income $75k - 100k:| East Bridgewater: | 14.1% (3,798) |
| State: | 11.0% (19,122) |
Number of households with income $100k - 125k:| East Bridgewater: | 5.5% (1,474) |
| State: | 8.4% (14,575) |
Number of households with income $125k - 150k:| East Bridgewater: | 8.2% (2,214) |
| State: | 6.0% (10,429) |
Number of households with income $150k - 200k:| East Bridgewater: | 13.5% (3,631) |
| Massachusetts: | 7.2% (12,539) |
Number of households with income > $200k:| East Bridgewater: | 14.0% (3,765) |
| State: | 10.5% (18,185) |
Aggregate household income in East Bridgewater in 2022: $19,204,922
Median family income in East Bridgewater in 2022:| East Bridgewater: | $292,781 |
| State: | $79,815 |
Number of families with income $50k - 60k:| East Bridgewater: | 4.1% (9) |
| State: | 6.4% (6,986) |
Number of families with income $75k - 100k:| East Bridgewater: | 5.0% (11) |
| Massachusetts: | 11.5% (12,654) |
Number of families with income $100k - 125k:| East Bridgewater: | 18.1% (41) |
| Massachusetts: | 10.4% (11,452) |
Number of families with income $125k - 150k:| East Bridgewater: | 22.3% (51) |
| State: | 7.5% (8,277) |
Number of families with income $150k - 200k:| East Bridgewater: | 50.5% (116) |
| State: | 9.3% (10,230) |
Median non-family income in East Bridgewater in 2022:| East Bridgewater: | $12,436 |
| Massachusetts: | $38,934 |
Change in median non-family income between 2000 and 2022:| East Bridgewater, Massachusetts: | +107.3% |
| Massachusetts: | +69.2% |
Median per capita income in East Bridgewater in 2022:| East Bridgewater: | $53,447 |
| Massachusetts: | $33,524 |
Change in median per capita income between 2000 and 2022:| East Bridgewater, Massachusetts: | +127.3% |
| State: | +109.4% |
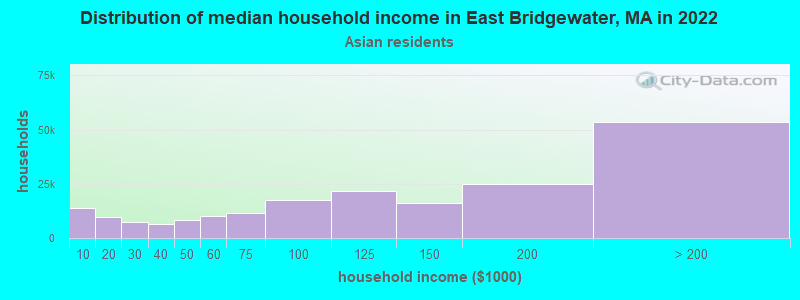
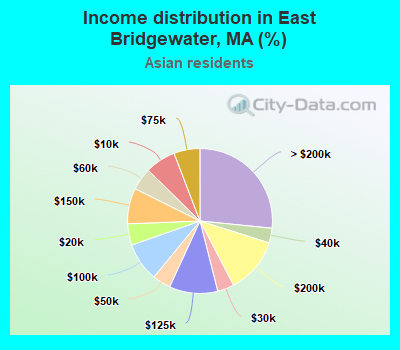
Income statistics for Asian residents
Median household income in East Bridgewater, MA in 2022:| East Bridgewater: | $92,780 |
| Massachusetts: | $117,855 |
Change in median household income between 2000 and 2022:| East Bridgewater, Massachusetts: | +57.9% |
| State: | +129.9% |
Number of households with income < $10k:| East Bridgewater: | 6.8% (13,729) |
| State: | 6.8% (11,982) |
Number of households with income $10k - 20k:| East Bridgewater: | 4.8% (9,597) |
| State: | 4.8% (8,376) |
Number of households with income $20k - 30k:| East Bridgewater: | 3.7% (7,514) |
| State: | 3.7% (6,558) |
Number of households with income $30k - 40k:| East Bridgewater: | 3.3% (6,586) |
| Massachusetts: | 3.3% (5,748) |
Number of households with income $40k - 50k:| East Bridgewater: | 4.1% (8,241) |
| State: | 4.1% (7,192) |
Number of households with income $50k - 60k:| East Bridgewater: | 5.0% (10,008) |
| State: | 5.0% (8,734) |
Number of households with income $60k - 75k:| East Bridgewater: | 5.8% (11,691) |
| Massachusetts: | 5.8% (10,203) |
Number of households with income $75k - 100k:| East Bridgewater: | 8.6% (17,364) |
| State: | 8.6% (15,154) |
Number of households with income $100k - 125k:| East Bridgewater: | 10.8% (21,704) |
| Massachusetts: | 10.8% (18,942) |
Number of households with income $125k - 150k:| East Bridgewater: | 8.0% (16,084) |
| State: | 8.0% (14,037) |
Number of households with income $150k - 200k:| East Bridgewater: | 12.5% (25,043) |
| Massachusetts: | 12.5% (21,856) |
Number of households with income > $200k:| East Bridgewater: | 26.6% (53,503) |
| Massachusetts: | 26.6% (46,694) |
Aggregate household income in East Bridgewater in 2022: $1,145,907
Median family income in East Bridgewater in 2022:| East Bridgewater: | $91,994 |
| State: | $140,113 |
Median per capita income in East Bridgewater in 2022:| East Bridgewater: | $24,880 |
| Massachusetts: | $58,900 |
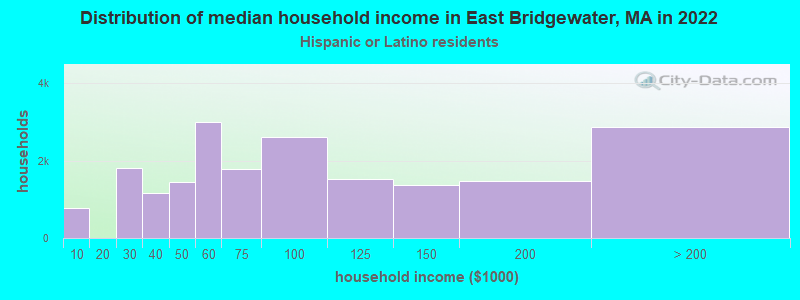
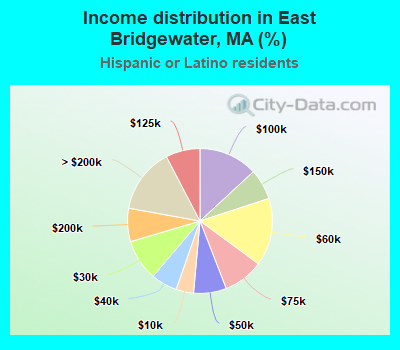
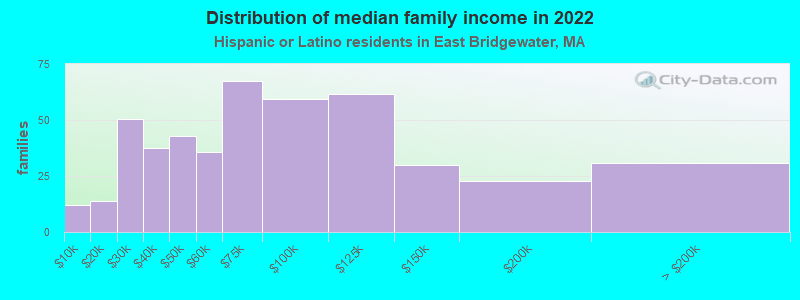
Income statistics for Hispanic or Latino residents
Median household income in East Bridgewater, MA in 2022:| East Bridgewater: | $214,348 |
| State: | $61,523 |
Change in median household income between 2000 and 2022:| East Bridgewater, Massachusetts: | +113.0% |
| State: | +125.4% |
Number of households with income < $10k:| East Bridgewater: | 3.9% (775) |
| State: | 8.8% (25,307) |
Number of households with income $10k - 20k:| East Bridgewater: | 0.0% (0) |
| Massachusetts: | 10.0% (28,653) |
Number of households with income $20k - 30k:| East Bridgewater: | 9.2% (1,819) |
| State: | 8.8% (25,189) |
Number of households with income $30k - 40k:| East Bridgewater: | 5.9% (1,163) |
| State: | 7.2% (20,822) |
Number of households with income $40k - 50k:| East Bridgewater: | 7.3% (1,451) |
| Massachusetts: | 7.2% (20,817) |
Number of households with income $50k - 60k:| East Bridgewater: | 15.1% (2,995) |
| State: | 6.5% (18,748) |
Number of households with income $60k - 75k:| East Bridgewater: | 9.0% (1,785) |
| Massachusetts: | 8.8% (25,390) |
Number of households with income $75k - 100k:| East Bridgewater: | 13.1% (2,603) |
| State: | 12.0% (34,488) |
Number of households with income $100k - 125k:| East Bridgewater: | 7.6% (1,515) |
| State: | 8.6% (24,599) |
Number of households with income $125k - 150k:| East Bridgewater: | 6.9% (1,358) |
| State: | 6.2% (17,743) |
Number of households with income $150k - 200k:| East Bridgewater: | 7.4% (1,474) |
| State: | 7.3% (21,017) |
Number of households with income > $200k:| East Bridgewater: | 14.5% (2,876) |
| State: | 8.6% (24,606) |
Aggregate household income in East Bridgewater in 2022: $9,498,569
Median family income in East Bridgewater in 2022:| East Bridgewater: | $215,734 |
| Massachusetts: | $66,072 |
Number of families with income < $10k:| East Bridgewater: | 2.6% (12) |
| Massachusetts: | 6.2% (12,456) |
Number of families with income $10k - 20k:| East Bridgewater: | 2.9% (14) |
| State: | 6.0% (12,071) |
Number of families with income $20k - 30k:| East Bridgewater: | 10.8% (50) |
| Massachusetts: | 10.1% (20,376) |
Number of families with income $30k - 40k:| East Bridgewater: | 8.1% (38) |
| Massachusetts: | 8.2% (16,470) |
Number of families with income $40k - 50k:| East Bridgewater: | 9.3% (43) |
| State: | 7.4% (14,829) |
Number of families with income $50k - 60k:| East Bridgewater: | 7.7% (36) |
| State: | 7.3% (14,643) |
Number of families with income $60k - 75k:| East Bridgewater: | 14.5% (68) |
| State: | 10.6% (21,252) |
Number of families with income $75k - 100k:| East Bridgewater: | 12.8% (60) |
| State: | 12.0% (24,088) |
Number of families with income $100k - 125k:| East Bridgewater: | 13.3% (62) |
| Massachusetts: | 8.9% (17,954) |
Number of families with income $125k - 150k:| East Bridgewater: | 6.4% (30) |
| Massachusetts: | 6.9% (13,837) |
Number of families with income $150k - 200k:| East Bridgewater: | 4.9% (23) |
| State: | 7.3% (14,683) |
Number of families with income > $200k:| East Bridgewater: | 6.6% (31) |
| State: | 9.3% (18,741) |
Median non-family income in East Bridgewater in 2022:| East Bridgewater: | $155,210 |
| Massachusetts: | $37,563 |
Median per capita income in East Bridgewater in 2022:| East Bridgewater: | $57,290 |
| Massachusetts: | $28,993 |
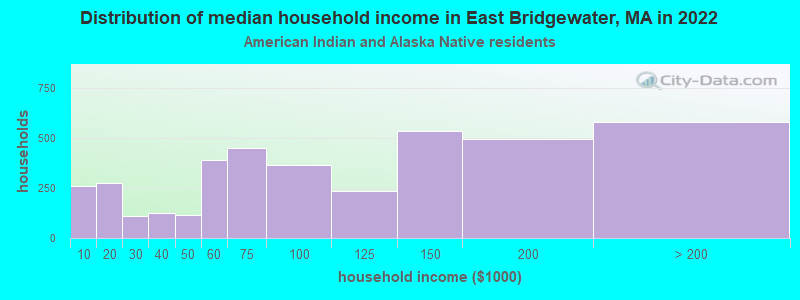
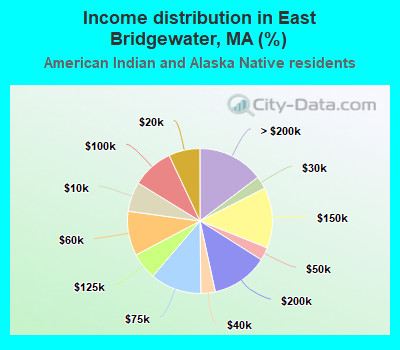
Income statistics for American Indian and Alaska Native residents
Median household income in East Bridgewater, MA in 2022:| East Bridgewater: | $88,396 |
| State: | $87,730 |
Number of households with income < $10k:| East Bridgewater: | 6.6% (260) |
| State: | 6.6% (451) |
Number of households with income $10k - 20k:| East Bridgewater: | 7.0% (275) |
| State: | 7.0% (476) |
Number of households with income $20k - 30k:| East Bridgewater: | 2.8% (111) |
| Massachusetts: | 2.8% (192) |
Number of households with income $30k - 40k:| East Bridgewater: | 3.2% (126) |
| State: | 3.2% (218) |
Number of households with income $40k - 50k:| East Bridgewater: | 2.9% (115) |
| State: | 2.9% (199) |
Number of households with income $50k - 60k:| East Bridgewater: | 9.9% (391) |
| State: | 9.9% (677) |
Number of households with income $60k - 75k:| East Bridgewater: | 11.5% (451) |
| Massachusetts: | 11.5% (781) |
Number of households with income $75k - 100k:| East Bridgewater: | 9.2% (363) |
| Massachusetts: | 9.2% (629) |
Number of households with income $100k - 125k:| East Bridgewater: | 5.9% (234) |
| State: | 6.0% (406) |
Number of households with income $125k - 150k:| East Bridgewater: | 13.5% (532) |
| Massachusetts: | 13.5% (921) |
Number of households with income $150k - 200k:| East Bridgewater: | 12.6% (496) |
| State: | 12.6% (859) |
Number of households with income > $200k:| East Bridgewater: | 14.7% (579) |
| Massachusetts: | 14.7% (1,003) |
Aggregate household income in East Bridgewater in 2022: $502,758
Median family income in East Bridgewater in 2022:| East Bridgewater: | $73,041 |
| State: | $105,715 |
Median per capita income in East Bridgewater in 2022:| East Bridgewater: | $29,115 |
| State: | $39,434 |
Change in median per capita income between 2000 and 2022:| East Bridgewater, Massachusetts: | +130.6% |
| Massachusetts: | +148.2% |
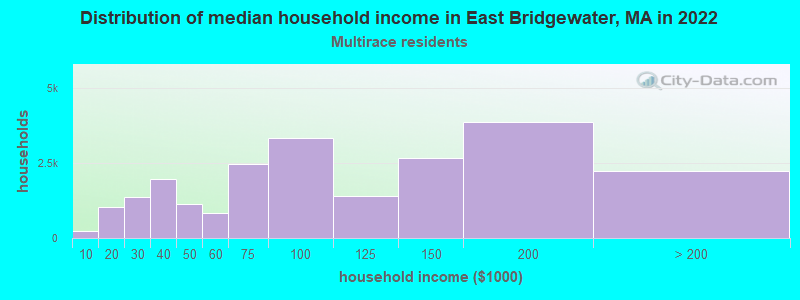
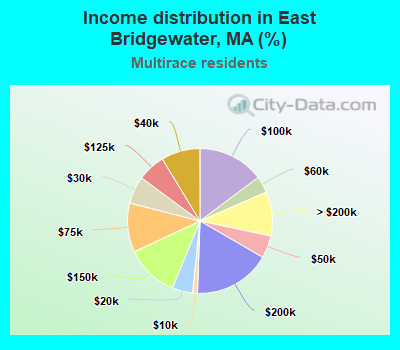
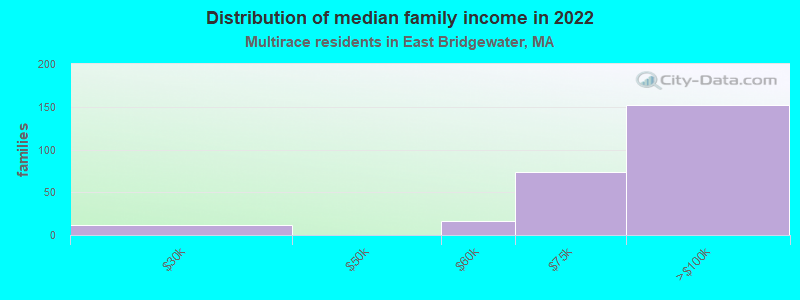
Income statistics for Multirace residents
Median household income in East Bridgewater, MA in 2022:| East Bridgewater: | $145,683 |
| State: | $71,552 |
Change in median household income between 2000 and 2022:| East Bridgewater, Massachusetts: | +105.5% |
| Massachusetts: | +109.0% |
Number of households with income < $10k:| East Bridgewater: | 1.1% (242) |
| State: | 6.6% (15,127) |
Number of households with income $10k - 20k:| East Bridgewater: | 4.6% (1,035) |
| State: | 9.2% (21,158) |
Number of households with income $20k - 30k:| East Bridgewater: | 6.1% (1,381) |
| Massachusetts: | 7.8% (18,016) |
Number of households with income $30k - 40k:| East Bridgewater: | 8.7% (1,952) |
| Massachusetts: | 7.9% (18,260) |
Number of households with income $40k - 50k:| East Bridgewater: | 5.1% (1,139) |
| State: | 5.6% (13,027) |
Number of households with income $50k - 60k:| East Bridgewater: | 3.7% (827) |
| State: | 5.6% (12,909) |
Number of households with income $60k - 75k:| East Bridgewater: | 10.9% (2,462) |
| Massachusetts: | 9.0% (20,800) |
Number of households with income $75k - 100k:| East Bridgewater: | 14.8% (3,328) |
| Massachusetts: | 12.1% (27,875) |
Number of households with income $100k - 125k:| East Bridgewater: | 6.2% (1,395) |
| State: | 8.1% (18,754) |
Number of households with income $125k - 150k:| East Bridgewater: | 11.8% (2,660) |
| State: | 6.8% (15,621) |
Number of households with income $150k - 200k:| East Bridgewater: | 17.2% (3,868) |
| State: | 9.4% (21,618) |
Number of households with income > $200k:| East Bridgewater: | 9.9% (2,219) |
| State: | 12.0% (27,592) |
Aggregate household income in East Bridgewater in 2022: $57,722,406
Median family income in East Bridgewater in 2022:| East Bridgewater: | $137,115 |
| State: | $78,380 |
Number of families with income $20k - 30k:| East Bridgewater: | 4.7% (12) |
| State: | 8.5% (13,245) |
Number of families with income $50k - 60k:| East Bridgewater: | 6.5% (16) |
| State: | 6.7% (10,445) |
Number of families with income $60k - 75k:| East Bridgewater: | 29.1% (74) |
| State: | 10.3% (16,064) |
Number of families with income $75k - 100k:| East Bridgewater: | 59.7% (152) |
| Massachusetts: | 12.1% (18,758) |
Median non-family income in East Bridgewater in 2022:| East Bridgewater: | $93,016 |
| State: | $42,253 |
Change in median non-family income between 2000 and 2022:| East Bridgewater, Massachusetts: | +101.1% |
| State: | +93.7% |
Median per capita income in East Bridgewater in 2022:| East Bridgewater: | $54,928 |
| State: | $34,029 |
Change in median per capita income between 2000 and 2022:| East Bridgewater, Massachusetts: | +132.9% |
| State: | +132.1% |
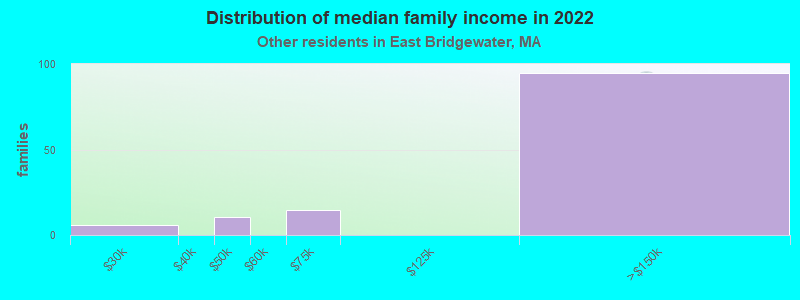
Income statistics for other residents
Number of households with income < $10k:| East Bridgewater: | 8.3% (11) |
| State: | 8.4% (11,559) |
Number of households with income $10k - 20k:| East Bridgewater: | 8.3% (11) |
| State: | 8.4% (11,499) |
Number of households with income $20k - 30k:| East Bridgewater: | 9.0% (12) |
| Massachusetts: | 9.5% (13,070) |
Number of households with income $30k - 40k:| East Bridgewater: | 6.0% (8) |
| Massachusetts: | 6.0% (8,291) |
Number of households with income $40k - 50k:| East Bridgewater: | 9.0% (12) |
| State: | 9.2% (12,611) |
Number of households with income $50k - 60k:| East Bridgewater: | 8.3% (11) |
| State: | 7.9% (10,879) |
Number of households with income $60k - 75k:| East Bridgewater: | 7.5% (10) |
| State: | 7.5% (10,239) |
Number of households with income $75k - 100k:| East Bridgewater: | 12.8% (17) |
| Massachusetts: | 13.1% (18,032) |
Number of households with income $100k - 125k:| East Bridgewater: | 9.8% (13) |
| State: | 9.6% (13,141) |
Number of households with income $125k - 150k:| East Bridgewater: | 5.3% (7) |
| Massachusetts: | 5.0% (6,808) |
Number of households with income $150k - 200k:| East Bridgewater: | 6.8% (9) |
| Massachusetts: | 6.4% (8,843) |
Number of households with income > $200k:| East Bridgewater: | 9.0% (12) |
| State: | 9.0% (12,396) |
Aggregate household income in East Bridgewater in 2022: $11,666,332
Median family income in East Bridgewater in 2022:| East Bridgewater: | $111,475 |
| State: | $66,840 |
Number of families with income $20k - 30k:| East Bridgewater: | 4.7% (6) |
| State: | 10.4% (10,595) |
Number of families with income $40k - 50k:| East Bridgewater: | 8.6% (11) |
| State: | 8.9% (9,052) |
Number of families with income $60k - 75k:| East Bridgewater: | 11.4% (14) |
| Massachusetts: | 8.5% (8,683) |
Number of families with income $125k - 150k:| East Bridgewater: | 75.4% (95) |
| Massachusetts: | 5.3% (5,373) |
Median per capita income in East Bridgewater in 2022:| East Bridgewater: | $79,826 |
| Massachusetts: | $30,797 |