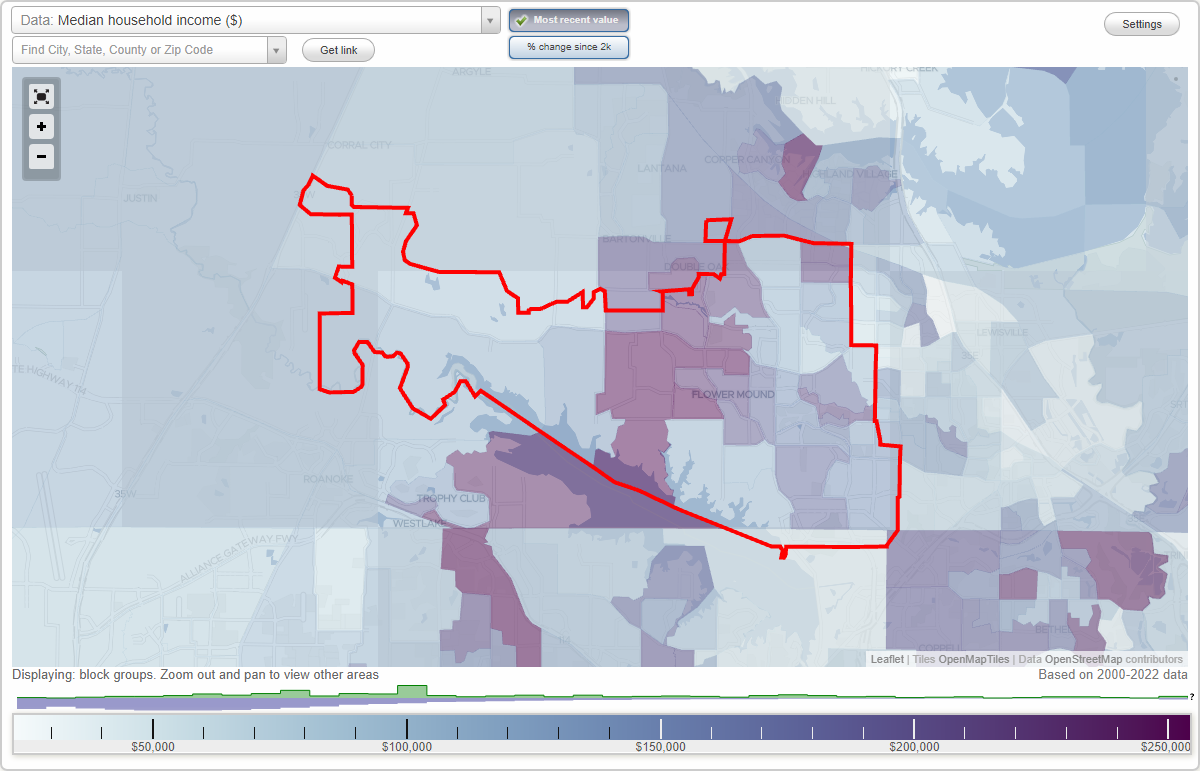
The median household income in Flower Mound, TX in 2022 was $144,901, which was 50.1% greater than the median annual income of $72,284 across the entire state of Texas. Compared to the median income of $95,416 in 2000 this represents an increase of 34.2%. The per capita income in 2022 was $69,029, which means an increase of 49.7% compared to 2000 when it was $34,699.
Whole page based on the data from 2000 / 2022 when the population of Flower Mound, Texas was 50,702 / 77,947
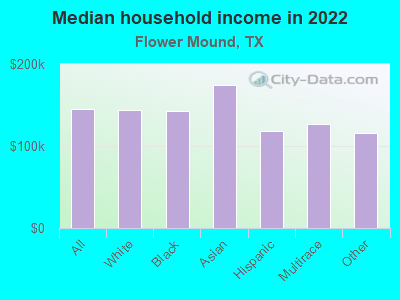
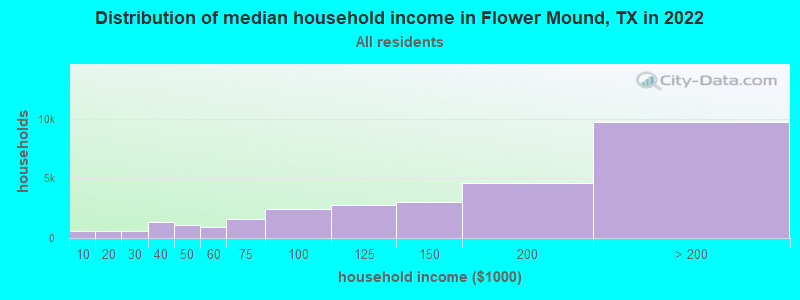
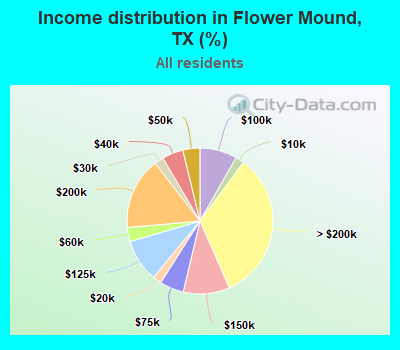
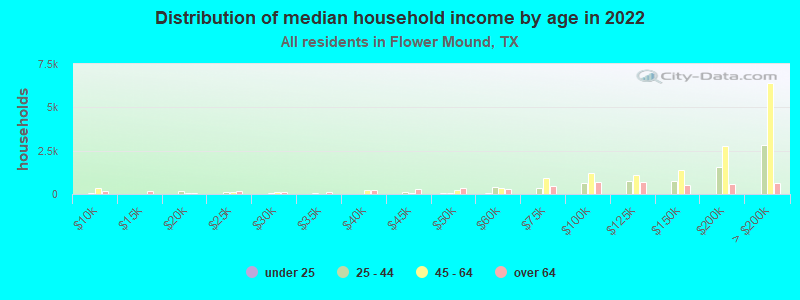
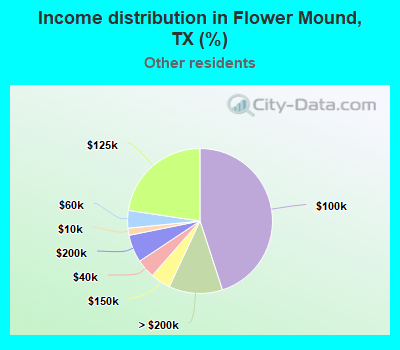
Income statistics for all residents
Median household income in Flower Mound, TX in 2022:
Flower Mound:
$144,901
Texas:
$72,284
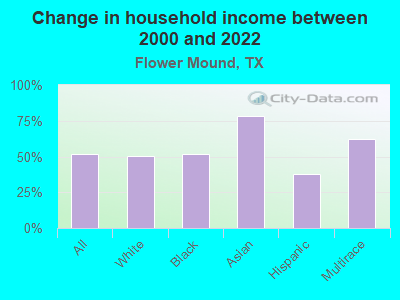
Change in median household income between 2000 and 2022:
Flower Mound, Texas:
+51.9%
Texas:
+81.0%
Number of households with income < $10k:
Flower Mound:
1.9% (549)
State:
5.5% (611,011)
Number of households with income $10k - 20k:
Flower Mound:
1.9% (569)
State:
6.7% (743,157)
Number of households with income $20k - 30k:
Flower Mound:
2.0% (599)
Texas:
7.2% (803,381)
Number of households with income $30k - 40k:
Flower Mound:
4.7% (1,369)
Texas:
7.8% (866,080)
Number of households with income $40k - 50k:
Flower Mound:
3.8% (1,107)
State:
7.3% (810,440)
Number of households with income $50k - 60k:
Flower Mound:
3.1% (917)
State:
7.2% (799,783)
Number of households with income $60k - 75k:
Flower Mound:
5.3% (1,561)
State:
9.9% (1,095,384)
Number of households with income $75k - 100k:
Flower Mound:
8.3% (2,416)
Texas:
12.8% (1,419,057)
Number of households with income $100k - 125k:
Flower Mound:
9.4% (2,763)
State:
9.5% (1,054,577)
Number of households with income $125k - 150k:
Flower Mound:
10.3% (3,009)
State:
6.7% (741,518)
Number of households with income $150k - 200k:
Flower Mound:
15.9% (4,657)
State:
8.7% (961,776)
Number of households with income > $200k:
Flower Mound:
33.3% (9,738)
State:
10.7% (1,181,544)
Aggregate household income in Flower Mound in 2022: $5,302,502,100
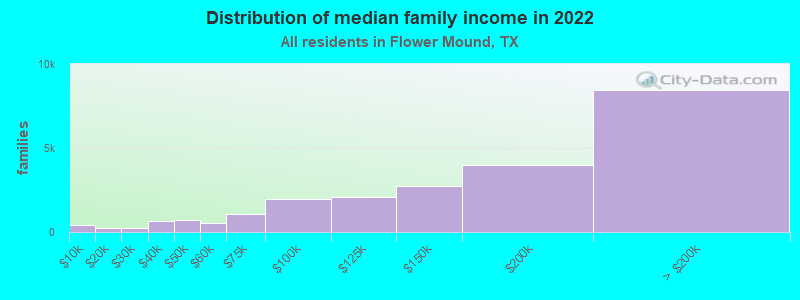
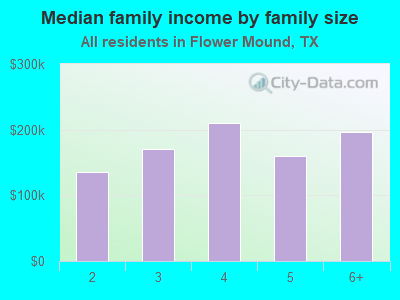
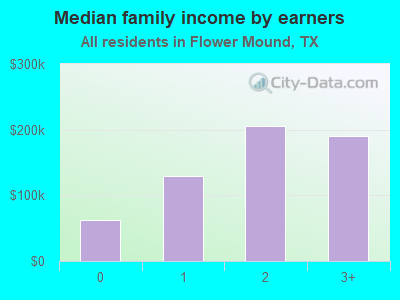
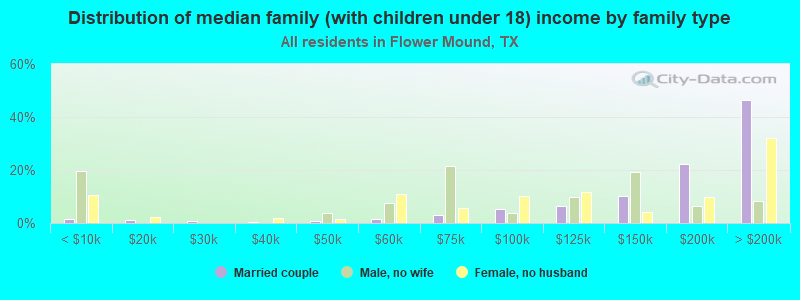
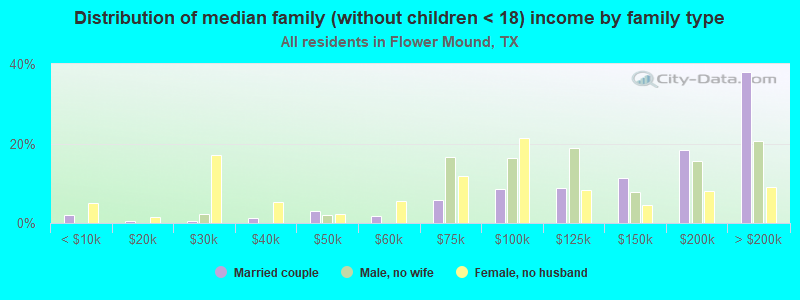
Median family income in Flower Mound in 2022:
Flower Mound:
$160,385
Texas:
$86,267
Number of families with income < $10k:
Flower Mound:
1.8% (405)
State:
4.0% (297,884)
Number of families with income $10k - 20k:
Flower Mound:
0.9% (213)
State:
4.3% (324,514)
Number of families with income $20k - 30k:
Flower Mound:
1.0% (222)
Texas:
5.8% (430,949)
Number of families with income $30k - 40k:
Flower Mound:
2.8% (641)
State:
6.6% (493,535)
Number of families with income $40k - 50k:
Flower Mound:
3.1% (711)
State:
6.7% (499,663)
Number of families with income $50k - 60k:
Flower Mound:
2.2% (518)
State:
6.6% (492,203)
Number of families with income $60k - 75k:
Flower Mound:
4.7% (1,091)
State:
9.5% (710,229)
Number of families with income $75k - 100k:
Flower Mound:
8.6% (1,978)
State:
13.6% (1,015,480)
Number of families with income $100k - 125k:
Flower Mound:
9.0% (2,082)
State:
10.7% (797,961)
Number of families with income $125k - 150k:
Flower Mound:
11.9% (2,738)
State:
8.1% (602,985)
Number of families with income $150k - 200k:
Flower Mound:
17.4% (4,000)
State:
10.7% (804,459)
Number of families with income > $200k:
Flower Mound:
36.7% (8,447)
State:
13.5% (1,013,514)
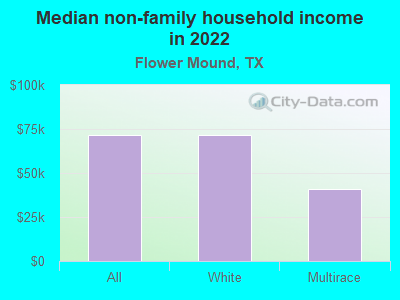
Median non-family income in Flower Mound in 2022:
Flower Mound:
$71,421
Texas:
$45,999
Change in median non-family income between 2000 and 2022:
Flower Mound, Texas:
+20.8%
State:
+79.5%
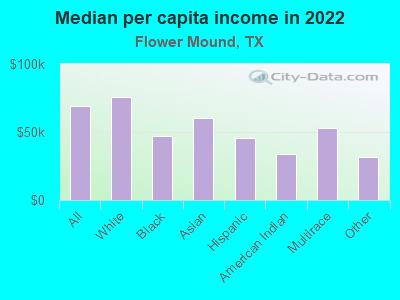
Median per capita income in Flower Mound in 2022:
Flower Mound:
$69,029
State:
$38,123
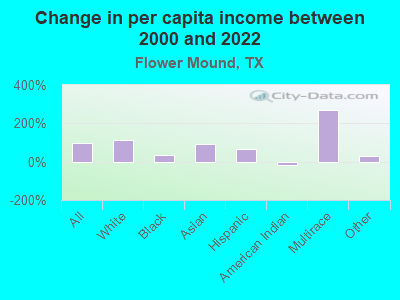
Change in median per capita income between 2000 and 2022:
Flower Mound, Texas:
+98.9%
State:
+94.3%
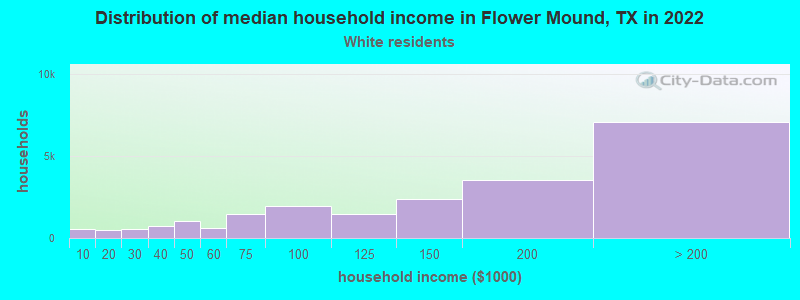
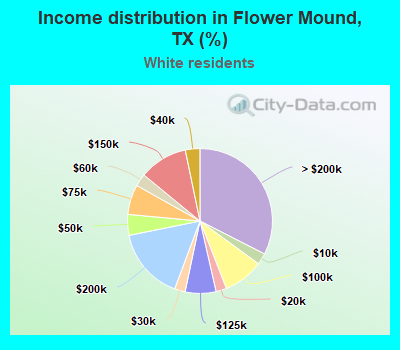
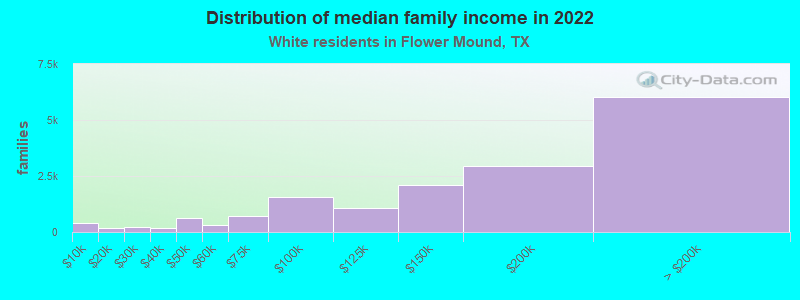
Income statistics for White residents
Median household income in Flower Mound, TX in 2022:
Flower Mound:
$144,251
State:
$82,032
Change in median household income between 2000 and 2022:
Flower Mound, Texas:
+50.4%
State:
+91.0%
Number of households with income < $10k:
Flower Mound:
2.5% (549)
Texas:
4.7% (273,716)
Number of households with income $10k - 20k:
Flower Mound:
2.4% (515)
State:
5.5% (322,702)
Number of households with income $20k - 30k:
Flower Mound:
2.4% (520)
Texas:
6.2% (363,947)
Number of households with income $30k - 40k:
Flower Mound:
3.3% (709)
State:
6.8% (399,275)
Number of households with income $40k - 50k:
Flower Mound:
4.6% (1,010)
Texas:
6.5% (383,417)
Number of households with income $50k - 60k:
Flower Mound:
2.8% (608)
State:
6.6% (388,535)
Number of households with income $60k - 75k:
Flower Mound:
6.7% (1,456)
State:
9.7% (566,295)
Number of households with income $75k - 100k:
Flower Mound:
9.0% (1,966)
State:
13.0% (760,276)
Number of households with income $100k - 125k:
Flower Mound:
6.9% (1,495)
State:
10.2% (597,596)
Number of households with income $125k - 150k:
Flower Mound:
10.8% (2,354)
State:
7.4% (436,830)
Number of households with income $150k - 200k:
Flower Mound:
16.1% (3,514)
State:
9.9% (583,067)
Number of households with income > $200k:
Flower Mound:
32.5% (7,087)
State:
13.5% (792,647)
Aggregate household income in Flower Mound in 2022: $3,929,458,800
Median family income in Flower Mound in 2022:
Flower Mound:
$161,403
State:
$101,788
Number of families with income < $10k:
Flower Mound:
2.5% (405)
State:
2.8% (108,142)
Number of families with income $10k - 20k:
Flower Mound:
1.0% (159)
State:
2.9% (113,421)
Number of families with income $20k - 30k:
Flower Mound:
1.4% (222)
State:
4.1% (157,688)
Number of families with income $30k - 40k:
Flower Mound:
1.2% (189)
State:
5.2% (198,847)
Number of families with income $40k - 50k:
Flower Mound:
3.8% (614)
Texas:
5.6% (216,490)
Number of families with income $50k - 60k:
Flower Mound:
1.8% (295)
State:
5.7% (220,689)
Number of families with income $60k - 75k:
Flower Mound:
4.5% (726)
Texas:
9.0% (346,106)
Number of families with income $75k - 100k:
Flower Mound:
9.6% (1,559)
State:
13.7% (527,363)
Number of families with income $100k - 125k:
Flower Mound:
6.7% (1,089)
Texas:
11.6% (448,411)
Number of families with income $125k - 150k:
Flower Mound:
12.9% (2,103)
State:
9.2% (355,798)
Number of families with income $150k - 200k:
Flower Mound:
18.0% (2,943)
State:
12.5% (480,185)
Number of families with income > $200k:
Flower Mound:
36.8% (6,007)
State:
17.6% (677,490)
Median non-family income in Flower Mound in 2022:
Flower Mound:
$71,553
Texas:
$50,587
Change in median non-family income between 2000 and 2022:
Flower Mound, Texas:
+21.5%
State:
+87.7%
Median per capita income in Flower Mound in 2022:
Flower Mound:
$76,063
State:
$47,740
Change in median per capita income between 2000 and 2022:
Flower Mound, Texas:
+114.6%
State:
+114.3%
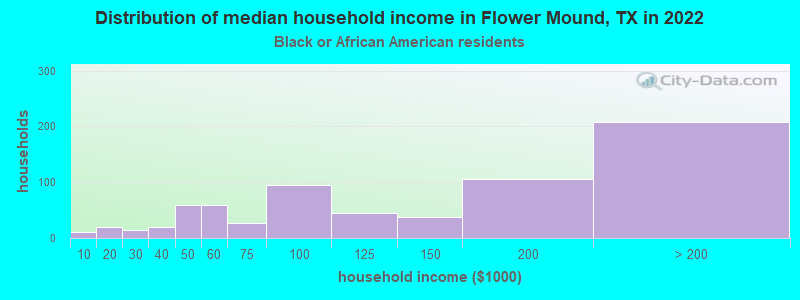
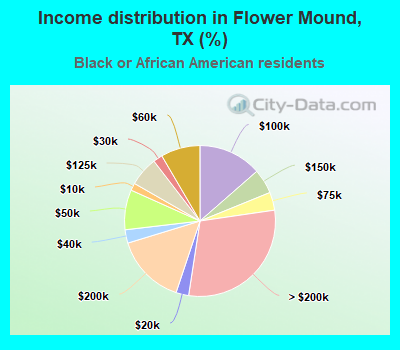
Income statistics for Black or African American residents
Median household income in Flower Mound, TX in 2022:
Flower Mound:
$142,489
Texas:
$55,759
Change in median household income between 2000 and 2022:
Flower Mound, Texas:
+52.0%
Texas:
+90.3%
Number of households with income < $10k:
Flower Mound:
1.6% (11)
State:
8.9% (126,378)
Number of households with income $10k - 20k:
Flower Mound:
2.7% (19)
State:
9.9% (140,369)
Number of households with income $20k - 30k:
Flower Mound:
2.0% (14)
State:
8.5% (120,639)
Number of households with income $30k - 40k:
Flower Mound:
2.9% (20)
State:
9.7% (137,517)
Number of households with income $40k - 50k:
Flower Mound:
8.6% (60)
State:
8.0% (112,973)
Number of households with income $50k - 60k:
Flower Mound:
8.4% (59)
State:
8.3% (117,156)
Number of households with income $60k - 75k:
Flower Mound:
3.9% (27)
State:
10.4% (147,462)
Number of households with income $75k - 100k:
Flower Mound:
13.6% (95)
Texas:
11.5% (162,718)
Number of households with income $100k - 125k:
Flower Mound:
6.3% (44)
State:
8.2% (115,829)
Number of households with income $125k - 150k:
Flower Mound:
5.3% (37)
Texas:
4.9% (69,556)
Number of households with income $150k - 200k:
Flower Mound:
15.1% (106)
State:
6.4% (90,701)
Number of households with income > $200k:
Flower Mound:
29.7% (208)
State:
5.5% (77,988)
Aggregate household income in Flower Mound in 2022: $126,949,700
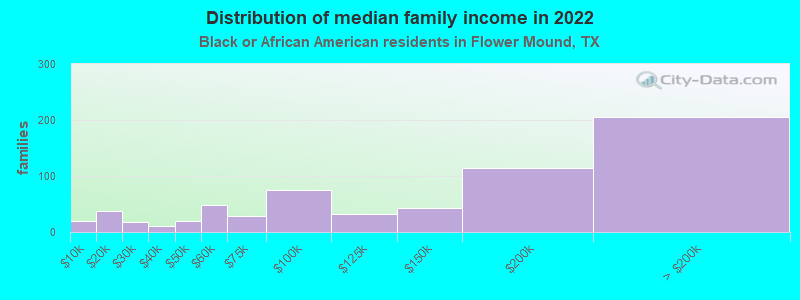
Median family income in Flower Mound in 2022:
Flower Mound:
$142,069
State:
$69,134
Number of families with income < $10k:
Flower Mound:
2.9% (19)
State:
6.8% (55,625)
Number of families with income $10k - 20k:
Flower Mound:
5.7% (37)
Texas:
6.8% (55,300)
Number of families with income $20k - 30k:
Flower Mound:
2.6% (17)
State:
7.1% (57,877)
Number of families with income $30k - 40k:
Flower Mound:
1.7% (11)
State:
8.5% (68,776)
Number of families with income $40k - 50k:
Flower Mound:
3.0% (19)
Texas:
7.1% (57,907)
Number of families with income $50k - 60k:
Flower Mound:
7.4% (48)
State:
7.3% (59,511)
Number of families with income $60k - 75k:
Flower Mound:
4.4% (28)
Texas:
10.1% (81,994)
Number of families with income $75k - 100k:
Flower Mound:
11.6% (75)
Texas:
12.7% (103,723)
Number of families with income $100k - 125k:
Flower Mound:
5.1% (33)
State:
9.4% (76,609)
Number of families with income $125k - 150k:
Flower Mound:
6.5% (42)
State:
6.8% (55,615)
Number of families with income $150k - 200k:
Flower Mound:
17.6% (114)
State:
9.4% (76,146)
Number of families with income > $200k:
Flower Mound:
31.6% (205)
State:
7.9% (64,439)
Median per capita income in Flower Mound in 2022:
Flower Mound:
$47,157
State:
$30,490
Change in median per capita income between 2000 and 2022:
Flower Mound, Texas:
+36.5%
Texas:
+113.9%
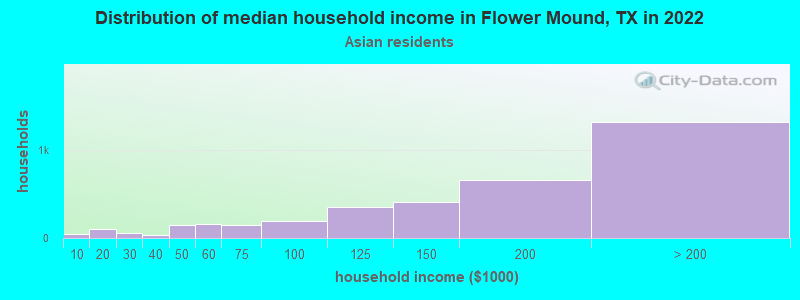
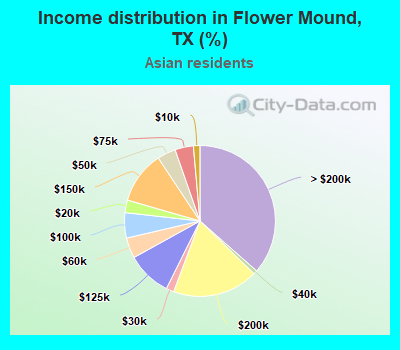
Income statistics for Asian residents
Median household income in Flower Mound, TX in 2022:
Flower Mound:
$174,741
State:
$107,673
Change in median household income between 2000 and 2022:
Flower Mound, Texas:
+78.4%
State:
+115.1%
Number of households with income < $10k:
Flower Mound:
1.4% (50)
Texas:
5.2% (29,885)
Number of households with income $10k - 20k:
Flower Mound:
2.7% (97)
State:
4.7% (27,044)
Number of households with income $20k - 30k:
Flower Mound:
1.7% (60)
Texas:
4.1% (23,363)
Number of households with income $30k - 40k:
Flower Mound:
0.8% (29)
Texas:
4.1% (23,309)
Number of households with income $40k - 50k:
Flower Mound:
4.0% (143)
Texas:
5.2% (29,826)
Number of households with income $50k - 60k:
Flower Mound:
4.4% (159)
State:
4.7% (26,512)
Number of households with income $60k - 75k:
Flower Mound:
4.0% (143)
State:
6.5% (36,905)
Number of households with income $75k - 100k:
Flower Mound:
5.4% (196)
Texas:
11.3% (64,350)
Number of households with income $100k - 125k:
Flower Mound:
9.6% (347)
State:
11.4% (64,714)
Number of households with income $125k - 150k:
Flower Mound:
11.2% (405)
State:
9.3% (52,719)
Number of households with income $150k - 200k:
Flower Mound:
18.4% (664)
Texas:
12.5% (70,953)
Number of households with income > $200k:
Flower Mound:
36.5% (1,318)
State:
21.1% (120,260)
Aggregate household income in Flower Mound in 2022: $736,612,100
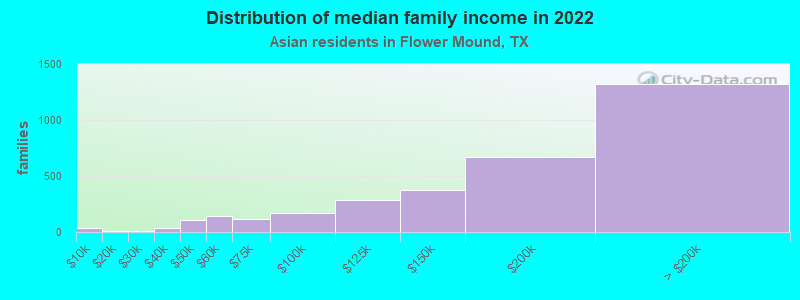
Median family income in Flower Mound in 2022:
Flower Mound:
$180,722
State:
$123,328
Number of families with income < $10k:
Flower Mound:
1.2% (40)
State:
3.1% (13,567)
Number of families with income $10k - 20k:
Flower Mound:
0.4% (12)
State:
3.0% (13,043)
Number of families with income $20k - 30k:
Flower Mound:
0.4% (13)
State:
3.4% (14,738)
Number of families with income $30k - 40k:
Flower Mound:
1.0% (34)
State:
3.4% (15,033)
Number of families with income $40k - 50k:
Flower Mound:
3.1% (103)
State:
4.9% (21,622)
Number of families with income $50k - 60k:
Flower Mound:
4.3% (142)
State:
4.7% (20,568)
Number of families with income $60k - 75k:
Flower Mound:
3.4% (113)
Texas:
6.1% (26,637)
Number of families with income $75k - 100k:
Flower Mound:
5.3% (173)
Texas:
10.7% (46,626)
Number of families with income $100k - 125k:
Flower Mound:
8.7% (286)
State:
11.3% (49,585)
Number of families with income $125k - 150k:
Flower Mound:
11.5% (378)
State:
9.8% (43,043)
Number of families with income $150k - 200k:
Flower Mound:
20.3% (669)
State:
14.7% (64,203)
Number of families with income > $200k:
Flower Mound:
40.3% (1,324)
State:
24.8% (108,511)
Median per capita income in Flower Mound in 2022:
Flower Mound:
$60,249
State:
$48,626
Change in median per capita income between 2000 and 2022:
Flower Mound, Texas:
+94.4%
State:
+132.0%
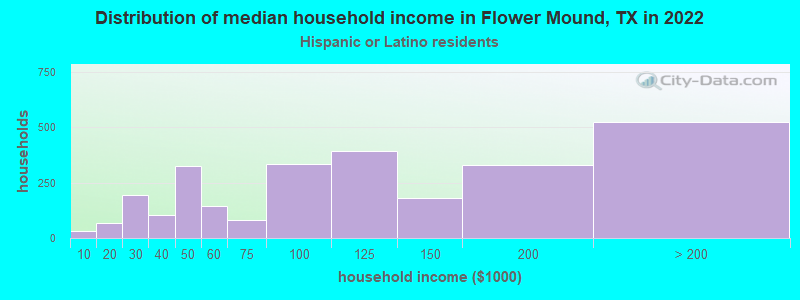
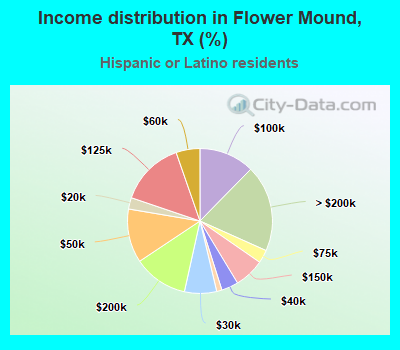
Income statistics for Hispanic or Latino residents
Median household income in Flower Mound, TX in 2022:
Flower Mound:
$118,519
State:
$60,504
Change in median household income between 2000 and 2022:
Flower Mound, Texas:
+37.5%
State:
+102.5%
Number of households with income < $10k:
Flower Mound:
1.2% (32)
State:
5.8% (213,953)
Number of households with income $10k - 20k:
Flower Mound:
2.6% (69)
State:
8.0% (297,456)
Number of households with income $20k - 30k:
Flower Mound:
7.2% (194)
State:
9.2% (340,166)
Number of households with income $30k - 40k:
Flower Mound:
3.8% (102)
State:
9.5% (354,336)
Number of households with income $40k - 50k:
Flower Mound:
12.0% (325)
State:
8.8% (327,013)
Number of households with income $50k - 60k:
Flower Mound:
5.3% (144)
State:
8.3% (308,818)
Number of households with income $60k - 75k:
Flower Mound:
3.0% (80)
Texas:
10.9% (405,109)
Number of households with income $75k - 100k:
Flower Mound:
12.4% (334)
State:
13.8% (511,639)
Number of households with income $100k - 125k:
Flower Mound:
14.5% (391)
State:
8.6% (319,728)
Number of households with income $125k - 150k:
Flower Mound:
6.7% (181)
State:
5.7% (210,932)
Number of households with income $150k - 200k:
Flower Mound:
12.2% (329)
Texas:
6.4% (236,055)
Number of households with income > $200k:
Flower Mound:
19.3% (523)
Texas:
5.1% (189,259)
Aggregate household income in Flower Mound in 2022: $371,908,600
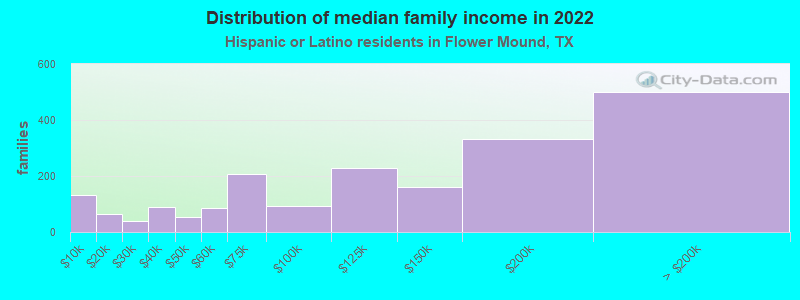
Median family income in Flower Mound in 2022:
Flower Mound:
$118,573
State:
$65,080
Number of families with income < $10k:
Flower Mound:
6.7% (132)
Texas:
5.3% (147,493)
Number of families with income $10k - 20k:
Flower Mound:
3.3% (65)
State:
6.3% (174,531)
Number of families with income $20k - 30k:
Flower Mound:
2.0% (40)
State:
8.6% (238,528)
Number of families with income $30k - 40k:
Flower Mound:
4.5% (89)
Texas:
9.1% (251,999)
Number of families with income $40k - 50k:
Flower Mound:
2.6% (52)
Texas:
8.6% (240,188)
Number of families with income $50k - 60k:
Flower Mound:
4.4% (87)
State:
8.0% (223,566)
Number of families with income $60k - 75k:
Flower Mound:
10.5% (208)
Texas:
10.9% (302,688)
Number of families with income $75k - 100k:
Flower Mound:
4.7% (93)
Texas:
14.3% (398,554)
Number of families with income $100k - 125k:
Flower Mound:
11.4% (227)
State:
9.5% (264,007)
Number of families with income $125k - 150k:
Flower Mound:
8.0% (159)
Texas:
6.2% (171,274)
Number of families with income $150k - 200k:
Flower Mound:
16.7% (331)
State:
7.3% (202,259)
Number of families with income > $200k:
Flower Mound:
25.2% (500)
Texas:
5.9% (165,129)
Median per capita income in Flower Mound in 2022:
Flower Mound:
$45,271
Texas:
$24,862
Change in median per capita income between 2000 and 2022:
Flower Mound, Texas:
+67.7%
Texas:
+130.8%
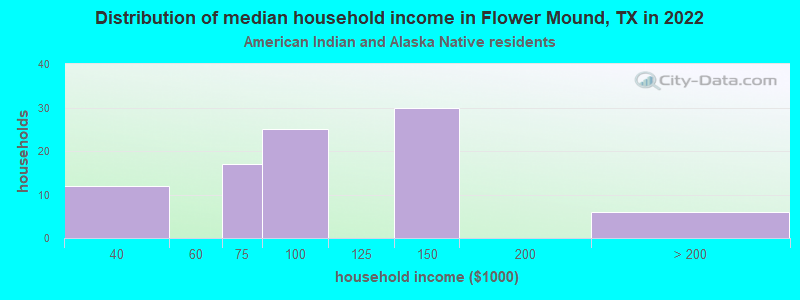
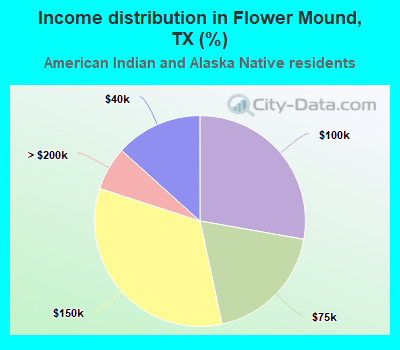
Income statistics for American Indian and Alaska Native residents
Number of households with income < $10k:
Flower Mound:
0.0% (0)
State:
4.1% (3,398)
Number of households with income $10k - 20k:
Flower Mound:
0.0% (0)
State:
8.3% (6,949)
Number of households with income $20k - 30k:
Flower Mound:
0.0% (0)
Texas:
9.3% (7,742)
Number of households with income $30k - 40k:
Flower Mound:
13.3% (12)
Texas:
9.1% (7,627)
Number of households with income $40k - 50k:
Flower Mound:
0.0% (0)
Texas:
7.1% (5,922)
Number of households with income $50k - 60k:
Flower Mound:
0.0% (0)
State:
8.1% (6,761)
Number of households with income $60k - 75k:
Flower Mound:
18.9% (17)
Texas:
12.7% (10,588)
Number of households with income $75k - 100k:
Flower Mound:
27.8% (25)
State:
13.0% (10,903)
Number of households with income $100k - 125k:
Flower Mound:
0.0% (0)
Texas:
9.9% (8,256)
Number of households with income $125k - 150k:
Flower Mound:
33.3% (30)
State:
5.2% (4,355)
Number of households with income $150k - 200k:
Flower Mound:
0.0% (0)
State:
6.7% (5,623)
Number of households with income > $200k:
Flower Mound:
6.7% (6)
State:
6.6% (5,522)
Aggregate household income in Flower Mound in 2022: $7,795,505
Median per capita income in Flower Mound in 2022:
Flower Mound:
$33,618
State:
$28,166
Change in median per capita income between 2000 and 2022:: -16.9%
Flower Mound, Texas:
-16.9%
State:
+77.2%
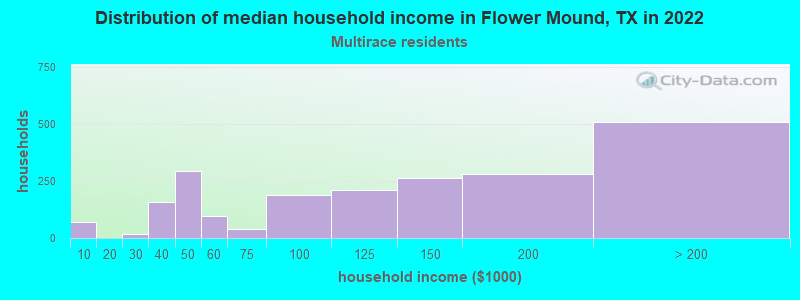
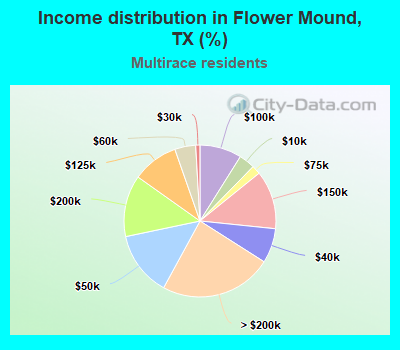
Income statistics for Multirace residents
Median household income in Flower Mound, TX in 2022:
Flower Mound:
$126,656
Texas:
$62,748
Change in median household income between 2000 and 2022:
Flower Mound, Texas:
+62.1%
State:
+92.3%
Number of households with income < $10k:
Flower Mound:
3.4% (72)
State:
5.5% (122,324)
Number of households with income $10k - 20k:
Flower Mound:
0.0% (0)
Texas:
8.2% (182,232)
Number of households with income $20k - 30k:
Flower Mound:
0.9% (19)
Texas:
8.5% (189,456)
Number of households with income $30k - 40k:
Flower Mound:
7.4% (157)
State:
8.9% (197,499)
Number of households with income $40k - 50k:
Flower Mound:
13.8% (293)
Texas:
8.7% (191,735)
Number of households with income $50k - 60k:
Flower Mound:
4.5% (95)
State:
8.0% (177,535)
Number of households with income $60k - 75k:
Flower Mound:
1.9% (40)
Texas:
10.5% (232,479)
Number of households with income $75k - 100k:
Flower Mound:
8.9% (190)
State:
13.1% (290,448)
Number of households with income $100k - 125k:
Flower Mound:
9.8% (209)
State:
8.6% (191,595)
Number of households with income $125k - 150k:
Flower Mound:
12.5% (265)
State:
6.0% (133,361)
Number of households with income $150k - 200k:
Flower Mound:
13.1% (279)
Texas:
7.2% (159,195)
Number of households with income > $200k:
Flower Mound:
23.9% (509)
State:
6.7% (148,064)
Aggregate household income in Flower Mound in 2022: $466,285,500
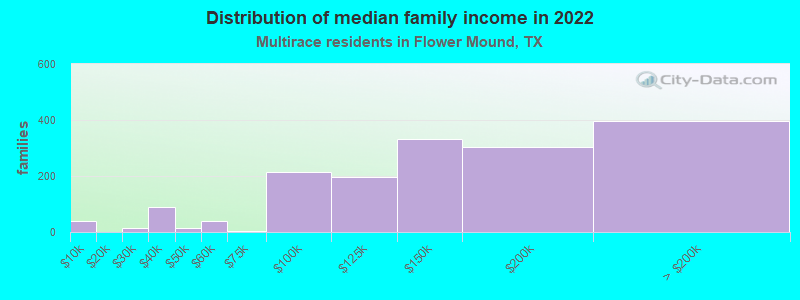
Median family income in Flower Mound in 2022:
Flower Mound:
$138,491
Texas:
$69,780
Number of families with income < $10k:
Flower Mound:
2.3% (38)
State:
4.4% (70,825)
Number of families with income $20k - 30k:
Flower Mound:
0.9% (15)
Texas:
7.8% (126,627)
Number of families with income $30k - 40k:
Flower Mound:
5.4% (89)
State:
8.5% (137,626)
Number of families with income $40k - 50k:
Flower Mound:
0.8% (13)
Texas:
8.4% (135,809)
Number of families with income $50k - 60k:
Flower Mound:
2.4% (39)
State:
7.9% (127,739)
Number of families with income $60k - 75k:
Flower Mound:
0.3% (5)
Texas:
10.5% (169,549)
Number of families with income $75k - 100k:
Flower Mound:
13.0% (214)
Texas:
14.0% (226,284)
Number of families with income $100k - 125k:
Flower Mound:
12.0% (196)
Texas:
9.5% (153,597)
Number of families with income $125k - 150k:
Flower Mound:
20.2% (332)
Texas:
6.7% (107,900)
Number of families with income $150k - 200k:
Flower Mound:
18.4% (302)
Texas:
8.5% (137,607)
Number of families with income > $200k:
Flower Mound:
24.2% (398)
State:
7.9% (127,299)
Median non-family income in Flower Mound in 2022:
Flower Mound:
$40,679
Texas:
$40,634
Median per capita income in Flower Mound in 2022:
Flower Mound:
$53,305
Texas:
$26,785
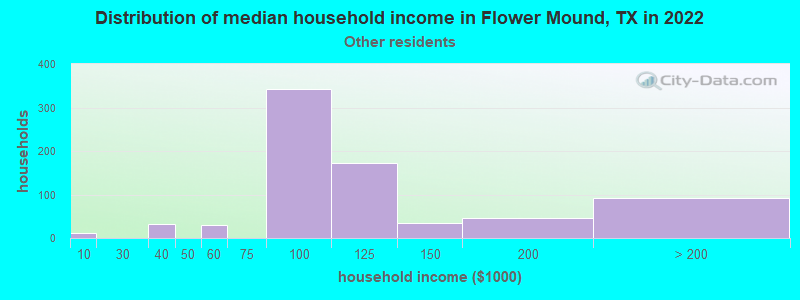
Income statistics for other residents
Median household income in Flower Mound, TX in 2022:
Flower Mound:
$115,625
Texas:
$57,114
Number of households with income < $10k:
Flower Mound:
1.6% (12)
Texas:
5.9% (54,162)
Number of households with income $10k - 20k:
Flower Mound:
0.0% (0)
State:
6.8% (62,891)
Number of households with income $20k - 30k:
Flower Mound:
0.0% (0)
State:
10.6% (97,294)
Number of households with income $30k - 40k:
Flower Mound:
4.2% (32)
State:
10.8% (99,670)
Number of households with income $40k - 50k:
Flower Mound:
0.0% (0)
Texas:
9.3% (85,548)
Number of households with income $50k - 60k:
Flower Mound:
3.9% (30)
Texas:
9.0% (82,757)
Number of households with income $60k - 75k:
Flower Mound:
0.0% (0)
Texas:
10.9% (100,326)
Number of households with income $75k - 100k:
Flower Mound:
45.0% (342)
State:
14.0% (128,767)
Number of households with income $100k - 125k:
Flower Mound:
22.6% (172)
Texas:
8.2% (75,218)
Number of households with income $125k - 150k:
Flower Mound:
4.5% (34)
State:
4.8% (44,223)
Number of households with income $150k - 200k:
Flower Mound:
6.2% (47)
Texas:
5.6% (51,376)
Number of households with income > $200k:
Flower Mound:
12.0% (91)
State:
4.0% (36,393)
Aggregate household income in Flower Mound in 2022: $99,741,070
Median per capita income in Flower Mound in 2022:
Flower Mound:
$31,566
State:
$23,899
Change in median per capita income between 2000 and 2022:
Flower Mound, Texas:
+27.5%
State:
+135.2%
Discuss Flower Mound, Texas (TX) on our hugely popular Texas forum.