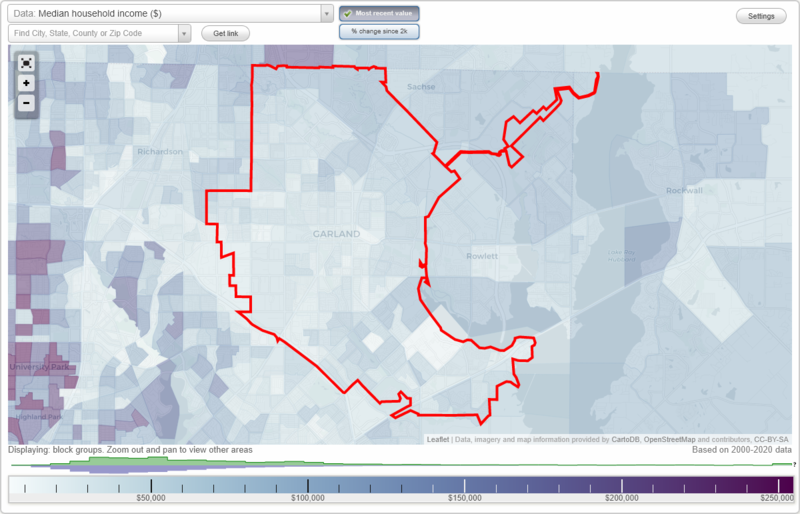
The median household income in Garland, TX in 2022 was $71,191, which was about the same as the median annual income of $72,284 across the entire state of Texas. Compared to the median income of $49,156 in 2000 this represents an increase of 31.0%. The per capita income in 2022 was $30,771, which means an increase of 35.0% compared to 2000 when it was $20,000.
Whole page based on the data from 2000 / 2022 when the population of Garland, Texas was 215,768 / 240,667
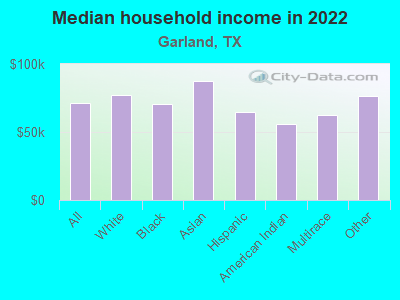
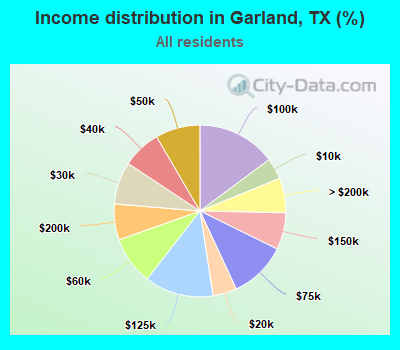
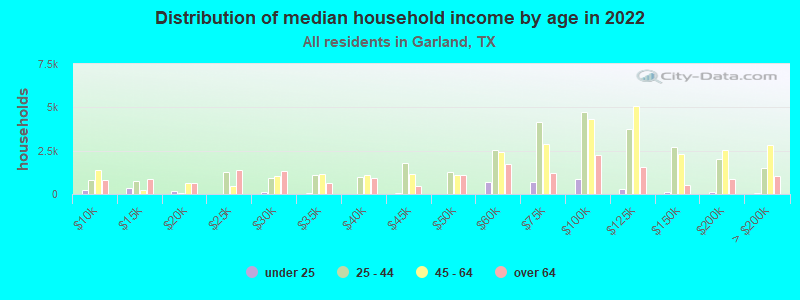
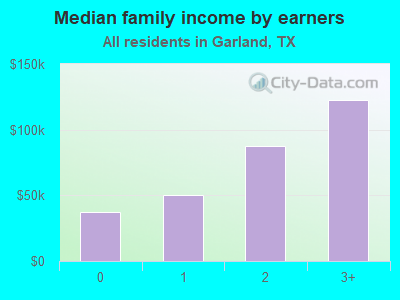
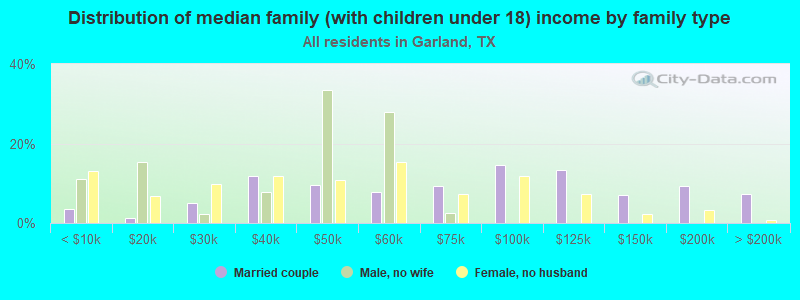
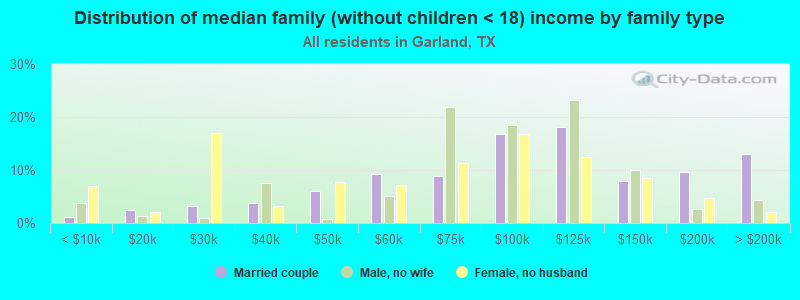
Income statistics for all residents
Median household income in Garland, TX in 2022:
Garland:
$71,191
State:
$72,284
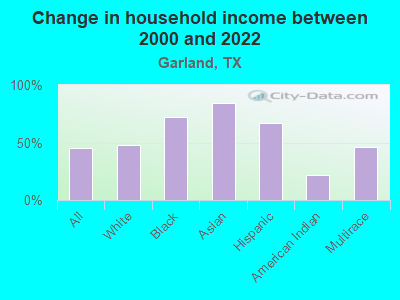
Change in median household income between 2000 and 2022:
Garland, Texas:
+44.8%
State:
+81.0%
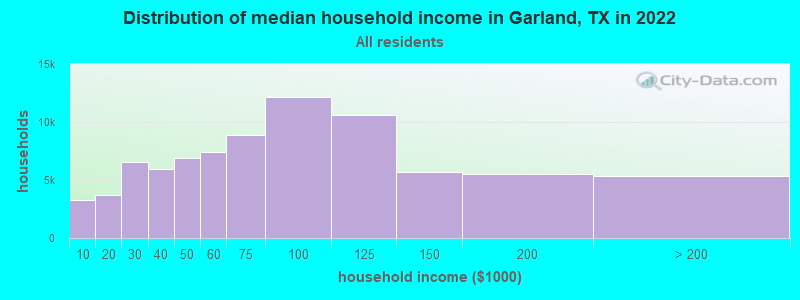
Number of households with income < $10k:
Garland:
4.0% (3,263)
State:
5.5% (611,011)
Number of households with income $10k - 20k:
Garland:
4.5% (3,698)
Texas:
6.7% (743,157)
Number of households with income $20k - 30k:
Garland:
8.0% (6,555)
Texas:
7.2% (803,381)
Number of households with income $30k - 40k:
Garland:
7.3% (5,972)
State:
7.8% (866,080)
Number of households with income $40k - 50k:
Garland:
8.4% (6,901)
State:
7.3% (810,440)
Number of households with income $50k - 60k:
Garland:
9.0% (7,421)
Texas:
7.2% (799,783)
Number of households with income $60k - 75k:
Garland:
10.8% (8,853)
State:
9.9% (1,095,384)
Number of households with income $75k - 100k:
Garland:
14.8% (12,172)
State:
12.8% (1,419,057)
Number of households with income $100k - 125k:
Garland:
12.9% (10,616)
State:
9.5% (1,054,577)
Number of households with income $125k - 150k:
Garland:
6.9% (5,686)
Texas:
6.7% (741,518)
Number of households with income $150k - 200k:
Garland:
6.8% (5,539)
State:
8.7% (961,776)
Number of households with income > $200k:
Garland:
6.5% (5,368)
State:
10.7% (1,181,544)
Aggregate household income in Garland in 2022: $7,315,451,100
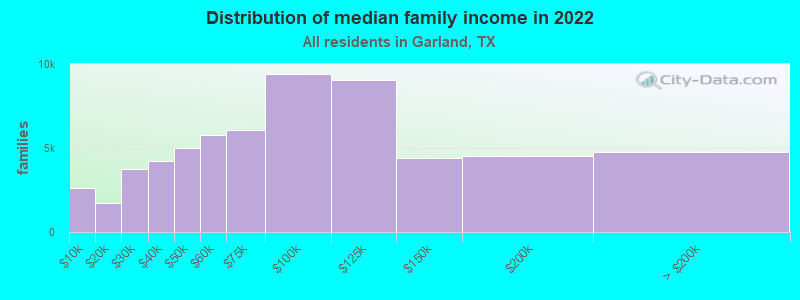
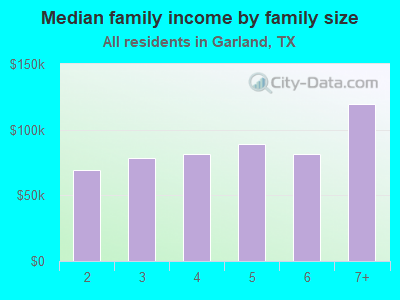
Median family income in Garland in 2022:
Garland:
$78,054
Texas:
$86,267
Number of families with income < $10k:
Garland:
4.2% (2,600)
State:
4.0% (297,884)
Number of families with income $10k - 20k:
Garland:
2.8% (1,733)
State:
4.3% (324,514)
Number of families with income $20k - 30k:
Garland:
6.1% (3,744)
Texas:
5.8% (430,949)
Number of families with income $30k - 40k:
Garland:
6.9% (4,212)
State:
6.6% (493,535)
Number of families with income $40k - 50k:
Garland:
8.2% (5,009)
State:
6.7% (499,663)
Number of families with income $50k - 60k:
Garland:
9.5% (5,791)
Texas:
6.6% (492,203)
Number of families with income $60k - 75k:
Garland:
9.9% (6,052)
State:
9.5% (710,229)
Number of families with income $75k - 100k:
Garland:
15.4% (9,419)
Texas:
13.6% (1,015,480)
Number of families with income $100k - 125k:
Garland:
14.8% (9,062)
State:
10.7% (797,961)
Number of families with income $125k - 150k:
Garland:
7.1% (4,381)
State:
8.1% (602,985)
Number of families with income $150k - 200k:
Garland:
7.4% (4,529)
State:
10.7% (804,459)
Number of families with income > $200k:
Garland:
7.7% (4,741)
Texas:
13.5% (1,013,514)
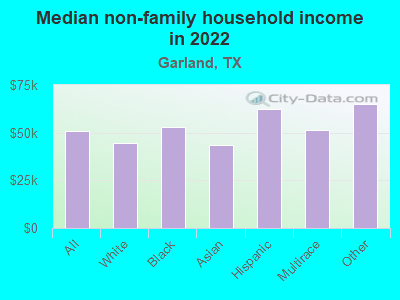
Median non-family income in Garland in 2022:
Garland:
$50,871
Texas:
$45,999
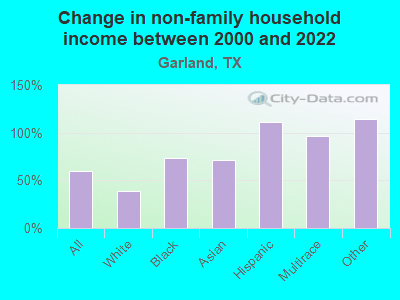
Change in median non-family income between 2000 and 2022:
Garland, Texas:
+59.5%
State:
+79.5%
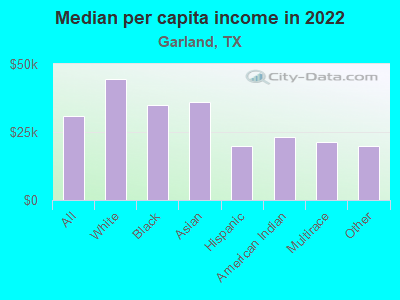
Median per capita income in Garland in 2022:
Garland:
$30,771
State:
$38,123
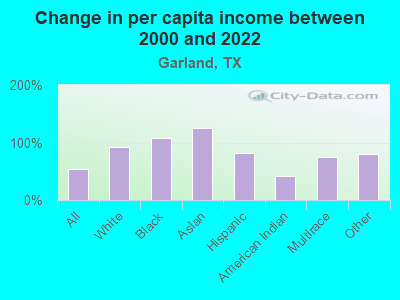
Change in median per capita income between 2000 and 2022:
Garland, Texas:
+53.9%
State:
+94.3%
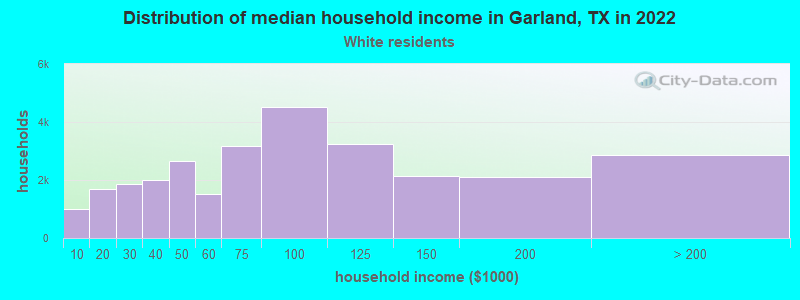
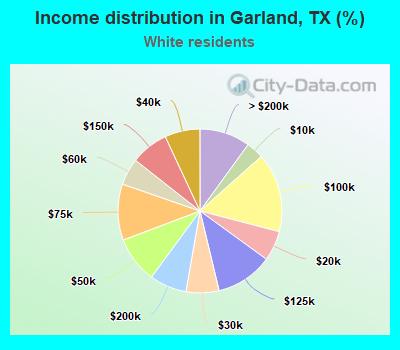
Income statistics for White residents
Median household income in Garland, TX in 2022:
Garland:
$77,377
Texas:
$82,032
Change in median household income between 2000 and 2022:
Garland, Texas:
+48.1%
State:
+91.0%
Number of households with income < $10k:
Garland:
3.4% (988)
State:
4.7% (273,716)
Number of households with income $10k - 20k:
Garland:
5.9% (1,705)
State:
5.5% (322,702)
Number of households with income $20k - 30k:
Garland:
6.5% (1,868)
State:
6.2% (363,947)
Number of households with income $30k - 40k:
Garland:
6.9% (1,997)
State:
6.8% (399,275)
Number of households with income $40k - 50k:
Garland:
9.2% (2,644)
State:
6.5% (383,417)
Number of households with income $50k - 60k:
Garland:
5.3% (1,524)
Texas:
6.6% (388,535)
Number of households with income $60k - 75k:
Garland:
11.1% (3,183)
State:
9.7% (566,295)
Number of households with income $75k - 100k:
Garland:
15.6% (4,501)
Texas:
13.0% (760,276)
Number of households with income $100k - 125k:
Garland:
11.3% (3,238)
Texas:
10.2% (597,596)
Number of households with income $125k - 150k:
Garland:
7.4% (2,138)
State:
7.4% (436,830)
Number of households with income $150k - 200k:
Garland:
7.3% (2,105)
State:
9.9% (583,067)
Number of households with income > $200k:
Garland:
10.0% (2,876)
Texas:
13.5% (792,647)
Aggregate household income in Garland in 2022: $2,874,481,100
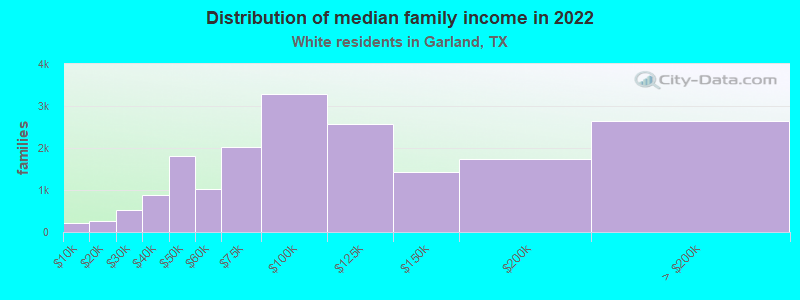
Median family income in Garland in 2022:
Garland:
$93,516
State:
$101,788
Number of families with income < $10k:
Garland:
1.2% (216)
State:
2.8% (108,142)
Number of families with income $10k - 20k:
Garland:
1.4% (260)
State:
2.9% (113,421)
Number of families with income $20k - 30k:
Garland:
2.8% (512)
State:
4.1% (157,688)
Number of families with income $30k - 40k:
Garland:
4.7% (872)
State:
5.2% (198,847)
Number of families with income $40k - 50k:
Garland:
9.8% (1,801)
State:
5.6% (216,490)
Number of families with income $50k - 60k:
Garland:
5.6% (1,033)
State:
5.7% (220,689)
Number of families with income $60k - 75k:
Garland:
11.0% (2,029)
State:
9.0% (346,106)
Number of families with income $75k - 100k:
Garland:
17.8% (3,277)
Texas:
13.7% (527,363)
Number of families with income $100k - 125k:
Garland:
14.0% (2,562)
State:
11.6% (448,411)
Number of families with income $125k - 150k:
Garland:
7.8% (1,435)
State:
9.2% (355,798)
Number of families with income $150k - 200k:
Garland:
9.4% (1,732)
State:
12.5% (480,185)
Number of families with income > $200k:
Garland:
14.3% (2,635)
State:
17.6% (677,490)
Median non-family income in Garland in 2022:
Garland:
$44,681
State:
$50,587
Change in median non-family income between 2000 and 2022:
Garland, Texas:
+38.6%
Texas:
+87.7%
Median per capita income in Garland in 2022:
Garland:
$44,531
Texas:
$47,740
Change in median per capita income between 2000 and 2022:
Garland, Texas:
+92.9%
State:
+114.3%
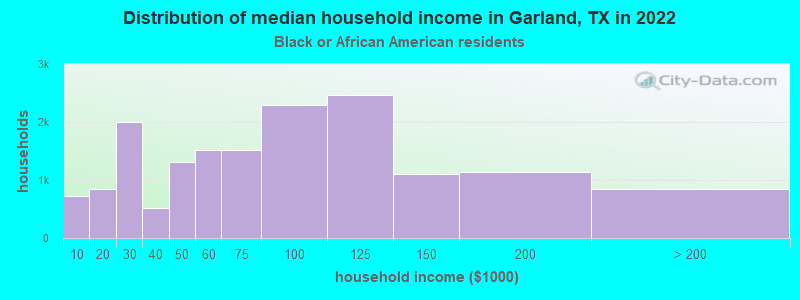
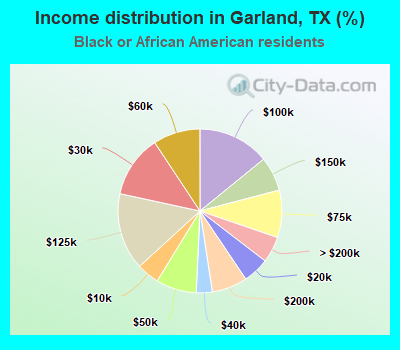
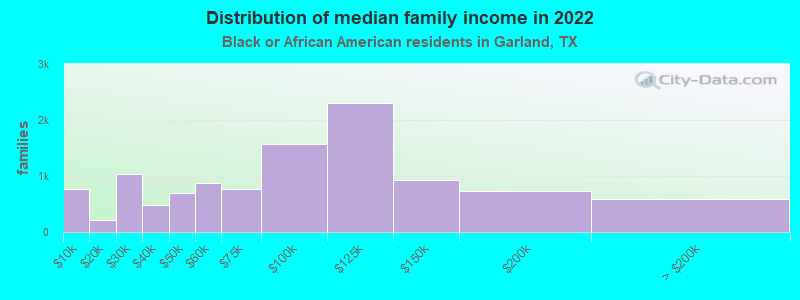
Income statistics for Black or African American residents
Median household income in Garland, TX in 2022:
Garland:
$70,709
State:
$55,759
Change in median household income between 2000 and 2022:
Garland, Texas:
+72.4%
State:
+90.3%
Number of households with income < $10k:
Garland:
4.5% (724)
State:
8.9% (126,378)
Number of households with income $10k - 20k:
Garland:
5.2% (840)
State:
9.9% (140,369)
Number of households with income $20k - 30k:
Garland:
12.3% (2,000)
State:
8.5% (120,639)
Number of households with income $30k - 40k:
Garland:
3.2% (514)
State:
9.7% (137,517)
Number of households with income $40k - 50k:
Garland:
8.0% (1,302)
Texas:
8.0% (112,973)
Number of households with income $50k - 60k:
Garland:
9.3% (1,511)
State:
8.3% (117,156)
Number of households with income $60k - 75k:
Garland:
9.4% (1,520)
Texas:
10.4% (147,462)
Number of households with income $75k - 100k:
Garland:
14.1% (2,295)
State:
11.5% (162,718)
Number of households with income $100k - 125k:
Garland:
15.2% (2,465)
State:
8.2% (115,829)
Number of households with income $125k - 150k:
Garland:
6.8% (1,101)
Texas:
4.9% (69,556)
Number of households with income $150k - 200k:
Garland:
7.0% (1,136)
State:
6.4% (90,701)
Number of households with income > $200k:
Garland:
5.2% (838)
State:
5.5% (77,988)
Aggregate household income in Garland in 2022: $1,364,827,800
Median family income in Garland in 2022:
Garland:
$82,478
State:
$69,134
Number of families with income < $10k:
Garland:
6.9% (761)
Texas:
6.8% (55,625)
Number of families with income $10k - 20k:
Garland:
1.9% (207)
State:
6.8% (55,300)
Number of families with income $20k - 30k:
Garland:
9.5% (1,037)
State:
7.1% (57,877)
Number of families with income $30k - 40k:
Garland:
4.4% (478)
State:
8.5% (68,776)
Number of families with income $40k - 50k:
Garland:
6.4% (705)
State:
7.1% (57,907)
Number of families with income $50k - 60k:
Garland:
8.0% (876)
State:
7.3% (59,511)
Number of families with income $60k - 75k:
Garland:
7.0% (768)
State:
10.1% (81,994)
Number of families with income $75k - 100k:
Garland:
14.3% (1,567)
State:
12.7% (103,723)
Number of families with income $100k - 125k:
Garland:
21.0% (2,304)
State:
9.4% (76,609)
Number of families with income $125k - 150k:
Garland:
8.5% (934)
State:
6.8% (55,615)
Number of families with income $150k - 200k:
Garland:
6.7% (729)
State:
9.4% (76,146)
Number of families with income > $200k:
Garland:
5.4% (596)
State:
7.9% (64,439)
Median non-family income in Garland in 2022:
Garland:
$53,033
State:
$40,133
Change in median non-family income between 2000 and 2022:
Garland, Texas:
+72.9%
State:
+102.2%
Median per capita income in Garland in 2022:
Garland:
$34,886
Texas:
$30,490
Change in median per capita income between 2000 and 2022:
Garland, Texas:
+108.2%
State:
+113.9%
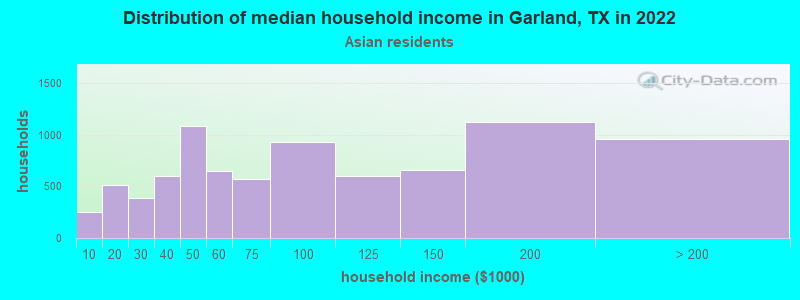
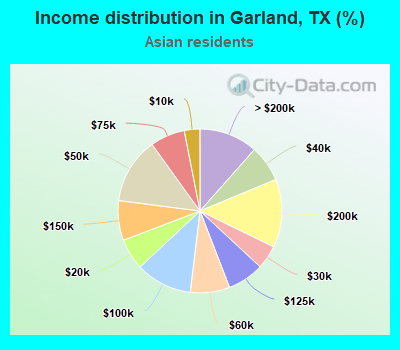
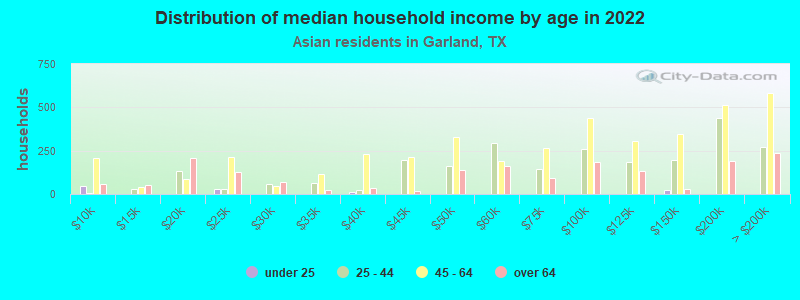
Income statistics for Asian residents
Median household income in Garland, TX in 2022:
Garland:
$87,632
Texas:
$107,673
Change in median household income between 2000 and 2022:
Garland, Texas:
+84.4%
State:
+115.1%
Number of households with income < $10k:
Garland:
3.1% (256)
State:
5.2% (29,885)
Number of households with income $10k - 20k:
Garland:
6.2% (513)
Texas:
4.7% (27,044)
Number of households with income $20k - 30k:
Garland:
4.7% (392)
State:
4.1% (23,363)
Number of households with income $30k - 40k:
Garland:
7.2% (599)
State:
4.1% (23,309)
Number of households with income $40k - 50k:
Garland:
13.0% (1,085)
Texas:
5.2% (29,826)
Number of households with income $50k - 60k:
Garland:
7.8% (649)
State:
4.7% (26,512)
Number of households with income $60k - 75k:
Garland:
6.9% (571)
State:
6.5% (36,905)
Number of households with income $75k - 100k:
Garland:
11.1% (926)
Texas:
11.3% (64,350)
Number of households with income $100k - 125k:
Garland:
7.2% (600)
Texas:
11.4% (64,714)
Number of households with income $125k - 150k:
Garland:
7.9% (654)
State:
9.3% (52,719)
Number of households with income $150k - 200k:
Garland:
13.5% (1,123)
Texas:
12.5% (70,953)
Number of households with income > $200k:
Garland:
11.5% (962)
State:
21.1% (120,260)
Aggregate household income in Garland in 2022: $691,232,700
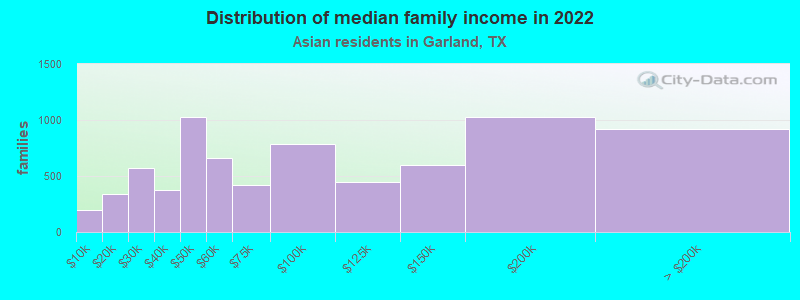
Median family income in Garland in 2022:
Garland:
$87,755
State:
$123,328
Number of families with income < $10k:
Garland:
2.7% (198)
State:
3.1% (13,567)
Number of families with income $10k - 20k:
Garland:
4.6% (342)
State:
3.0% (13,043)
Number of families with income $20k - 30k:
Garland:
7.8% (574)
State:
3.4% (14,738)
Number of families with income $30k - 40k:
Garland:
5.1% (372)
Texas:
3.4% (15,033)
Number of families with income $40k - 50k:
Garland:
14.0% (1,029)
State:
4.9% (21,622)
Number of families with income $50k - 60k:
Garland:
9.0% (663)
Texas:
4.7% (20,568)
Number of families with income $60k - 75k:
Garland:
5.7% (419)
State:
6.1% (26,637)
Number of families with income $75k - 100k:
Garland:
10.6% (784)
State:
10.7% (46,626)
Number of families with income $100k - 125k:
Garland:
6.0% (444)
State:
11.3% (49,585)
Number of families with income $125k - 150k:
Garland:
8.1% (596)
State:
9.8% (43,043)
Number of families with income $150k - 200k:
Garland:
13.9% (1,023)
State:
14.7% (64,203)
Number of families with income > $200k:
Garland:
12.5% (917)
Texas:
24.8% (108,511)
Median non-family income in Garland in 2022:
Garland:
$43,270
Texas:
$64,320
Change in median non-family income between 2000 and 2022:
Garland, Texas:
+70.6%
State:
+131.1%
Median per capita income in Garland in 2022:
Garland:
$36,071
State:
$48,626
Change in median per capita income between 2000 and 2022:
Garland, Texas:
+126.1%
Texas:
+132.0%
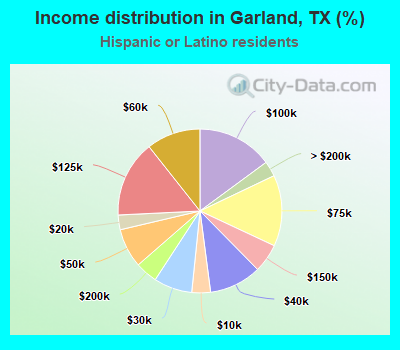
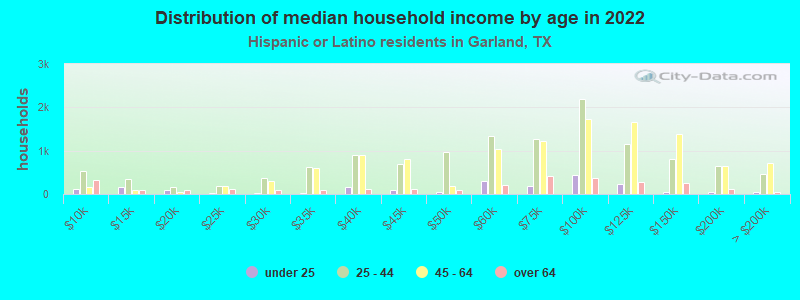
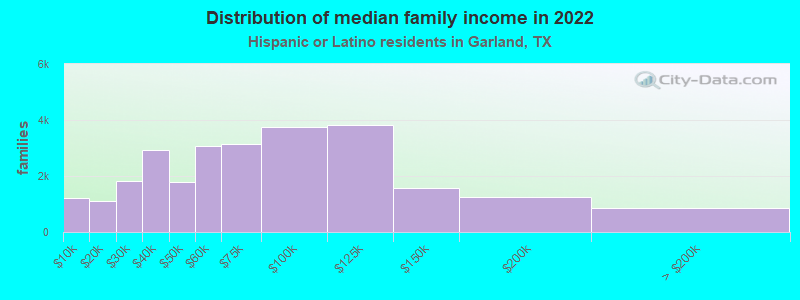
Income statistics for Hispanic or Latino residents
Median household income in Garland, TX in 2022:
Garland:
$64,894
Texas:
$60,504
Change in median household income between 2000 and 2022:
Garland, Texas:
+66.8%
State:
+102.5%
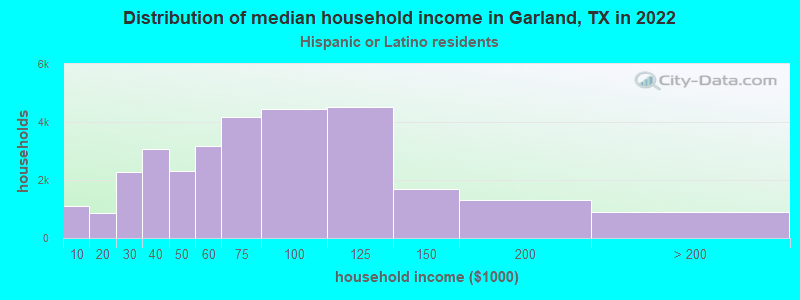
Number of households with income < $10k:
Garland:
3.7% (1,102)
Texas:
5.8% (213,953)
Number of households with income $10k - 20k:
Garland:
2.9% (860)
State:
8.0% (297,456)
Number of households with income $20k - 30k:
Garland:
7.6% (2,259)
State:
9.2% (340,166)
Number of households with income $30k - 40k:
Garland:
10.3% (3,067)
State:
9.5% (354,336)
Number of households with income $40k - 50k:
Garland:
7.7% (2,308)
State:
8.8% (327,013)
Number of households with income $50k - 60k:
Garland:
10.7% (3,176)
State:
8.3% (308,818)
Number of households with income $60k - 75k:
Garland:
14.0% (4,183)
Texas:
10.9% (405,109)
Number of households with income $75k - 100k:
Garland:
14.9% (4,445)
State:
13.8% (511,639)
Number of households with income $100k - 125k:
Garland:
15.1% (4,508)
Texas:
8.6% (319,728)
Number of households with income $125k - 150k:
Garland:
5.7% (1,689)
State:
5.7% (210,932)
Number of households with income $150k - 200k:
Garland:
4.4% (1,309)
Texas:
6.4% (236,055)
Number of households with income > $200k:
Garland:
3.0% (902)
State:
5.1% (189,259)
Aggregate household income in Garland in 2022: $2,286,976,600
Median family income in Garland in 2022:
Garland:
$63,535
Texas:
$65,080
Number of families with income < $10k:
Garland:
4.6% (1,214)
Texas:
5.3% (147,493)
Number of families with income $10k - 20k:
Garland:
4.2% (1,102)
Texas:
6.3% (174,531)
Number of families with income $20k - 30k:
Garland:
6.9% (1,808)
Texas:
8.6% (238,528)
Number of families with income $30k - 40k:
Garland:
11.1% (2,918)
State:
9.1% (251,999)
Number of families with income $40k - 50k:
Garland:
6.8% (1,800)
State:
8.6% (240,188)
Number of families with income $50k - 60k:
Garland:
11.6% (3,057)
State:
8.0% (223,566)
Number of families with income $60k - 75k:
Garland:
12.0% (3,149)
State:
10.9% (302,688)
Number of families with income $75k - 100k:
Garland:
14.3% (3,764)
State:
14.3% (398,554)
Number of families with income $100k - 125k:
Garland:
14.6% (3,834)
Texas:
9.5% (264,007)
Number of families with income $125k - 150k:
Garland:
6.0% (1,582)
State:
6.2% (171,274)
Number of families with income $150k - 200k:
Garland:
4.8% (1,266)
State:
7.3% (202,259)
Number of families with income > $200k:
Garland:
3.2% (852)
State:
5.9% (165,129)
Median non-family income in Garland in 2022:
Garland:
$62,249
Texas:
$39,934
Change in median non-family income between 2000 and 2022:
Garland, Texas:
+111.0%
State:
+109.1%
Median per capita income in Garland in 2022:
Garland:
$19,807
State:
$24,862
Change in median per capita income between 2000 and 2022:
Garland, Texas:
+81.7%
State:
+130.8%
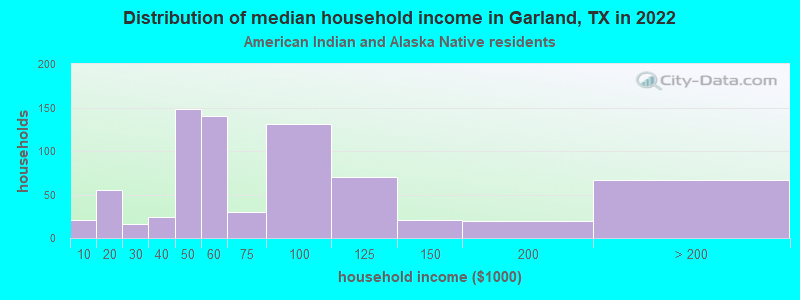
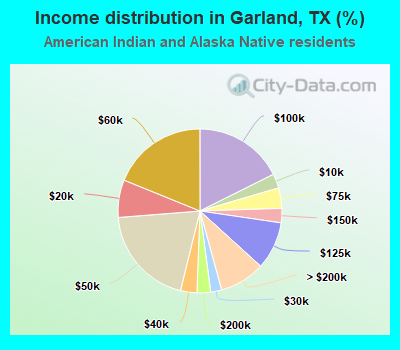
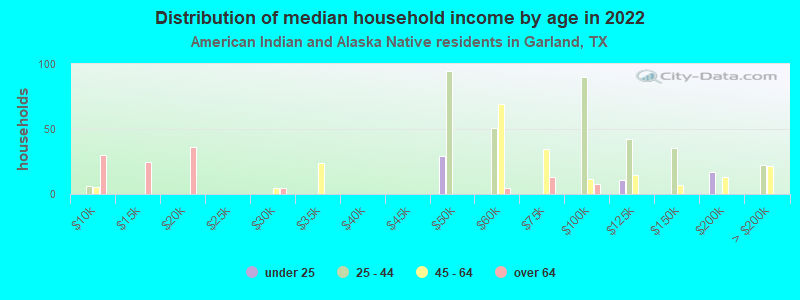
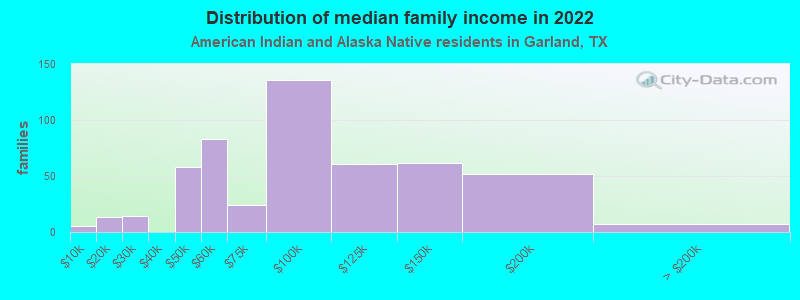
Income statistics for American Indian and Alaska Native residents
Median household income in Garland, TX in 2022:
Garland:
$55,694
Texas:
$65,765
Change in median household income between 2000 and 2022:
Garland, Texas:
+21.5%
State:
+88.3%
Number of households with income < $10k:
Garland:
2.8% (21)
State:
4.1% (3,398)
Number of households with income $10k - 20k:
Garland:
7.4% (55)
State:
8.3% (6,949)
Number of households with income $20k - 30k:
Garland:
2.2% (16)
Texas:
9.3% (7,742)
Number of households with income $30k - 40k:
Garland:
3.2% (24)
State:
9.1% (7,627)
Number of households with income $40k - 50k:
Garland:
19.9% (148)
State:
7.1% (5,922)
Number of households with income $50k - 60k:
Garland:
18.8% (140)
State:
8.1% (6,761)
Number of households with income $60k - 75k:
Garland:
4.0% (30)
Texas:
12.7% (10,588)
Number of households with income $75k - 100k:
Garland:
17.6% (131)
Texas:
13.0% (10,903)
Number of households with income $100k - 125k:
Garland:
9.4% (70)
State:
9.9% (8,256)
Number of households with income $125k - 150k:
Garland:
2.8% (21)
State:
5.2% (4,355)
Number of households with income $150k - 200k:
Garland:
2.7% (20)
State:
6.7% (5,623)
Number of households with income > $200k:
Garland:
9.0% (67)
State:
6.6% (5,522)
Aggregate household income in Garland in 2022: $16,732,400
Median family income in Garland in 2022:
Garland:
$72,585
State:
$72,369
Number of families with income < $10k:
Garland:
1.0% (5)
State:
2.7% (1,671)
Number of families with income $10k - 20k:
Garland:
2.5% (13)
Texas:
8.0% (4,891)
Number of families with income $20k - 30k:
Garland:
2.7% (14)
Texas:
7.3% (4,502)
Number of families with income $40k - 50k:
Garland:
11.2% (58)
State:
7.9% (4,855)
Number of families with income $50k - 60k:
Garland:
16.2% (83)
State:
7.1% (4,347)
Number of families with income $60k - 75k:
Garland:
4.6% (24)
State:
12.1% (7,429)
Number of families with income $75k - 100k:
Garland:
26.3% (136)
State:
14.4% (8,852)
Number of families with income $100k - 125k:
Garland:
11.9% (61)
State:
11.4% (6,997)
Number of families with income $125k - 150k:
Garland:
12.1% (62)
Texas:
7.5% (4,609)
Number of families with income $150k - 200k:
Garland:
10.1% (52)
Texas:
6.9% (4,246)
Number of families with income > $200k:
Garland:
1.3% (7)
State:
7.0% (4,287)
Median per capita income in Garland in 2022:
Garland:
$23,097
Texas:
$28,166
Change in median per capita income between 2000 and 2022:
Garland, Texas:
+41.8%
State:
+77.2%
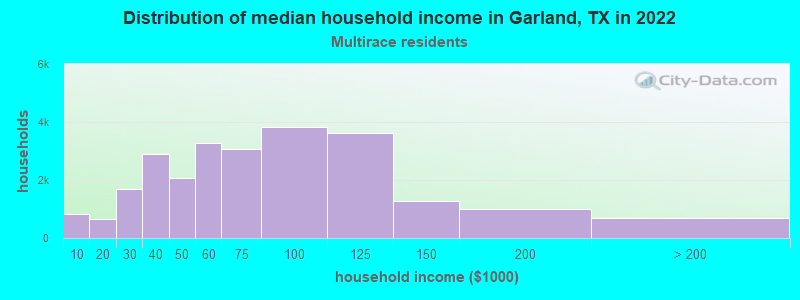
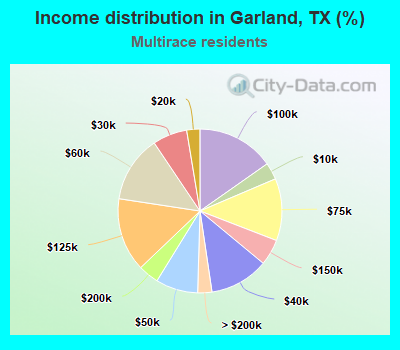
Income statistics for Multirace residents
Median household income in Garland, TX in 2022:
Garland:
$62,370
Texas:
$62,748
Change in median household income between 2000 and 2022:
Garland, Texas:
+45.9%
State:
+92.3%
Number of households with income < $10k:
Garland:
3.3% (834)
State:
5.5% (122,324)
Number of households with income $10k - 20k:
Garland:
2.6% (649)
State:
8.2% (182,232)
Number of households with income $20k - 30k:
Garland:
6.8% (1,701)
State:
8.5% (189,456)
Number of households with income $30k - 40k:
Garland:
11.6% (2,908)
State:
8.9% (197,499)
Number of households with income $40k - 50k:
Garland:
8.3% (2,082)
Texas:
8.7% (191,735)
Number of households with income $50k - 60k:
Garland:
13.2% (3,293)
State:
8.0% (177,535)
Number of households with income $60k - 75k:
Garland:
12.3% (3,064)
Texas:
10.5% (232,479)
Number of households with income $75k - 100k:
Garland:
15.3% (3,813)
State:
13.1% (290,448)
Number of households with income $100k - 125k:
Garland:
14.5% (3,631)
State:
8.6% (191,595)
Number of households with income $125k - 150k:
Garland:
5.1% (1,286)
Texas:
6.0% (133,361)
Number of households with income $150k - 200k:
Garland:
4.1% (1,015)
State:
7.2% (159,195)
Number of households with income > $200k:
Garland:
2.8% (702)
Texas:
6.7% (148,064)
Aggregate household income in Garland in 2022: $1,932,777,500
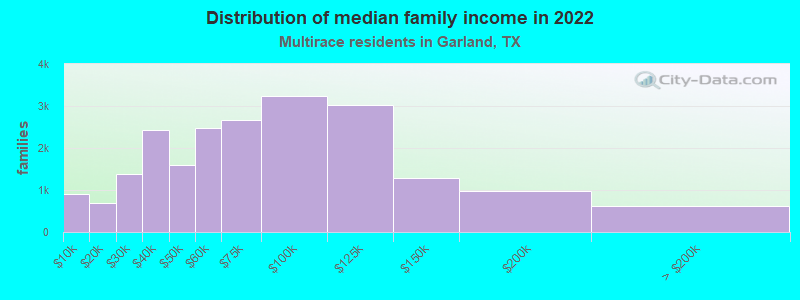
Median family income in Garland in 2022:
Garland:
$63,985
State:
$69,780
Number of families with income < $10k:
Garland:
4.3% (906)
Texas:
4.4% (70,825)
Number of families with income $10k - 20k:
Garland:
3.3% (696)
State:
5.9% (95,279)
Number of families with income $20k - 30k:
Garland:
6.4% (1,371)
State:
7.8% (126,627)
Number of families with income $30k - 40k:
Garland:
11.4% (2,418)
State:
8.5% (137,626)
Number of families with income $40k - 50k:
Garland:
7.5% (1,586)
Texas:
8.4% (135,809)
Number of families with income $50k - 60k:
Garland:
11.6% (2,470)
State:
7.9% (127,739)
Number of families with income $60k - 75k:
Garland:
12.6% (2,673)
Texas:
10.5% (169,549)
Number of families with income $75k - 100k:
Garland:
15.3% (3,244)
State:
14.0% (226,284)
Number of families with income $100k - 125k:
Garland:
14.2% (3,028)
Texas:
9.5% (153,597)
Number of families with income $125k - 150k:
Garland:
6.0% (1,286)
Texas:
6.7% (107,900)
Number of families with income $150k - 200k:
Garland:
4.6% (977)
State:
8.5% (137,607)
Number of families with income > $200k:
Garland:
2.9% (611)
State:
7.9% (127,299)
Median non-family income in Garland in 2022:
Garland:
$51,382
State:
$40,634
Change in median non-family income between 2000 and 2022:
Garland, Texas:
+96.6%
State:
+77.2%
Median per capita income in Garland in 2022:
Garland:
$21,287
Texas:
$26,785
Change in median per capita income between 2000 and 2022:
Garland, Texas:
+74.9%
State:
+110.9%
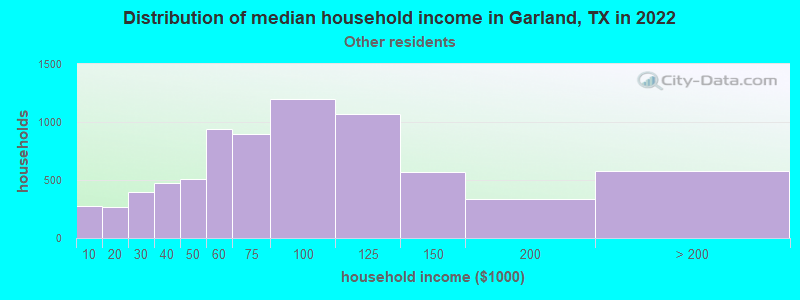
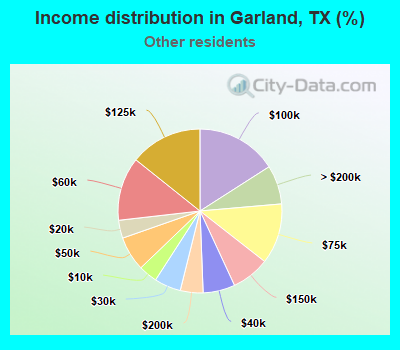
Income statistics for other residents
Median household income in Garland, TX in 2022:
Garland:
$76,487
Texas:
$57,114
Number of households with income < $10k:
Garland:
3.7% (279)
State:
5.9% (54,162)
Number of households with income $10k - 20k:
Garland:
3.6% (267)
State:
6.8% (62,891)
Number of households with income $20k - 30k:
Garland:
5.2% (393)
State:
10.6% (97,294)
Number of households with income $30k - 40k:
Garland:
6.3% (474)
State:
10.8% (99,670)
Number of households with income $40k - 50k:
Garland:
6.8% (512)
Texas:
9.3% (85,548)
Number of households with income $50k - 60k:
Garland:
12.5% (942)
State:
9.0% (82,757)
Number of households with income $60k - 75k:
Garland:
11.9% (896)
Texas:
10.9% (100,326)
Number of households with income $75k - 100k:
Garland:
15.9% (1,198)
State:
14.0% (128,767)
Number of households with income $100k - 125k:
Garland:
14.3% (1,072)
Texas:
8.2% (75,218)
Number of households with income $125k - 150k:
Garland:
7.5% (566)
State:
4.8% (44,223)
Number of households with income $150k - 200k:
Garland:
4.5% (337)
State:
5.6% (51,376)
Number of households with income > $200k:
Garland:
7.7% (578)
State:
4.0% (36,393)
Aggregate household income in Garland in 2022: $435,399,500
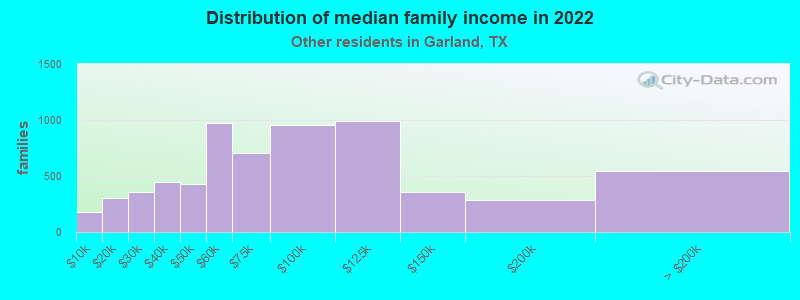
Median family income in Garland in 2022:
Garland:
$56,742
State:
$60,064
Number of families with income < $10k:
Garland:
2.7% (179)
State:
6.8% (47,502)
Number of families with income $10k - 20k:
Garland:
4.6% (301)
State:
6.0% (41,763)
Number of families with income $20k - 30k:
Garland:
5.5% (359)
State:
9.9% (68,761)
Number of families with income $30k - 40k:
Garland:
6.8% (443)
State:
9.7% (67,685)
Number of families with income $40k - 50k:
Garland:
6.6% (432)
Texas:
9.0% (62,441)
Number of families with income $50k - 60k:
Garland:
14.9% (973)
Texas:
8.5% (59,321)
Number of families with income $60k - 75k:
Garland:
10.8% (706)
State:
11.2% (77,588)
Number of families with income $75k - 100k:
Garland:
14.7% (959)
Texas:
14.5% (101,032)
Number of families with income $100k - 125k:
Garland:
15.2% (995)
State:
8.8% (61,439)
Number of families with income $125k - 150k:
Garland:
5.5% (361)
State:
5.1% (35,727)
Number of families with income $150k - 200k:
Garland:
4.4% (290)
State:
5.9% (41,211)
Number of families with income > $200k:
Garland:
8.3% (541)
State:
4.5% (31,243)
Median non-family income in Garland in 2022:
Garland:
$65,187
Texas:
$38,690
Change in median non-family income between 2000 and 2022:
Garland, Texas:
+113.6%
State:
+90.2%
Median per capita income in Garland in 2022:
Garland:
$19,943
State:
$23,899
Change in median per capita income between 2000 and 2022:
Garland, Texas:
+79.8%
State:
+135.2%
Discuss Garland, Texas (TX) on our hugely popular Texas forum.