Granby, Connecticut (CT) income map, earnings map, and wages data
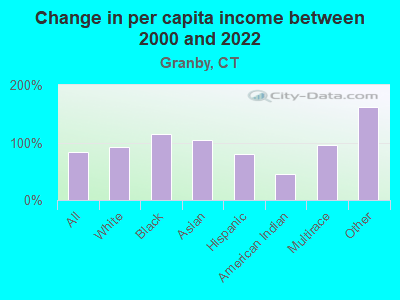
The median household income in Granby, CT in 2022 was $137,318, which was 35.6% greater than the median annual income of $88,429 across the entire state of Connecticut. Compared to the median income of $81,151 in 2000 this represents an increase of 40.9%. The per capita income in 2022 was $61,945, which means an increase of 45.3% compared to 2000 when it was $33,863.
Income statistics for all residents
Median household income in Granby, CT in 2022:| Granby: | $137,319 |
| State: | $88,429 |
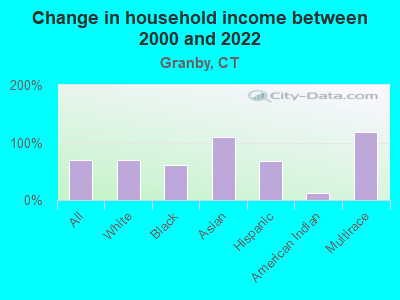
Change in median household income between 2000 and 2022:| Granby, Connecticut: | +69.2% |
| State: | +64.0% |
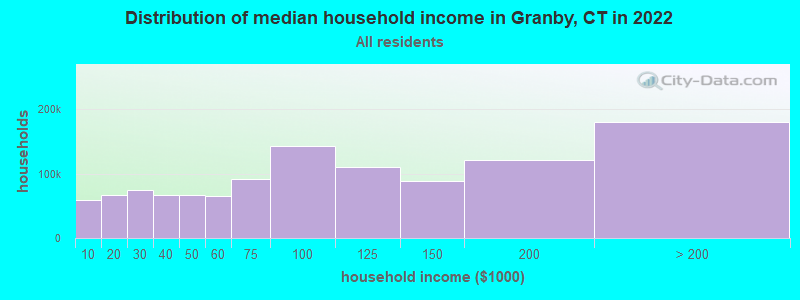
Number of households with income < $10k:| Granby: | 5.2% (55,932) |
| State: | 5.1% (72,746) |
Number of households with income $10k - 20k:| Granby: | 5.8% (63,072) |
| State: | 5.7% (81,643) |
Number of households with income $20k - 30k:| Granby: | 6.6% (71,392) |
| State: | 6.5% (92,844) |
Number of households with income $30k - 40k:| Granby: | 5.9% (64,070) |
| Connecticut: | 5.9% (83,934) |
Number of households with income $40k - 50k:| Granby: | 5.9% (63,658) |
| Connecticut: | 5.8% (83,025) |
Number of households with income $50k - 60k:| Granby: | 5.8% (62,421) |
| State: | 5.7% (81,788) |
Number of households with income $60k - 75k:| Granby: | 8.1% (87,460) |
| State: | 8.1% (115,651) |
Number of households with income $75k - 100k:| Granby: | 12.6% (136,593) |
| State: | 12.6% (180,173) |
Number of households with income $100k - 125k:| Granby: | 9.8% (106,336) |
| Connecticut: | 9.9% (141,231) |
Number of households with income $125k - 150k:| Granby: | 7.8% (84,920) |
| State: | 7.9% (112,826) |
Number of households with income $150k - 200k:| Granby: | 10.7% (116,163) |
| State: | 10.8% (154,641) |
Number of households with income > $200k:| Granby: | 16.0% (173,541) |
| State: | 16.3% (233,133) |
Aggregate household income in Granby in 2022: $14,861,962,610
Median family income in Granby in 2022:| Granby: | $160,841 |
| Connecticut: | $115,183 |
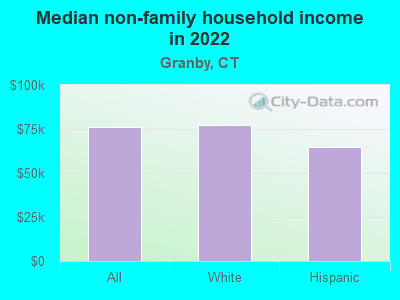
Median non-family income in Granby in 2022:| Granby: | $76,151 |
| State: | $50,964 |
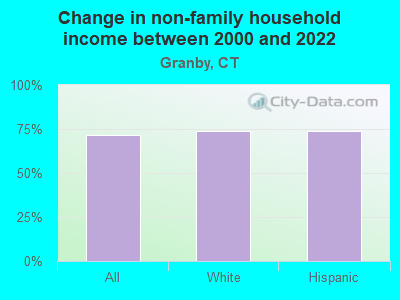
Change in median non-family income between 2000 and 2022:| Granby, Connecticut: | +71.5% |
| Connecticut: | +65.1% |
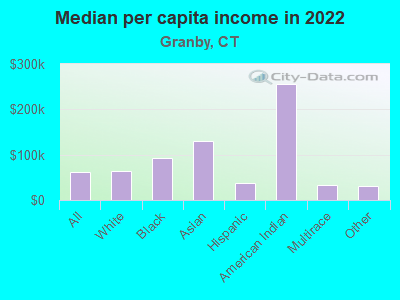
Median per capita income in Granby in 2022:| Granby: | $61,945 |
| State: | $51,581 |
Change in median per capita income between 2000 and 2022:| Granby, Connecticut: | +82.9% |
| State: | +79.3% |
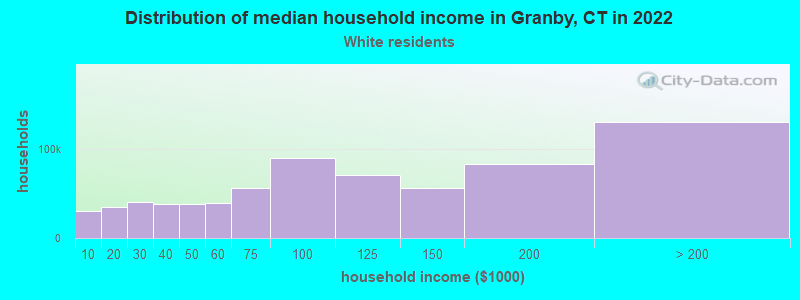
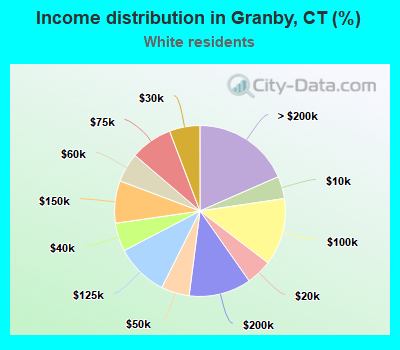
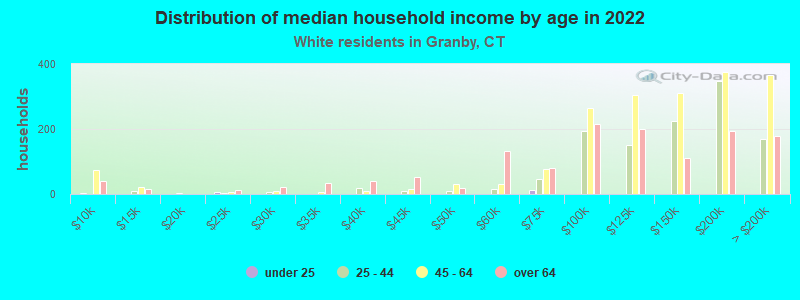
Income statistics for White residents
Median household income in Granby, CT in 2022:| Granby: | $137,289 |
| State: | $96,890 |
Change in median household income between 2000 and 2022:| Granby, Connecticut: | +69.4% |
| State: | +68.5% |
Number of households with income < $10k:| Granby: | 4.2% (30,028) |
| State: | 4.2% (42,265) |
Number of households with income $10k - 20k:| Granby: | 4.9% (34,523) |
| State: | 4.8% (48,323) |
Number of households with income $20k - 30k:| Granby: | 5.8% (41,057) |
| State: | 5.7% (57,716) |
Number of households with income $30k - 40k:| Granby: | 5.4% (38,004) |
| Connecticut: | 5.3% (53,827) |
Number of households with income $40k - 50k:| Granby: | 5.3% (37,847) |
| State: | 5.3% (53,301) |
Number of households with income $50k - 60k:| Granby: | 5.6% (39,387) |
| Connecticut: | 5.5% (55,690) |
Number of households with income $60k - 75k:| Granby: | 7.9% (56,287) |
| State: | 8.0% (80,329) |
Number of households with income $75k - 100k:| Granby: | 12.7% (90,193) |
| Connecticut: | 12.7% (128,070) |
Number of households with income $100k - 125k:| Granby: | 10.0% (70,823) |
| State: | 10.0% (101,210) |
Number of households with income $125k - 150k:| Granby: | 8.0% (56,859) |
| State: | 8.0% (81,250) |
Number of households with income $150k - 200k:| Granby: | 11.8% (83,605) |
| State: | 11.8% (119,527) |
Number of households with income > $200k:| Granby: | 18.4% (130,880) |
| State: | 18.6% (187,875) |
Aggregate household income in Granby in 2022: $11,088,889,875
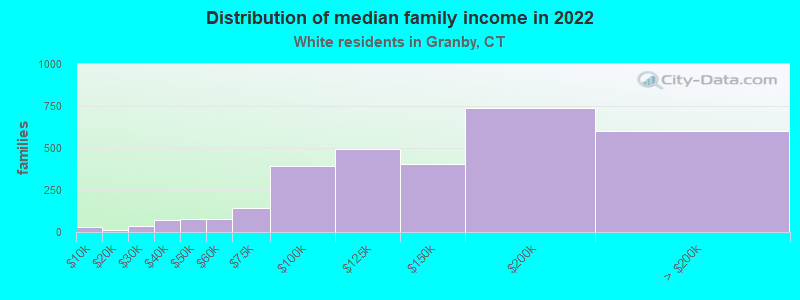
Median family income in Granby in 2022:| Granby: | $164,684 |
| State: | $128,955 |
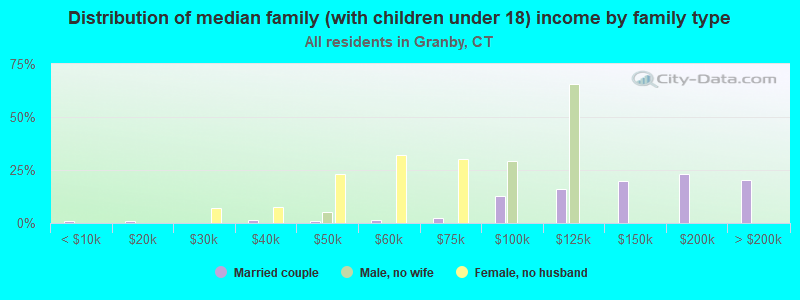
Number of families with income < $10k:| Granby: | 0.9% (27) |
| State: | 1.9% (11,537) |
Number of families with income $10k - 20k:| Granby: | 0.4% (12) |
| Connecticut: | 1.8% (11,289) |
Number of families with income $20k - 30k:| Granby: | 1.2% (38) |
| State: | 3.0% (18,506) |
Number of families with income $30k - 40k:| Granby: | 2.4% (72) |
| State: | 2.9% (18,160) |
Number of families with income $40k - 50k:| Granby: | 2.5% (78) |
| State: | 3.9% (24,550) |
Number of families with income $50k - 60k:| Granby: | 2.5% (78) |
| Connecticut: | 4.3% (26,723) |
Number of families with income $60k - 75k:| Granby: | 4.6% (142) |
| State: | 7.1% (44,075) |
Number of families with income $75k - 100k:| Granby: | 12.7% (391) |
| State: | 12.5% (77,679) |
Number of families with income $100k - 125k:| Granby: | 16.1% (496) |
| State: | 11.1% (69,086) |
Number of families with income $125k - 150k:| Granby: | 13.1% (403) |
| State: | 9.6% (59,616) |
Number of families with income $150k - 200k:| Granby: | 23.9% (736) |
| State: | 15.7% (97,890) |
Number of families with income > $200k:| Granby: | 19.6% (602) |
| State: | 26.3% (163,417) |
Median non-family income in Granby in 2022:| Granby: | $77,129 |
| Connecticut: | $54,067 |
Change in median non-family income between 2000 and 2022:| Granby, Connecticut: | +73.7% |
| Connecticut: | +68.7% |
Median per capita income in Granby in 2022:| Granby: | $64,861 |
| State: | $59,916 |
Change in median per capita income between 2000 and 2022:| Granby, Connecticut: | +92.1% |
| State: | +90.2% |
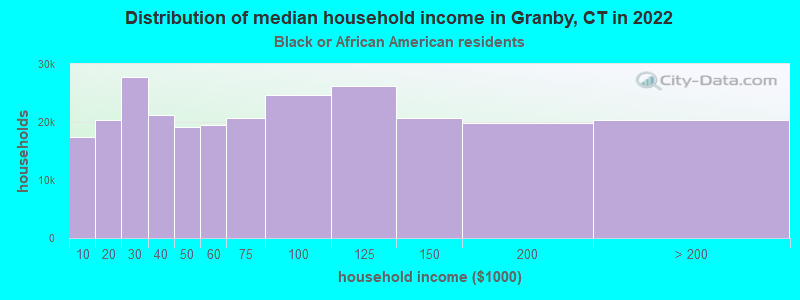
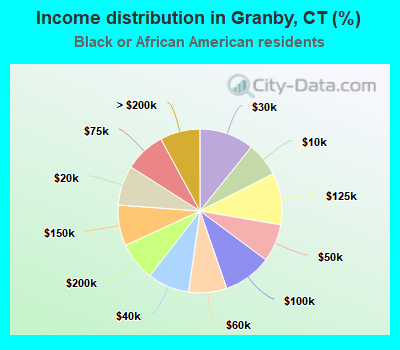
Income statistics for Black or African American residents
Median household income in Granby, CT in 2022:| Granby: | $104,088 |
| State: | $61,803 |
Change in median household income between 2000 and 2022:| Granby, Connecticut: | +60.9% |
| State: | +76.1% |
Number of households with income < $10k:| Granby: | 6.8% (17,495) |
| State: | 6.8% (9,494) |
Number of households with income $10k - 20k:| Granby: | 7.9% (20,276) |
| State: | 7.9% (11,003) |
Number of households with income $20k - 30k:| Granby: | 10.8% (27,724) |
| State: | 10.8% (15,045) |
Number of households with income $30k - 40k:| Granby: | 8.2% (21,193) |
| Connecticut: | 8.2% (11,501) |
Number of households with income $40k - 50k:| Granby: | 7.4% (19,194) |
| State: | 7.4% (10,416) |
Number of households with income $50k - 60k:| Granby: | 7.5% (19,412) |
| Connecticut: | 7.5% (10,534) |
Number of households with income $60k - 75k:| Granby: | 8.0% (20,720) |
| State: | 8.0% (11,244) |
Number of households with income $75k - 100k:| Granby: | 9.6% (24,638) |
| State: | 9.6% (13,370) |
Number of households with income $100k - 125k:| Granby: | 10.2% (26,248) |
| State: | 10.2% (14,244) |
Number of households with income $125k - 150k:| Granby: | 8.0% (20,724) |
| State: | 8.0% (11,246) |
Number of households with income $150k - 200k:| Granby: | 7.7% (19,767) |
| Connecticut: | 7.7% (10,727) |
Number of households with income > $200k:| Granby: | 7.9% (20,429) |
| State: | 7.9% (11,086) |
Aggregate household income in Granby in 2022: $9,683,883
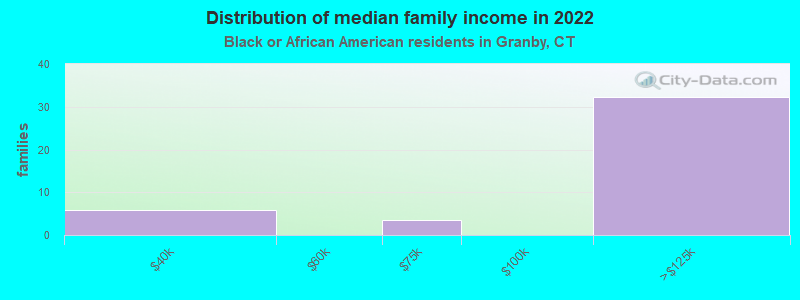
Median family income in Granby in 2022:| Granby: | $143,735 |
| State: | $87,228 |
Number of families with income $30k - 40k:| Granby: | 14.1% (6) |
| Connecticut: | 7.7% (6,445) |
Number of families with income $60k - 75k:| Granby: | 8.3% (3) |
| State: | 8.2% (6,861) |
Number of families with income $100k - 125k:| Granby: | 77.6% (32) |
| State: | 11.4% (9,482) |
Median per capita income in Granby in 2022:| Granby: | $92,721 |
| State: | $36,289 |
Change in median per capita income between 2000 and 2022:| Granby, Connecticut: | +115.2% |
| Connecticut: | +117.5% |
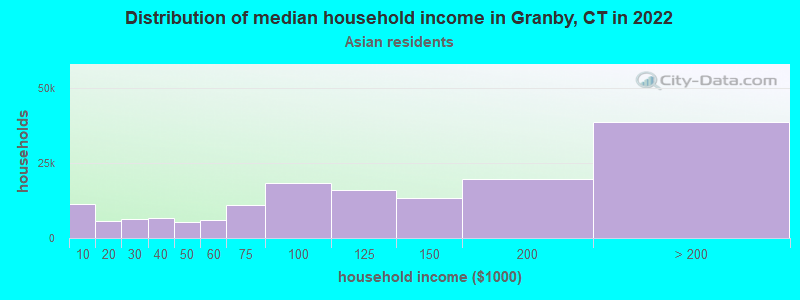
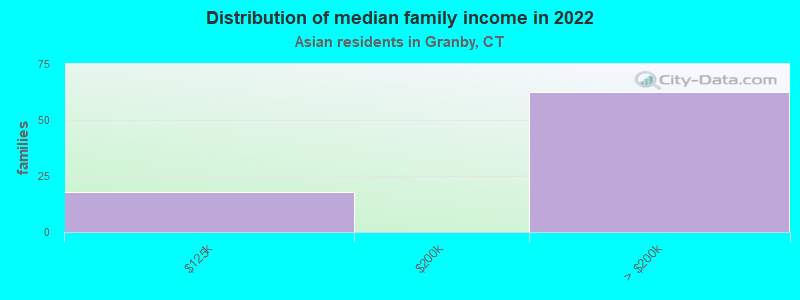
Income statistics for Asian residents
Median household income in Granby, CT in 2022:| Granby: | $341,392 |
| State: | $110,568 |
Change in median household income between 2000 and 2022:| Granby, Connecticut: | +110.1% |
| State: | +79.5% |
Number of households with income < $10k:| Granby: | 7.1% (11,201) |
| State: | 7.1% (4,245) |
Number of households with income $10k - 20k:| Granby: | 3.5% (5,507) |
| Connecticut: | 3.5% (2,087) |
Number of households with income $20k - 30k:| Granby: | 4.1% (6,501) |
| State: | 4.1% (2,464) |
Number of households with income $30k - 40k:| Granby: | 4.1% (6,538) |
| State: | 4.1% (2,478) |
Number of households with income $40k - 50k:| Granby: | 3.3% (5,232) |
| State: | 3.3% (1,983) |
Number of households with income $50k - 60k:| Granby: | 3.9% (6,143) |
| State: | 3.9% (2,328) |
Number of households with income $60k - 75k:| Granby: | 7.0% (11,156) |
| State: | 7.0% (4,228) |
Number of households with income $75k - 100k:| Granby: | 11.5% (18,235) |
| Connecticut: | 11.5% (6,911) |
Number of households with income $100k - 125k:| Granby: | 10.2% (16,166) |
| Connecticut: | 10.2% (6,127) |
Number of households with income $125k - 150k:| Granby: | 8.5% (13,401) |
| Connecticut: | 8.5% (5,079) |
Number of households with income $150k - 200k:| Granby: | 12.4% (19,615) |
| State: | 12.4% (7,434) |
Number of households with income > $200k:| Granby: | 24.4% (38,684) |
| Connecticut: | 24.4% (14,661) |
Aggregate household income in Granby in 2022: $14,926,537
Median family income in Granby in 2022:| Granby: | $337,693 |
| State: | $134,548 |
Number of families with income $100k - 125k:| Granby: | 22.2% (18) |
| State: | 10.5% (4,621) |
Number of families with income > $200k:| Granby: | 77.8% (63) |
| Connecticut: | 30.8% (13,522) |
Median per capita income in Granby in 2022:| Granby: | $130,349 |
| State: | $55,295 |
Change in median per capita income between 2000 and 2022:| Granby, Connecticut: | +103.6% |
| Connecticut: | +97.8% |
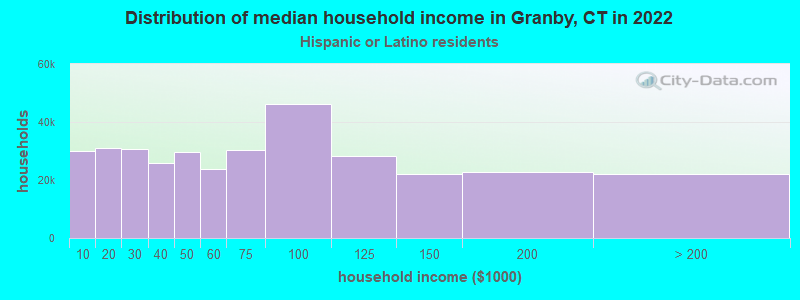
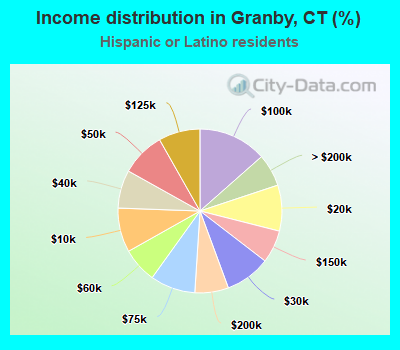
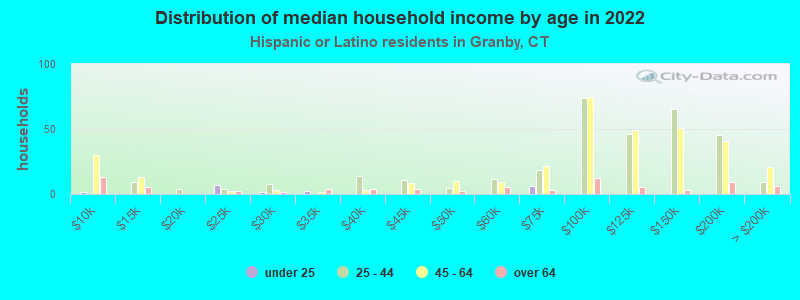
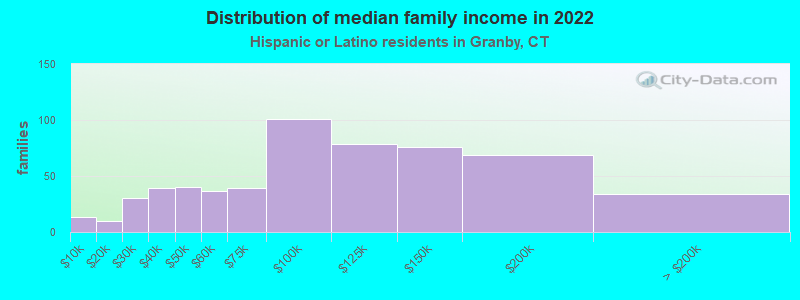
Income statistics for Hispanic or Latino residents
Median household income in Granby, CT in 2022:| Granby: | $86,782 |
| State: | $60,275 |
Change in median household income between 2000 and 2022:| Granby, Connecticut: | +67.8% |
| State: | +87.9% |
Number of households with income < $10k:| Granby: | 8.7% (29,966) |
| State: | 8.7% (18,584) |
Number of households with income $10k - 20k:| Granby: | 9.1% (31,015) |
| State: | 9.1% (19,235) |
Number of households with income $20k - 30k:| Granby: | 8.9% (30,618) |
| State: | 8.9% (18,989) |
Number of households with income $30k - 40k:| Granby: | 7.5% (25,746) |
| State: | 7.5% (15,967) |
Number of households with income $40k - 50k:| Granby: | 8.7% (29,775) |
| Connecticut: | 8.7% (18,466) |
Number of households with income $50k - 60k:| Granby: | 6.9% (23,713) |
| State: | 6.9% (14,706) |
Number of households with income $60k - 75k:| Granby: | 8.9% (30,456) |
| State: | 8.9% (18,888) |
Number of households with income $75k - 100k:| Granby: | 13.5% (46,227) |
| State: | 13.5% (28,669) |
Number of households with income $100k - 125k:| Granby: | 8.2% (28,111) |
| State: | 8.2% (17,434) |
Number of households with income $125k - 150k:| Granby: | 6.5% (22,174) |
| State: | 6.5% (13,752) |
Number of households with income $150k - 200k:| Granby: | 6.6% (22,758) |
| State: | 6.6% (14,114) |
Number of households with income > $200k:| Granby: | 6.4% (21,978) |
| Connecticut: | 6.4% (13,630) |
Aggregate household income in Granby in 2022: $17,982,353
Median family income in Granby in 2022:| Granby: | $133,854 |
| Connecticut: | $68,336 |
Number of families with income < $10k:| Granby: | 2.4% (13) |
| State: | 5.2% (7,456) |
Number of families with income $10k - 20k:| Granby: | 1.7% (10) |
| Connecticut: | 6.0% (8,616) |
Number of families with income $20k - 30k:| Granby: | 5.2% (30) |
| State: | 8.9% (12,680) |
Number of families with income $30k - 40k:| Granby: | 6.9% (39) |
| State: | 8.5% (12,090) |
Number of families with income $40k - 50k:| Granby: | 7.1% (40) |
| State: | 8.8% (12,624) |
Number of families with income $50k - 60k:| Granby: | 6.5% (37) |
| State: | 8.4% (11,924) |
Number of families with income $60k - 75k:| Granby: | 6.8% (39) |
| State: | 8.9% (12,677) |
Number of families with income $75k - 100k:| Granby: | 17.7% (101) |
| Connecticut: | 14.3% (20,457) |
Number of families with income $100k - 125k:| Granby: | 14.0% (79) |
| State: | 8.2% (11,720) |
Number of families with income $125k - 150k:| Granby: | 13.5% (76) |
| State: | 8.2% (11,729) |
Number of families with income $150k - 200k:| Granby: | 12.2% (69) |
| State: | 7.1% (10,096) |
Number of families with income > $200k:| Granby: | 6.0% (34) |
| State: | 7.4% (10,622) |
Median non-family income in Granby in 2022:| Granby: | $64,586 |
| State: | $36,714 |
Change in median non-family income between 2000 and 2022:| Granby, Connecticut: | +73.9% |
| State: | +90.0% |
Median per capita income in Granby in 2022:| Granby: | $37,435 |
| State: | $28,507 |
Change in median per capita income between 2000 and 2022:| Granby, Connecticut: | +80.3% |
| Connecticut: | +117.2% |
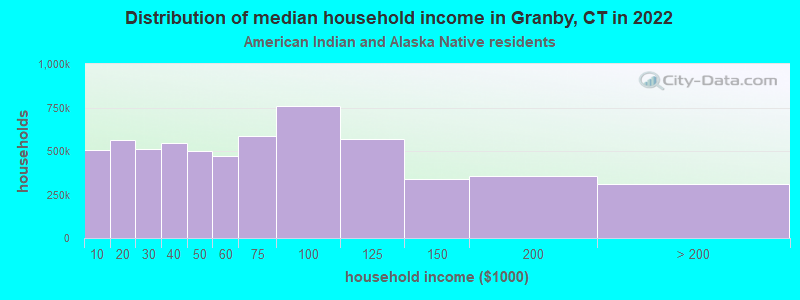
Income statistics for American Indian and Alaska Native residents
Median household income in Granby, CT in 2022:| Granby: | $200,178 |
| State: | $41,848 |
Change in median household income between 2000 and 2022:| Granby, Connecticut: | +12.9% |
| State: | +12.9% |
Number of households with income < $10k:| Granby: | 8.4% (504,336) |
| State: | 10.2% (340) |
Number of households with income $10k - 20k:| Granby: | 9.4% (562,826) |
| State: | 8.5% (283) |
Number of households with income $20k - 30k:| Granby: | 8.5% (509,083) |
| State: | 9.4% (314) |
Number of households with income $30k - 40k:| Granby: | 9.1% (545,420) |
| State: | 10.1% (337) |
Number of households with income $40k - 50k:| Granby: | 8.3% (500,296) |
| Connecticut: | 13.4% (447) |
Number of households with income $50k - 60k:| Granby: | 7.8% (471,738) |
| State: | 3.1% (104) |
Number of households with income $60k - 75k:| Granby: | 9.8% (588,000) |
| State: | 5.6% (188) |
Number of households with income $75k - 100k:| Granby: | 12.6% (759,014) |
| State: | 13.4% (447) |
Number of households with income $100k - 125k:| Granby: | 9.4% (567,591) |
| State: | 9.5% (317) |
Number of households with income $125k - 150k:| Granby: | 5.6% (339,814) |
| State: | 3.9% (131) |
Number of households with income $150k - 200k:| Granby: | 6.0% (358,229) |
| Connecticut: | 6.3% (212) |
Number of households with income > $200k:| Granby: | 5.2% (310,067) |
| State: | 6.8% (228) |
Aggregate household income in Granby in 2022: $993,833
Median family income in Granby in 2022:| Granby: | $242,351 |
| Connecticut: | $57,217 |
Number of families with income $150k - 200k:| Granby: | 100.0% (39) |
| Connecticut: | 10.3% (207) |
Median per capita income in Granby in 2022:| Granby: | $255,280 |
| State: | $25,355 |
Change in median per capita income between 2000 and 2022:| Granby, Connecticut: | +45.9% |
| Connecticut: | +39.4% |
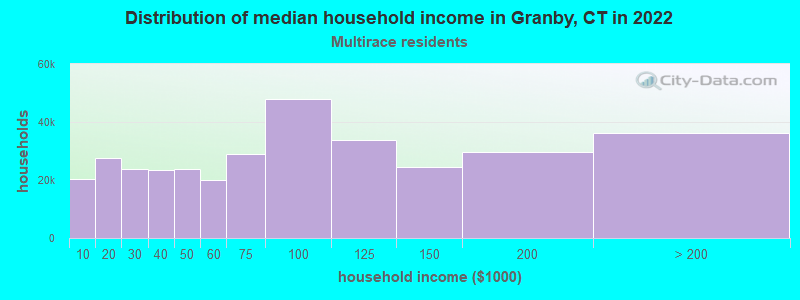
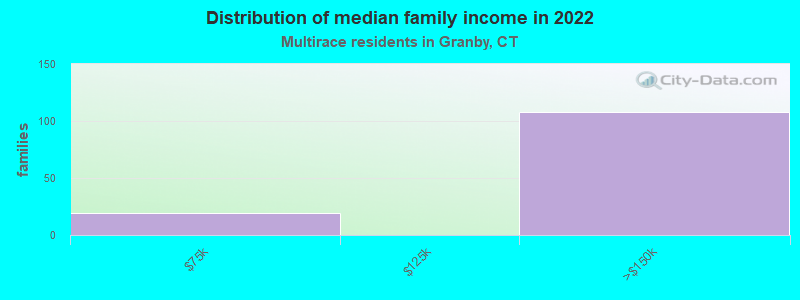
Income statistics for Multirace residents
Median household income in Granby, CT in 2022:| Granby: | $216,700 |
| State: | $77,277 |
Change in median household income between 2000 and 2022:| Granby, Connecticut: | +119.4% |
| State: | +113.6% |
Number of households with income < $10k:| Granby: | 6.0% (20,350) |
| State: | 6.0% (7,457) |
Number of households with income $10k - 20k:| Granby: | 8.1% (27,669) |
| State: | 8.1% (10,139) |
Number of households with income $20k - 30k:| Granby: | 7.0% (23,747) |
| State: | 7.0% (8,702) |
Number of households with income $30k - 40k:| Granby: | 6.9% (23,322) |
| State: | 6.9% (8,546) |
Number of households with income $40k - 50k:| Granby: | 7.0% (23,775) |
| State: | 7.0% (8,712) |
Number of households with income $50k - 60k:| Granby: | 5.9% (20,006) |
| State: | 5.9% (7,331) |
Number of households with income $60k - 75k:| Granby: | 8.5% (29,020) |
| State: | 8.5% (10,634) |
Number of households with income $75k - 100k:| Granby: | 14.1% (48,030) |
| Connecticut: | 14.1% (17,600) |
Number of households with income $100k - 125k:| Granby: | 9.9% (33,793) |
| State: | 9.9% (12,383) |
Number of households with income $125k - 150k:| Granby: | 7.2% (24,345) |
| State: | 7.2% (8,921) |
Number of households with income $150k - 200k:| Granby: | 8.8% (29,806) |
| State: | 8.8% (10,922) |
Number of households with income > $200k:| Granby: | 10.6% (36,150) |
| State: | 10.6% (13,247) |
Aggregate household income in Granby in 2022: $15,349,464
Median family income in Granby in 2022:| Granby: | $212,361 |
| State: | $84,255 |
Number of families with income $60k - 75k:| Granby: | 15.0% (19) |
| State: | 7.8% (6,550) |
Number of families with income $125k - 150k:| Granby: | 85.0% (108) |
| State: | 8.9% (7,503) |
Median per capita income in Granby in 2022:| Granby: | $33,291 |
| State: | $32,794 |
Change in median per capita income between 2000 and 2022:| Granby, Connecticut: | +95.5% |
| State: | +117.2% |
Income statistics for other residents
Number of households with income < $10k:| Granby: | 7.7% (2) |
| State: | 9.0% (8,596) |
Number of households with income $10k - 20k:| Granby: | 11.5% (3) |
| State: | 10.2% (9,773) |
Number of households with income $20k - 30k:| Granby: | 7.7% (2) |
| State: | 9.1% (8,691) |
Number of households with income $30k - 40k:| Granby: | 7.7% (2) |
| State: | 7.8% (7,447) |
Number of households with income $40k - 50k:| Granby: | 7.7% (2) |
| State: | 8.2% (7,860) |
Number of households with income $50k - 60k:| Granby: | 3.8% (1) |
| Connecticut: | 6.0% (5,757) |
Number of households with income $60k - 75k:| Granby: | 7.7% (2) |
| State: | 9.3% (8,942) |
Number of households with income $75k - 100k:| Granby: | 15.4% (4) |
| State: | 14.3% (13,700) |
Number of households with income $100k - 125k:| Granby: | 7.7% (2) |
| State: | 7.2% (6,906) |
Number of households with income $125k - 150k:| Granby: | 7.7% (2) |
| State: | 6.5% (6,215) |
Number of households with income $150k - 200k:| Granby: | 7.7% (2) |
| State: | 6.1% (5,865) |
Number of households with income > $200k:| Granby: | 7.7% (2) |
| State: | 6.3% (6,065) |
Aggregate household income in Granby in 2022: $3,464,226
Median family income in Granby in 2022:| Granby: | $120,428 |
| State: | $67,610 |
Number of families with income $50k - 60k:| Granby: | 100.0% (13) |
| State: | 5.9% (3,868) |
Median per capita income in Granby in 2022:| Granby: | $30,066 |
| State: | $29,353 |